. 2015 Aug;22(4):623-32.
doi: 10.1530/ERC-15-0058. Epub 2015 Jun 25.

Development of pheochromocytoma in ceramide synthase 2 null mice

Affiliations

Development of pheochromocytoma in ceramide synthase 2 null mice

Woo-Jae Park et al. Endocr Relat Cancer. 2015 Aug.

Abstract

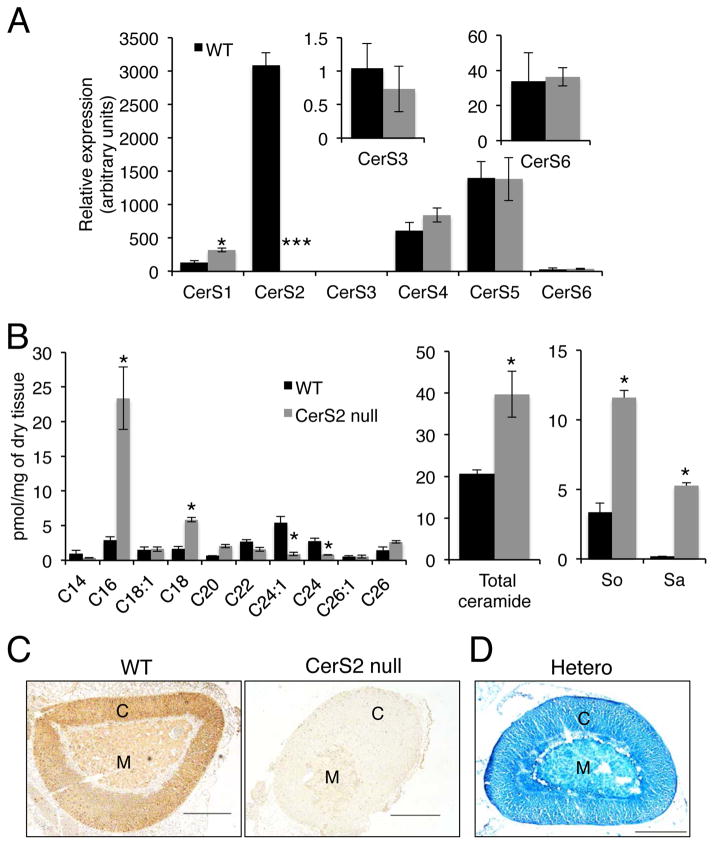
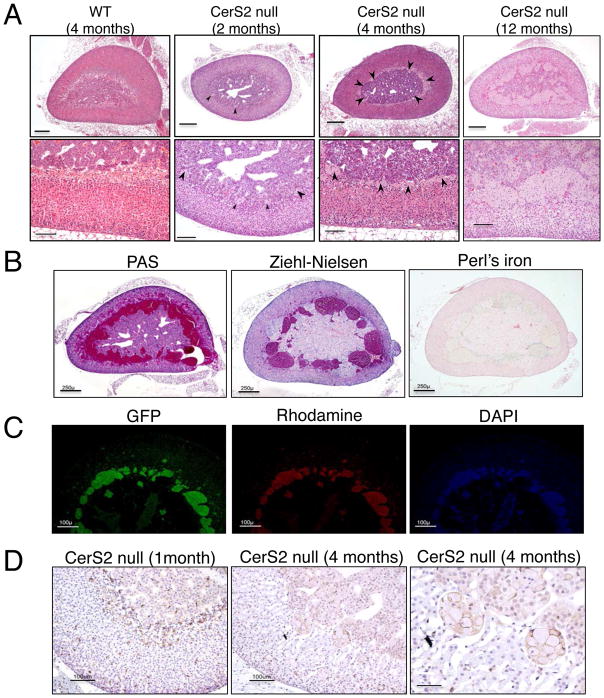
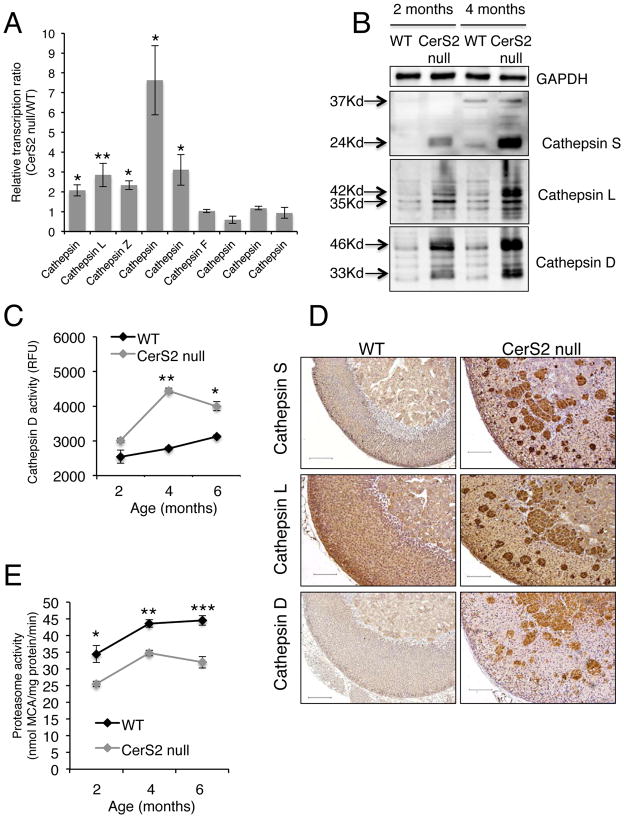
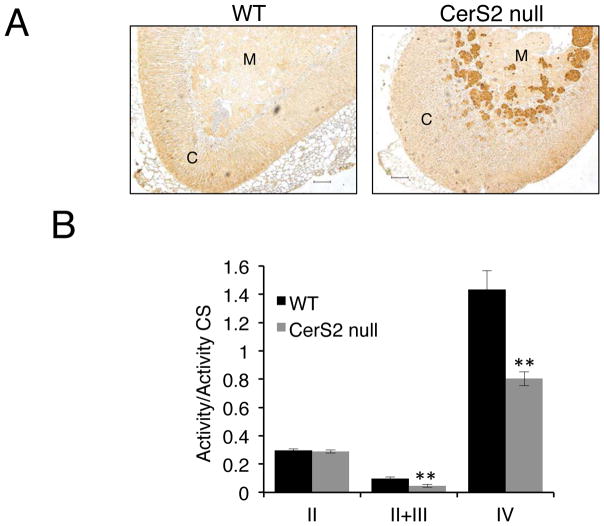
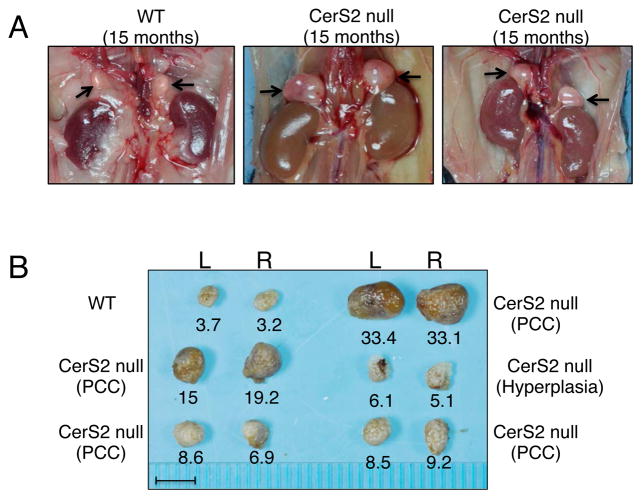
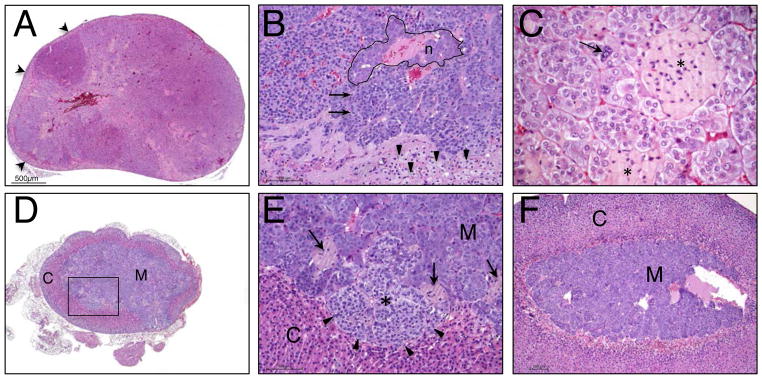
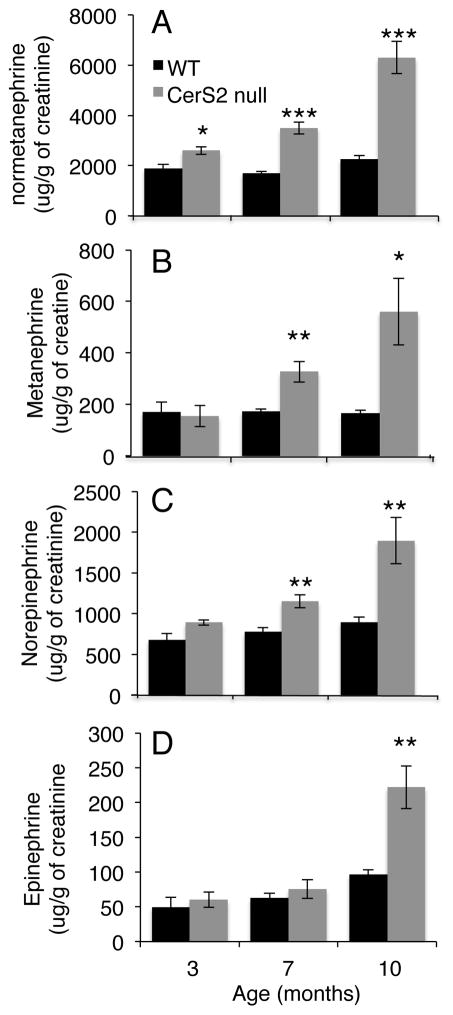
Pheochromocytoma (PCC) and paraganglioma are rare neuroendocrine tumors of the adrenal medulla and sympathetic and parasympathetic paraganglia, for which mutations in ∼15 disease-associated genes have been identified. We now document the role of an additional gene in mice, the ceramide synthase 2 (CerS2) gene. CerS2, one of six mammalian CerS, synthesizes ceramides with very-long (C22-C24) chains. The CerS2 null mouse has been well characterized and displays lesions in several organs including the liver, lung and the brain. We now demonstrate that changes in the sphingolipid acyl chain profile of the adrenal gland lead to the generation of adrenal medullary tumors. Histological analyses revealed that about half of the CerS2 null mice developed PCC by ∼13 months, and the rest showed signs of medullary hyperplasia. Norepinephrine and normetanephrine levels in the urine were elevated at 7 months of age consistent with the morphological abnormalities found at later ages. Accumulation of ceroid in the X-zone was observed as early as 2 months of age and as a consequence, older mice displayed elevated levels of lysosomal cathepsins, reduced proteasome activity and reduced activity of mitochondrial complex IV by 6 months of age. Together, these findings implicate an additional pathway that can lead to PCC formation, which involves alterations in the sphingolipid acyl chain length. Analysis of the role of sphingolipids in PCC may lead to further understanding of the mechanism by which PCC develops, and might implicate the sphingolipid pathway as a possible novel therapeutic target for this rare tumor.

Keywords: acyl chain length; ceramide; ceroid; lipofuscin; oxidative stress; pheochromocytoma; sphingolipid.


Conflict of interest statement

Declaration of interest

The authors declare no conflict of interest.

Figures

Figure 1
Figure 1
CerS2 is expressed at high levels in the adrenal gland. (A) Relative CerS mRNA levels in 2-month-old WT and CerS2 null mouse adrenal gland. Data are mean ± S.E.M., n=3. *P < 0.05, *** P < 0.001. (B) Ceramide and long chain base composition. The left-hand panel shows the acyl chain composition of ceramide, the middle panel levels of total ceramide and the right-hand panel levels of sphingosine (So) and sphinganine (Sa) in 4-month-old mice. Data are means ± S.E.M., n=2. *p< 0.05. (C) Immunostaining using an anti-CerS2 antibody in 2-month-old female mouse adrenal gland. Scale bar, 500 μm. C, cortex; M, medulla. (D) X-gal staining on cryo-sections of adrenal gland isolated from 3-month-old female CerS2 heterozygous mice. C, cortex; M, medulla. Scale bar, 500 μm.
Figure 2
Figure 2
Ceroid accumulation in CerS2 null mouse adrenal gland. (A) Hematoxylin and eosin staining. Arrowheads indicate ceroid accumulation in the X-zone. Scale bar, 250 μm (upper panels), 100 μm (lower panels). (B–C) Ceroid accumulation in the X-zone of the adrenal gland of 2–4 month-old male and female CerS2 null mice. Ceroid is PAS-positive, acid fast (Ziehl-Nielsen stain) and negative for iron (Perl’s iron stain) scale bars, 250μm (B),100 μm (C). (D) F4/80 staining of macrophages in adrenal gland of CerS 2 null mice at 1 and 4 months of age. Arrowheads are aggregates of macrophages which are found in the X-zone between the medulla and the cortex. The right-hand panel is an enlargement of the middle panel. Scale bar 25 μm.
Figure 3
Figure 3
Lysosomal enzyme overexpression and decreased proteasome activity. (A) Relative mRNA levels of cathepsins in the adrenal gland of CerS2 null mice. n=3; data are means ± S.E.M. *P < 0.05, **P < 0.01. (B) Representative western blot of cathepsins L, S and D in 2–4 month-old WT and CerS2 null mouse adrenal gland. GAPDH was used as loading control. (C) Activity of cathepsin D in 2, 4, and 6 month-old adrenal gland homogenates. n=3; data are means ± S.E.M. *P < 0.05, **P < 0.01. (D) Immunohistochemical staining of 4 month-old WT and CerS2 null adrenal gland using anti-cathepsin S, L and D antibodies. Scale bar, 50 μm. (E) 20S proteasome activity of WT and CerS2 null adrenal gland in 2,4 and 6 month-old adrenal gland homogenates. n=3. Data are means ± S.E.M. *P < 0.05, **P < 0.01, ***P < 0.001.
Figure 4
Figure 4
Oxidative stress in CerS2 null mouse adrenal gland. (A) HNE staining in 4 month-old mice. C, cortex, M, medulla. Scale bar, 100 μm. (B) Activity of mitochondrial respiratory complexes (II, II+III, and IV), normalized to citrate synthase (CS) in 6 month-old adrenal glands (n=3). Data are means ± S.E.M. **P < 0.01.
Figure 5
Figure 5
Macroscopic examination of PCC in CerS2 null mice. (A) Enlarged adrenal glands (black arrows) are observed in 15-month-old CerS2 null mice. (B) CerS2 null adrenal glands. The weight of the left (L) and right (R) adrenal gland (mg) of each mouse is given beneath each image. Scale bar, 5mm.
Figure 6
Figure 6
Microscopic analysis of PCC in CerS2 null mice. (A) Low magnification (4x) of a PCC in the adrenal gland of a 15 month-old CerS2 null mouse. (B) Medium magnification (20x) of a typical area at the edge of a complex pheochromocytoma. Neoplastic medullary cells occupy the top 3/4 of the field. Note the higher nuclear:cytoplasmic ratio of medullary (chromaffin) cells on the left versus the right. Arrows point to 2 mitotic figures in the transformed population. A group of neurons is delimited by a black line. Residual cortical cells are preserved at the bottom of the field (arrowheads). (C) High magnification (40x) of PCC. The neoplastic cells show a range of cellular and nuclear sizes (anisocytosis and anisokaryosis). A cell with a large nucleus is identified (arrow). There are clusters of ceroid-laden cells in the tumor (asterisks). (D) Low magnification (4x) of an adrenal gland from a case with medullary hyperplasia. The medulla (m) is somewhat expanded but the overall corticomeduallary architecture and ratio are relatively preserved. The boxed area is shown in E. (E) Medium magnification (20x) of the insert in panel D. A small nodule of hyperplastic medullary tissue is identified with an asterisk. Note the different appearance of chromaffin cells in the nodule; the cells have a higher nuclear: cytoplasmic ratio and their cytoplasm stains more lightly. The nodule causes compression of adjacent cortical cells (arrowheads). Several clusters of ceroid-laden cells are marked (arrows). (F) Medium magnification (10x) of an adrenal gland from a WT mouse. The cortex (C) and medulla (M) are defined.
Figure 7
Figure 7
Catecholamine levels are increased in the urine of CerS2 null mice. Levels of (A) normetanephrine, (B) metanephrine, (C) norepinephrine and (D) epinephrine in 3, 7 and 10 month-old WT and CerS2 null mouse urine (n=4–7). Data are means ± S.E.M. *P < 0.05, **P < 0.01, ***P < 0.001.

Similar articles

Cited by

References

    1. Ben-David O, Pewzner-Jung Y, Brenner O, Laviad EL, Kogot-Levin A, Weissberg I, Biton IE, Pienik R, Wang E, Kelly S, et al. Encephalopathy caused by ablation of very long acyl chain ceramide synthesis may be largely due to reduced galactosylceramide levels. Journal of Biological Chemistry. 2011;286:30022–30033. doi: 10.1074/jbc.M111.261206. - DOI - PMC - PubMed
    1. Chen A, Zorrilla E, Smith S, Rousso D, Levy C, Vaughan J, Donaldson C, Roberts A, Lee K-F, Vale W. Urocortin 2-deficient mice exhibit gender-specific alterations in circadian hypothalamus-pituitary-adrenal axis and depressive-like behavior. The Journal of Neuroscience. 2006;26:5500–5510. doi: 10.1523/JNEUROSCI.3955-05.2006. - DOI - PMC - PubMed
    1. Erez-Roman R, Pienik R, Futerman AH. Increased ceramide synthase 2 and 6 mRNA levels in breast cancer tissues and correlation with sphingosine kinase expression. Biochemical and Biophysical Research Communications. 2010;391:219–223. doi: 10.1016/j.bbrc.2009.11.035. - DOI - PubMed
    1. Fan S, Niu Y, Tan N, Wu Z, Wang Y, You H, Ke R, Song J, Shen Q, Wang W, et al. LASS2 enhances chemosensitivity of breast cancer by counteracting acidic tumor microenvironment through inhibiting activity of V-ATPase proton pump. Oncogene. 2013;32:1682–1690. doi: 10.1038/onc.2012.183. - DOI - PubMed
    1. Favier J, Gimenez-Roqueplo A-P. Pheochromocytomas: the (pseudo)-hypoxia hypothesis. Best Practice & Research. Clinical Endocrinology & Metabolism. 2010;24:957–968. doi: 10.1016/j.beem.2010.10.004. - DOI - PubMed

Publication types