Review
. 2015 Oct 15;24(R1):R74-84.
doi: 10.1093/hmg/ddv235. Epub 2015 Jun 25.

Application of single-cell genomics in cancer: promise and challenges

Affiliations
Review

Application of single-cell genomics in cancer: promise and challenges

Quin F Wills et al. Hum Mol Genet. .

Abstract

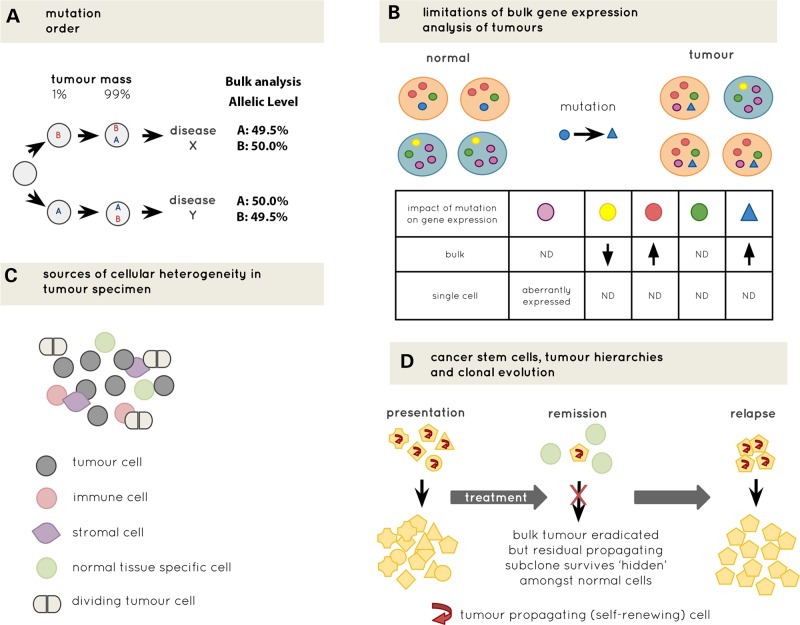
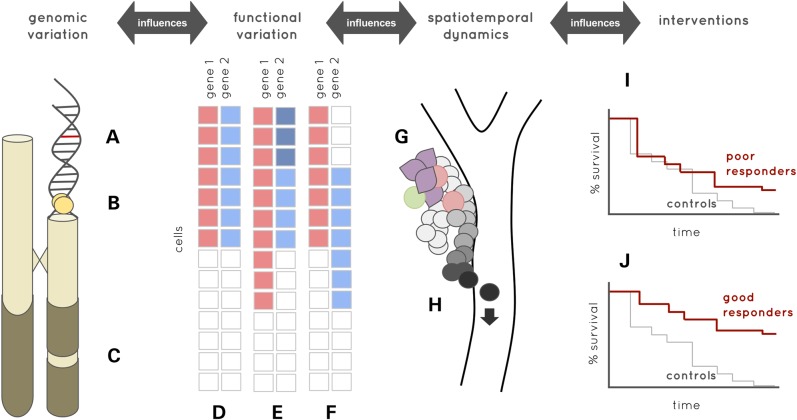
Recent advances in single-cell genomics are opening up unprecedented opportunities to transform cancer genomics. While bulk tissue genomic analysis across large populations of tumour cells has provided key insights into cancer biology, this approach does not provide the resolution that is critical for understanding the interaction between different genetic events within the cellular hierarchy of the tumour during disease initiation, evolution, relapse and metastasis. Single-cell genomic approaches are uniquely placed to definitively unravel complex clonal structures and tissue hierarchies, account for spatiotemporal cell interactions and discover rare cells that drive metastatic disease, drug resistance and disease progression. Here we present five challenges that need to be met for single-cell genomics to fulfil its potential as a routine tool alongside bulk sequencing. These might be thought of as being challenges related to samples (processing and scale for analysis), sensitivity and specificity of mutation detection, sources of heterogeneity (biological and technical), synergies (from data integration) and systems modelling. We discuss these in the context of recent advances in technologies and data modelling, concluding with implications for moving cancer research into the clinic.


Figures

Figure 1.
Figure 1.
Advantages of single-cell analysis. (A) Diagrammatic illustration of different consequences of mutation order on disease phenotype. Cells informative for mutation order may be very rare within tumours (1% in this example) and bulk sequencing is unlikely to have sufficient resolution to determine mutation order as reads for each mutation (A and B) will be almost identical for mutations with a very similar allelic level. (B) Comparison of single cell versus bulk gene expression analysis. Different coloured cells (orange and blue) represent different cell types. Different coloured spots within cells represent expression level of different genes. Acquisition of a somatic mutation in the blue gene causes an expansion of orange cells. The table shows the distinct gene-expression differences detected by single cell and bulk analysis. (C) Heterogeneity of cellular composition of tumours that would be lost through bulk analysis. (D) Diagrammatic illustration of hierarchical organization within tumours throughout the disease course. Yellow indicates tumour cells, green non-tumour cells and different shapes represent different subclones of cells. This hierarchical and clonal complexity would be lost through bulk analysis. ND indicates no difference.
Figure 2.
Figure 2.
Cancer systems genomics. Modelling cancer intra- and inter-patient heterogeneity requires four levels of information, the first being high-resolution estimates of (A) genetic, (B) epigenetic and (C) structural variation both in germline and cancer cells. This is complemented by integration with high-resolution estimates of functional variation, such as the example gene-expression heatmaps in samples (D–F). Cells in sample D form two clusters, based on low-level gene expression (shown as red and blue squares) and undetectable expression (shown as white squares). The genes in sample E show different patterns of altered expression. While there is an increase in the proportion of cells expressing gene 1 at a low level, gene 2 suggests a new sub-population of cells in which it is highly expressed (shown as dark blue squares). Cells in sample F cluster into the same four groups as the cells in sample E. However, this is due to differential co-expression rather than altered expression level or expression prevalence. Bulk sequencing would not be able to differentiate sample D from sample F. Spatiotemporal information during treatment is required to understand the influence of genomic variation, intervention and cell population dynamics on emergent behaviours such as drug resistance. Cell microenvironment (such as cells in colour in G) is thought to play a major role in most cancers, as is the plasticity of cell phenotype over time to allow distant metastases (H). Translating models of intra-patient heterogeneous processes into models of heterogeneous patient response, as shown by the Kaplan–Meier curves in (I) versus (J), is the goal of precision and stratified cancer pharmacogenomics.

References

    1. Stratton M.R., Campbell P.J., Futreal P.A. (2009) The cancer genome. Nature, 458, 719–724. - PMC - PubMed
    1. McGranahan N., Swanton C. (2015) Biological and therapeutic impact of intratumor heterogeneity in cancer evolution. Cancer Cell, 27, 15–26. - PubMed
    1. Nowell P.C. (1976) The clonal evolution of tumor cell populations. Science, 194, 23–28. - PubMed
    1. Yates L.R., Campbell P.J. (2012) Evolution of the cancer genome. Nat. Rev. Genet., 13, 795–806. - PMC - PubMed
    1. Ding L., Wendl M.C., McMichael J.F., Raphael B.J. (2014) Expanding the computational toolbox for mining cancer genomes. Nat. Rev. Genet., 15, 556–570. - PMC - PubMed

Publication types