. 2015 Jun 26;348(6242):aaa6071.
doi: 10.1126/science.aaa6071.

HEART DEVELOPMENT. Integration of Bmp and Wnt signaling by Hopx specifies commitment of cardiomyoblasts

Affiliations

HEART DEVELOPMENT. Integration of Bmp and Wnt signaling by Hopx specifies commitment of cardiomyoblasts

Rajan Jain et al. Science. .

Abstract

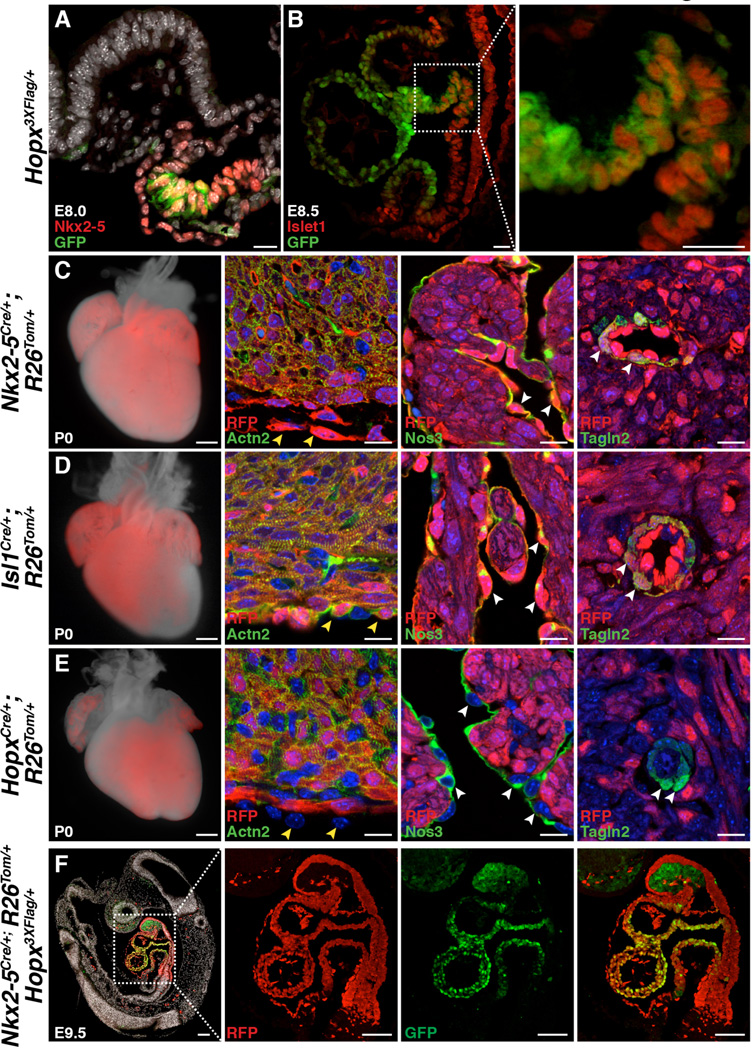
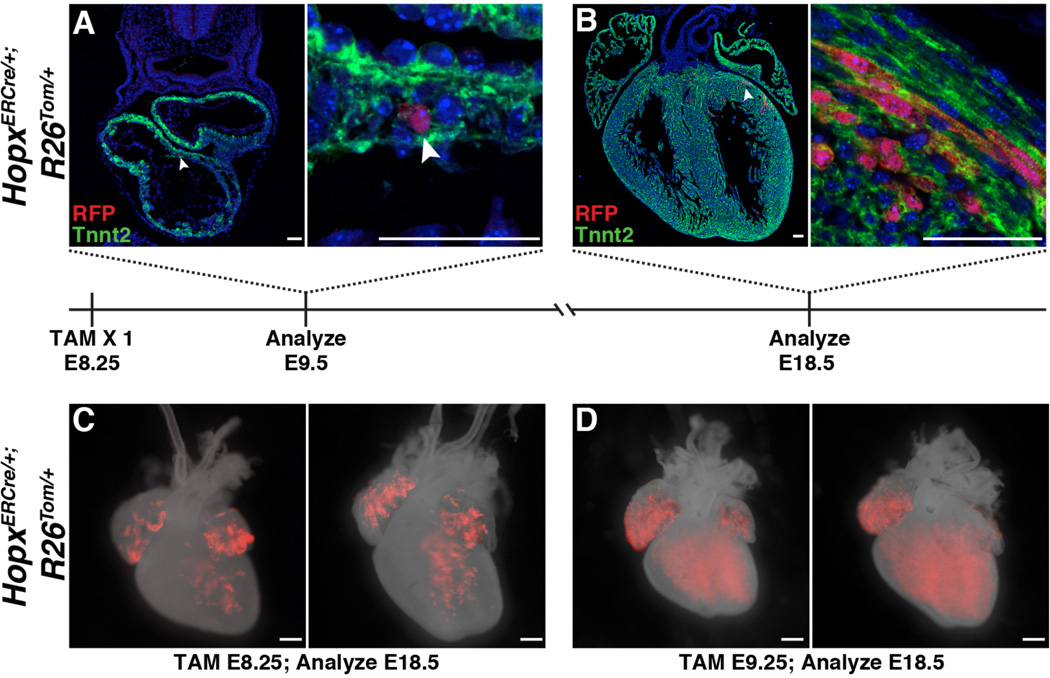
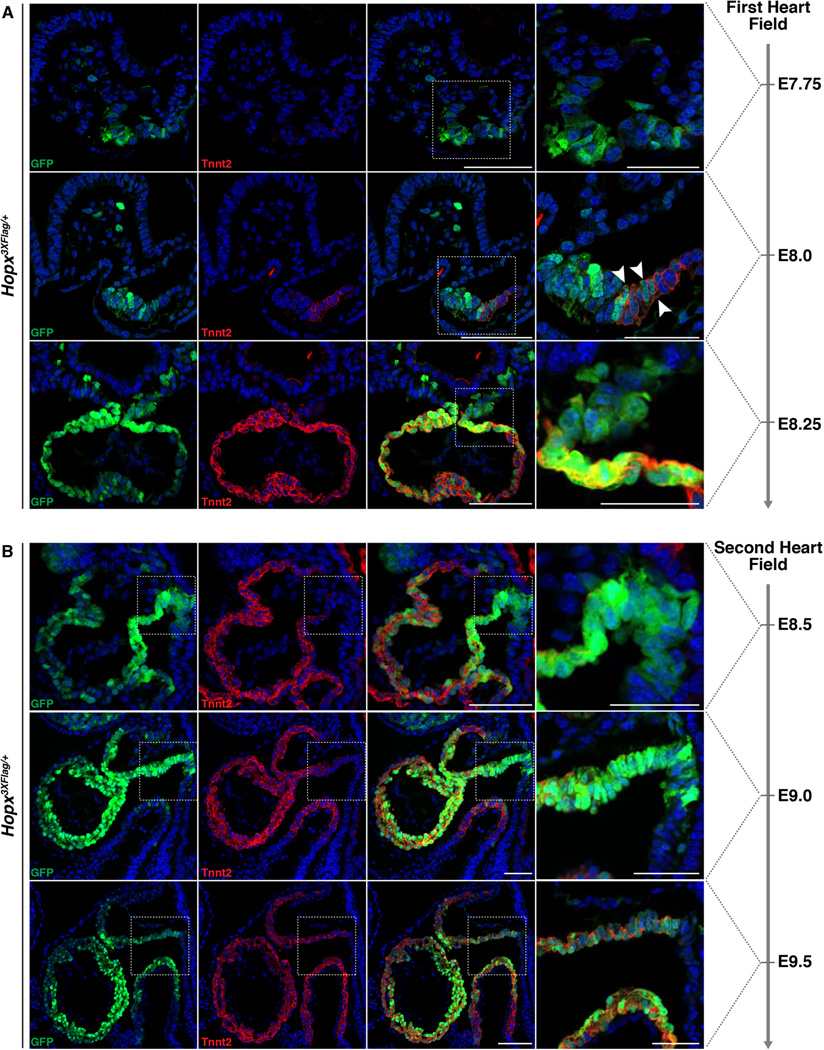
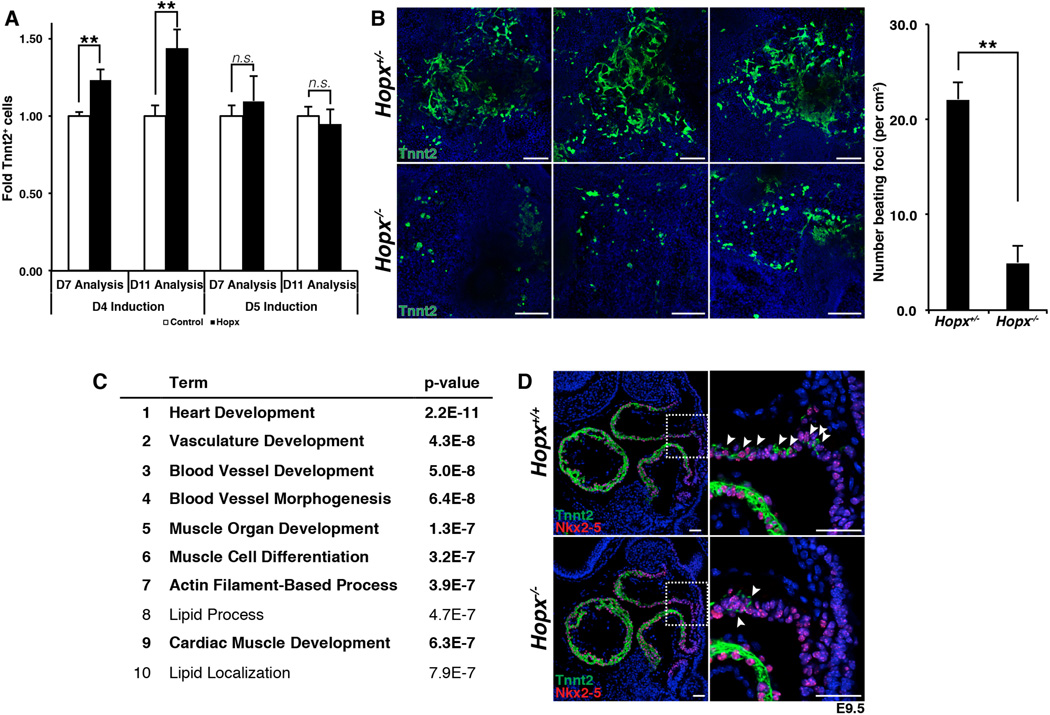
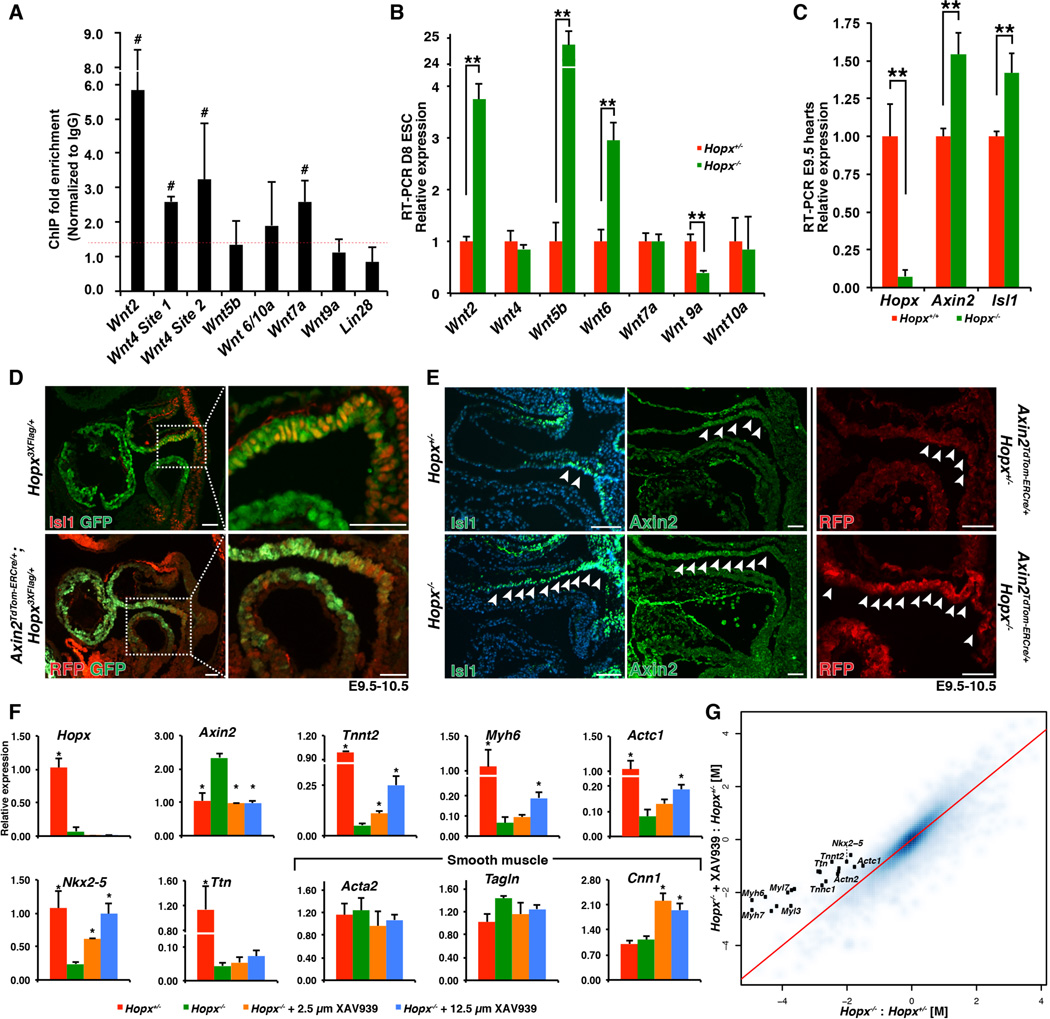
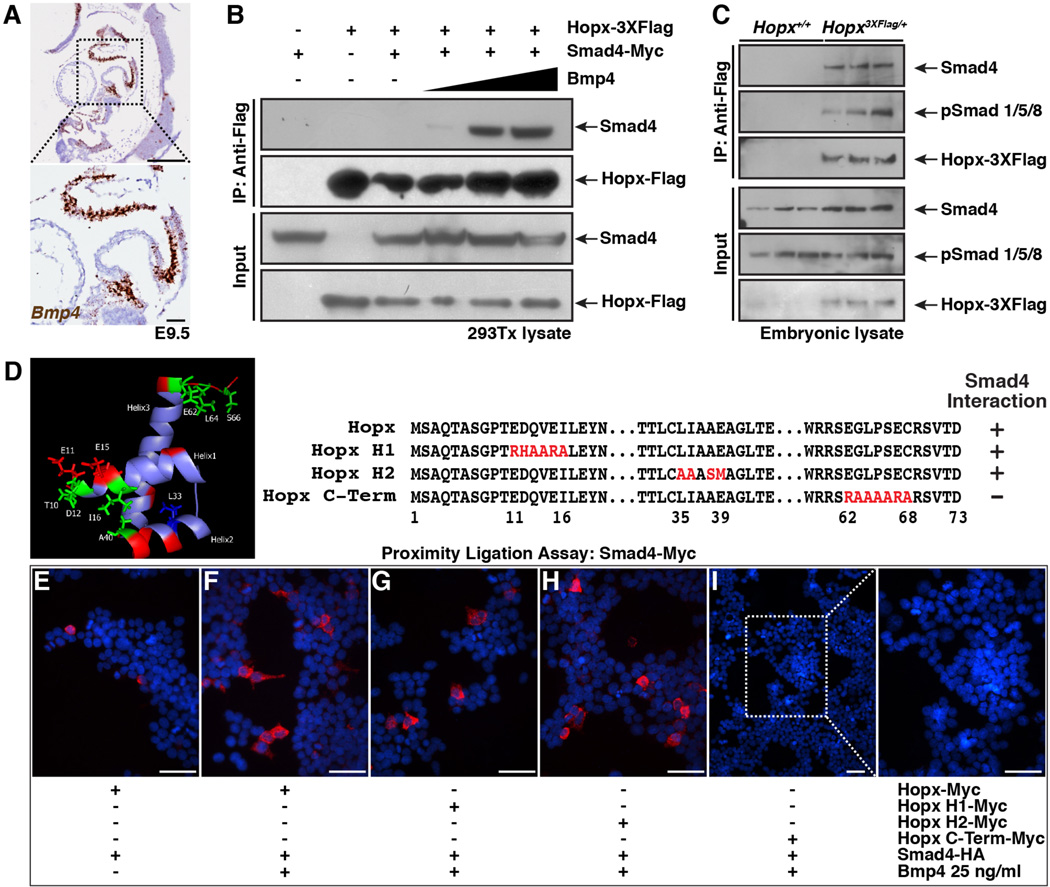
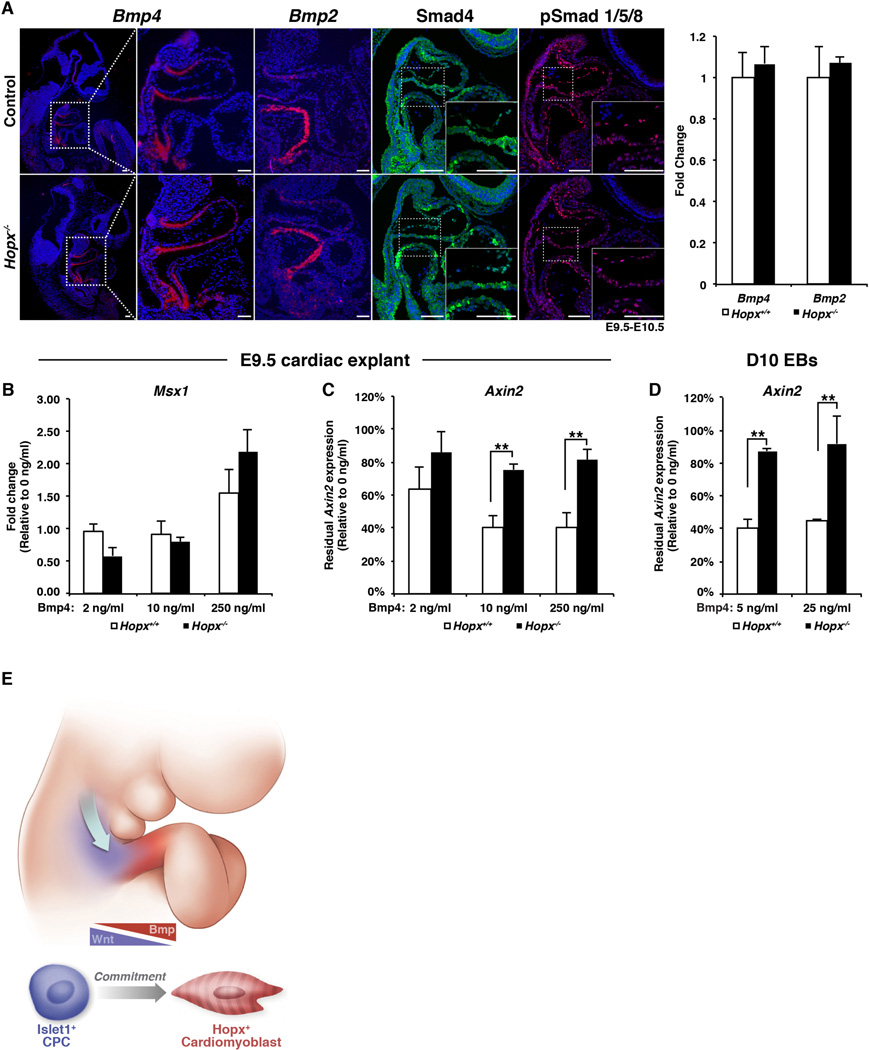
Cardiac progenitor cells are multipotent and give rise to cardiac endothelium, smooth muscle, and cardiomyocytes. Here, we define and characterize the cardiomyoblast intermediate that is committed to the cardiomyocyte fate, and we characterize the niche signals that regulate commitment. Cardiomyoblasts express Hopx, which functions to coordinate local Bmp signals to inhibit the Wnt pathway, thus promoting cardiomyogenesis. Hopx integrates Bmp and Wnt signaling by physically interacting with activated Smads and repressing Wnt genes. The identification of the committed cardiomyoblast that retains proliferative potential will inform cardiac regenerative therapeutics. In addition, Bmp signals characterize adult stem cell niches in other tissues where Hopx-mediated inhibition of Wnt is likely to contribute to stem cell quiescence and to explain the role of Hopx as a tumor suppressor.


Figures

Fig. 1
Fig. 1. Prospective identification of cardiomyoblasts
(A) A subset of E8.0 Nkx2-5+ cells in the FHF precardiac mesoderm express Hopx. (B) A subset of E8.5 Isl1+ SHF cells in the outflow tract express Hopx (inset highlights distal outflow tract). (C,D) Nkx2-5+ (C) and Isl1+ (D) cells give rise to myocytes (Actn2+), epicardium (yellow arrowheads), endothelium (Nos3+, white arrowheads), and smooth muscle (Tagln2+, white arrowheads) at P0. (E) Hopx+ cells give rise to myocytes, not epicardium (yellow arrowheads), endothelium (white arrowheads), or smooth muscle (white arrowheads) at P0. (F) Hopx+ cells (GFP+) derive from Nkx2-5+ cells (RFP+) (E9.5, sagittal section). Scale bars: 500 µm (C–E, whole mount), 100 µm (F), 25 µm (A,B), 10 µm (C–E, histology).
Fig. 2
Fig. 2. Cardiomyoblasts expand during cardiogenesis
(A,B) E8.25 HopxERCre/+; R26Tom/+ embryos were induced with tamoxifen and harvested at E9.5 (A) and E18.5 (B). Individual Hopx-derived cells are labeled at E9.5 (A, B area highlighted by arrowhead is magnified on right). At E18.5, clusters of myocytes are identified (B). (C,D) HopxERCre/+; R26Tom/+ embryos were induced with tamoxifen at E8.25 (C) or E9.25 (D) and analyzed at E18.5 (n ≥ 2 litters per time point, 2 examples at each time point shown). Scale bars: 500 µm (C,D) and 50 µm (A,B).
Fig. 3
Fig. 3. Hopx expression precedes troponin expression
(A) Hopx expression precedes Tnnt2 expression in the precardiac mesoderm/FHF at early time points during cardiac development. Hopx+, Tnnt2+ cells are identified a few hours later (white arrowheads). (B). The distal outflow tract and SHF mesoderm harbor Hopx+, Tnnt2 cells at early time points during cardiac development. Scale bars: 100 µm except right most panels/insets which are 50 µm.
Fig. 4
Fig. 4. Hopx promotes myogenesis
(A) Precocious expression of Hopx in CPCs at day 4 of EB differentiation results in more Tnnt2+ cells measured by flow cytometry. (B) Differentiation of Hopx−/− EBs results in fewer Tnnt2+ cells and fewer beating foci compared to Hopx+/− EBs (day 10). Images from 3 different replicates are shown. (C) Gene ontology analysis from microarrays done with triplicate samples of Hopx−/− vs. Hopx+/− EBs (top 3000 genes down-regulated, ranked by fold change, FDR cutoff = 10%, day 8, GOTERM_BP_FAT). (D) Paucity of Tnnt2+ cells (arrowheads) in the distal outflow tract Hopx−/− compared to Hopx+/+ embryos (E9.5). ** p<0.05. Scale bars: 500 µm (B), 50 µm (D).
Fig. 5
Fig. 5. Myogenesis requires inhibition of Wnt signaling
(A) ChIP-qPCR from E9.5 hearts. Wnt2, Wnt4 sites 1 and 2, and Wnt7a demonstrate greater than 1.4X enrichment (red dashed line) over IgG in all replicates (denoted by #, n≥3 replicates). (B) Expression analysis of Hopx−/− vs. Hopx+/− EBs (day 8). (C) qRT-PCR from littermate E9.5 microdissected hearts. (D) Isl1 (upper panels) and Axin2 (lower panels, RFP expression reflects Axin2 in an Axin2TdTom-ERCre/+ embryo, sagittal sections) are each coexpressed with Hopx in the cardiac OFT. (E) Isl1 and Axin2 expression is expanded in Hopx−/− (arrowheads point to Isl1+ and Axin2+ cells; middle panels show Axin2 IHC (green), right panels show RFP IHC in Axin2TdTom-ERCre/+ embryos). (F) qRT-PCR analyses of Hopx+/− day 8 EBs (red), or Hopx−/− EBs (green) with either 2.5µM (orange) or 12.5µM (blue) XAV939 (*p<0.05 in comparison to Hopx−/−). (G) Comparison of the log2-transformed fold change (M) of genes differentially expressed in Hopx−/− vs. Hopx+/− EBs (x-axis) versus Hopx−/− + 12.5 µm XAV939 vs. Hopx+/− (y-axis) (n=3 samples). Sarcomere-related genes annotated with black dots. Genes above the red line are partially normalized by Wnt inhibition. ** p<0.05, Scale bars 50 µm.
Fig. 6
Fig. 6. Hopx interacts with an activated Smad complex
(A) Bmp4 expression in control E9.5 heart (RNAscope in situ hybridization, brown; sagittal section). Inset focuses on outflow and inflow tracts. (B) Hopx co-immunoprecipitates with Smad4 in 293Tx cells in a Bmp4 dependent manner (0, 2, 10, 25 ng/ml Bmp4, 7.5% input). (C). Hopx co-immunoprecipitates with Smad4 and phospho-Smad1/5/8 in vivo (E9.5-E10 tissue lysates 3 independent examples of each genotype shown, 7.5% input). (D) NMR structure of Hopx (22) and schema of mutant constructs. (E–I) Proximity ligation assay using transfected 293Tx cells. Presence of Bmp4 and transfected plasmids are indicated. Best representative images from n=3 experiments shown. Scale bars: 250 µm (A, top) and 50 µm (A bottom, E–I).
Fig. 7
Fig. 7. Bmp signaling represses Wnt
(A) Expression of Bmp4, Bmp2 (in situ hybridization), Smad4, phospho-Smad1/5/8 (IHC) in control and Hopx−/− E9.5-10.5 embryonic hearts, and qRT-PCR of E9.5 hearts (right panel). (B,C) qRT-PCR of E9.5 hearts after culture in increasing concentrations of Bmp4. (D) qRT-PCR of day 10 Hopx+/− and Hopx−/− EBs after differentiation with Bmp4. Hopx−/− explants and EBs failed to repress Axin2 as effectively as controls in the presence of Bmp4 (n≥3 for each experiment in B–D). (E) Model: A “zone-of-commitment” in the developing OFT. Wnt-activated, Isl1+ CPCs stream into the OFT and are exposed to Bmp signaling. Hopx+ cardiomyoblasts are committed to the myocyte lineage. ** p<0.05, Scale bars: 100 µm.

Comment in

  • Hopx and the Cardiomyocyte Parentage.
    Schneider MD, Baker AH, Riley P. Schneider MD, et al. Mol Ther. 2015 Sep;23(9):1420-2. doi: 10.1038/mt.2015.140. Mol Ther. 2015. PMID: 26321185 Free PMC article. No abstract available.

References

    1. Epstein JA, Franklin H. Epstein Lecture. Cardiac development and implications for heart disease. N Engl J Med. 2010;363:1638–1647. - PubMed
    1. Kelly RG, Brown NA, Buckingham ME. The arterial pole of the mouse heart forms from Fgf10-expressing cells in pharyngeal mesoderm. Dev Cell. 2001;1:435–440. - PubMed
    1. Waldo KL, et al. Conotruncal myocardium arises from a secondary heart field. Development. 2001;128:3179–3188. - PubMed
    1. Cai CL, et al. Isl1 identifies a cardiac progenitor population that proliferates prior to differentiation and contributes a majority of cells to the heart. Dev Cell. 2003;5:877–889. - PMC - PubMed
    1. Kattman SJ, Huber TL, Keller GM. Multipotent flk-1+ cardiovascular progenitor cells give rise to the cardiomyocyte, endothelial, and vascular smooth muscle lineages. Dev Cell. 2006;11:723–732. - PubMed

Publication types

MeSH terms