. 2015 Jun 26;10(6):e0127563.
doi: 10.1371/journal.pone.0127563. eCollection 2015.

The Changing Strength and Nature of Fire-Climate Relationships in the Northern Rocky Mountains, U.S.A., 1902-2008

Affiliations

The Changing Strength and Nature of Fire-Climate Relationships in the Northern Rocky Mountains, U.S.A., 1902-2008

Philip E Higuera et al. PLoS One. .

Abstract

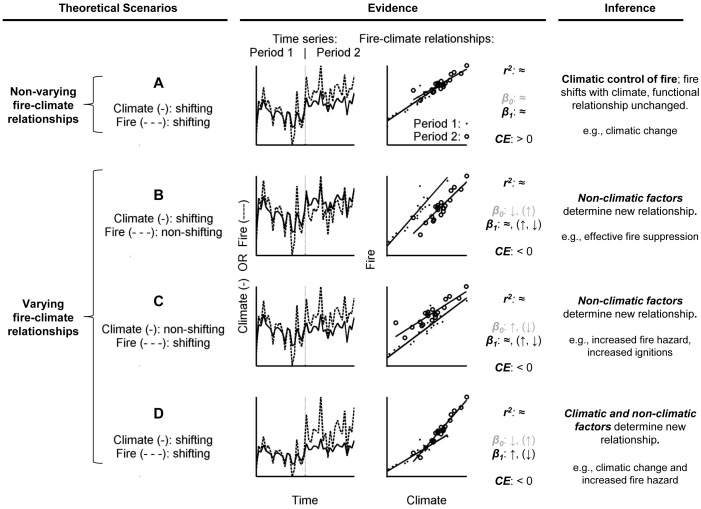
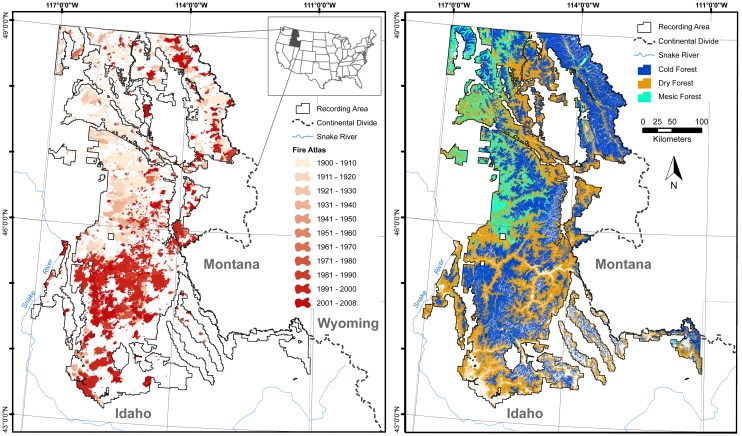
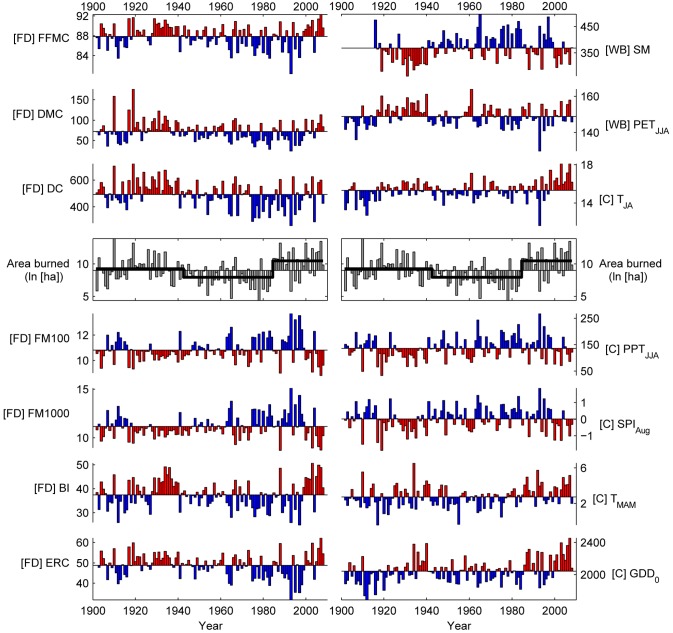
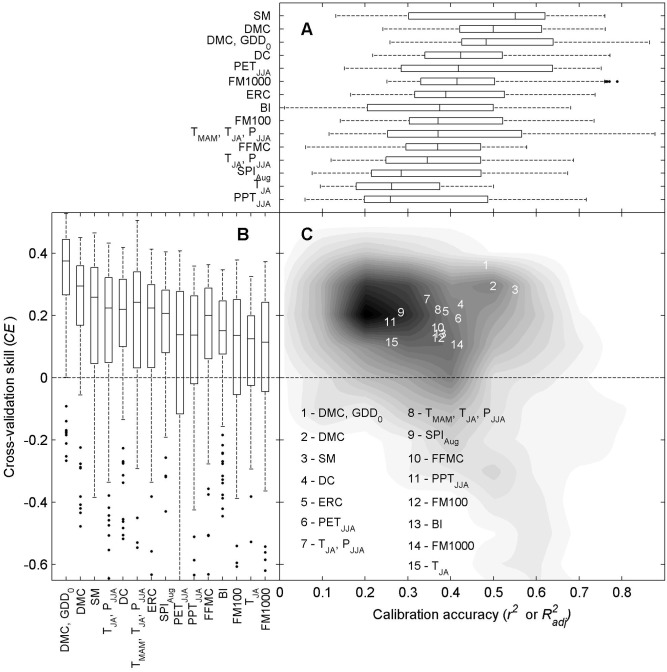
Time-varying fire-climate relationships may represent an important component of fire-regime variability, relevant for understanding the controls of fire and projecting fire activity under global-change scenarios. We used time-varying statistical models to evaluate if and how fire-climate relationships varied from 1902-2008, in one of the most flammable forested regions of the western U.S.A. Fire-danger and water-balance metrics yielded the best combination of calibration accuracy and predictive skill in modeling annual area burned. The strength of fire-climate relationships varied markedly at multi-decadal scales, with models explaining < 40% to 88% of the variation in annual area burned. The early 20th century (1902-1942) and the most recent two decades (1985-2008) exhibited strong fire-climate relationships, with weaker relationships for much of the mid 20th century (1943-1984), coincident with diminished burning, less fire-conducive climate, and the initiation of modern fire fighting. Area burned and the strength of fire-climate relationships increased sharply in the mid 1980s, associated with increased temperatures and longer potential fire seasons. Unlike decades with high burning in the early 20th century, models developed using fire-climate relationships from recent decades overpredicted area burned when applied to earlier periods. This amplified response of fire to climate is a signature of altered fire-climate-relationships, and it implicates non-climatic factors in this recent shift. Changes in fuel structure and availability following 40+ yr of unusually low fire activity, and possibly land use, may have resulted in increased fire vulnerability beyond expectations from climatic factors alone. Our results highlight the potential for non-climatic factors to alter fire-climate relationships, and the need to account for such dynamics, through adaptable statistical or processes-based models, for accurately predicting future fire activity.


Conflict of interest statement

Competing Interests: The authors have declared that no competing interests exist.

Figures

Fig 1
Fig 1. Generalized conceptual model for causes and signatures of shifting fire activity.
Scenarios include random variability in “climate” (i.e., a hypothetical metric linked to annual fire activity) which directly determines “fire activity” (e.g., annual area burned or number of large fires). Period 1 is identical in all scenarios, but the y axes are scaled based on values in Period 2. See “Introduction” for a description of each scenario. In all cases of varying fire-climate relationships, a coefficient of efficiency (CE) statistic < 0 indicates a lack of predictive skill (for periods outside of the calibration period). β0 (intercept) and β1 (slope) represent regression parameters; directional changes in parentheses represent hypothetical scenarios not illustrated in the figure.
Fig 2
Fig 2. The U.S. Northern Rockies study area in Idaho and portions of Montana, west of the Continental Divide.
Area burned, stratified by decade (left), and the three dominant forest types across the study area (right).
Fig 3
Fig 3. Fire-danger, water-balance, and climate predictors of annual area burned.
Series are plotted relative to the series mean, with red (blue) representing above (below) average conditions conducive for fire activity. The center row includes annual area burned (gray), expressed as ln(ha), with average values for each of three periods identified via piecewise linear regression (1902–1942, 1943–1984, 1985–2008). Metrics are organized based on their overall score (upper left to lower right; Table 2). Metric type is identified as “FD” (fire danger), “WB” (water balance), or “C” (climate), with units and temporal definitions listed in Table 1.
Fig 4
Fig 4. Calibration accuracy and cross-validation skill of potential predictors of annual area burned.
(A) Accuracy (r 2 or R 2 adj) from the 87 continuous 21-yr regression models. Metrics are ranked (top to bottom) based on the median value. Boxplots display the median, 25th, and 75th quantiles, and whiskers extend to extreme values not considered outliers. (B) Cross-validation skill, CE, for all 87 cross-validation periods. Metrics are ranked from left to right based on the median value; CE ≤ 0 indicates no predictive skill. (C) Calibration accuracy as a function of cross-validation skill, where darker grey indicates a greater proportion of values. Overall metric rank (i.e., CE * r 2 or R 2 adj) is indicated by the within-plot numbers.
Fig 5
Fig 5. Variability in the strength and nature of fire-climate relationships through time.
(A) Annual area burned in linear and log-transformed space (baseline = series-wide average; thick black line = period averages, as in Fig 3). (B) The changing strength of fire-climate relationships (r 2 or R 2 adj) for each 21-yr model. Metrics with the highest explanatory power are labeled, and the length of each overlapping calibration period is represented in the lower right of the panel (“Calib. window”). (C) Changing skill of fire-climate relationships, CE, as in (B). (D) Changing nature of fire-climate relationships, illustrated by varying model parameters through time. The y-axis is the standardized β1 parameter (for univariate models) or β1, β2 or β3 parameter for the three-variable models (illustrated by dashed lines), with mean 0, and standard deviation 1. Positive values represent a positive influence on area burned. Metrics are ordered from top to bottom based on the overall model score (Table 2).
Fig 6
Fig 6. Variability in fire-danger, water-balance, and climate metrics across discrete periods of fire activity.
Periods were identified by piecewise linear regression: Period 1 (1902–1942), Period 2 (1943–1984), Period 3 (1985–2008). Metrics are labeled as in Fig 3 and ordered from upper left to lower right based on the overall model score (Table 2). Metrics with significant among-period variability are highlighted with a bold x and y axis, and results of the post-hoc multiple comparison test are illustrated by lower case “a” “b” and “c” below the x axis. See Detecting changing fire-climate relationships… for details.
Fig 7
Fig 7. Cross-validation skill, model parameters, and strength of fire-climate relationships for top metrics.
Small symbols represent cross-validation skill and the regression parameter for 21-yr calibration windows, stratified by Period 1 (1902–1942, circles), Period 2 (1943–1984, squares) and Period 3 (1984–2008, triangles). The grayscale of each small symbol represents r 2 or R 2 adj for that window (as in Fig 5B), and large symbols represent the centroid of all values within each period, +/- one standard deviation. Regression parameters represent the slope of the model, β1, for single-variable regression models. GDD0 represents β2 from the combined DMC, GDD0 model, while PPTJJA, TJA, and TMAM represent β1, β2, and β3 from the three-variable model, respectively. Parameter values indicated the unit (standard deviation) change in log-transformed area burned for a unit (standard deviation) change in the predictor variable: more extreme values indicated a greater influence on annual area burned. Values below the dashed vertical line on the x axis (CE = 0) lack cross-validation skill. Metrics are ordered from upper left to bottom right based on the overall model score (Table 2).

Similar articles

Cited by

References

    1. Bowman DMJS, Balch JK, Artaxo P, Bond WJ, Carlson JM, Cochrane MA, et al. (2009) Fire in the Earth System. Science 324: 481–484. 10.1126/science.1163886 - DOI - PubMed
    1. Meehl GA, Stocker TF, Collins WD, Friedlingstein P, Gaye AT, Gregory JM, et al. (2007) Global Climate Projections In: Solomon S, Qin D, Manning M, Chen Z, Marquis M et al., editors. Climate Change 2007: The Physical Science Basis Contribution of Working Group I to the Fourth Assessment Report of the Intergovernmental Panel on Climate Change Cambridge, United Kingdom and New York, NY, USA: Cambridge University Press.
    1. Flannigan MD, Krawchuk MA, de Groot WJ, Wotton BM, Gowman LM (2009) Implications of changing climate for global wildland fire. International Journal of Wildland Fire 18: 483–507.
    1. Krawchuk MA, Moritz MA, Parisien MA, Van Dorn J, Hayhoe K (2009) Global Pyrogeography: the Current and Future Distribution of Wildfire. PLoS ONE 4: e5102 10.1371/journal.pone.0005102 - DOI - PMC - PubMed
    1. Pechony O, Shindell DT (2010) Driving forces of global wildfires over the past millennium and the forthcoming century. Proceedings of the National Academy of Sciences 107: 19167–19170. - PMC - PubMed

Publication types