. 2015 Jun 26;11(6):e1005290.
doi: 10.1371/journal.pgen.1005290. eCollection 2015 Jun.

Motor and Sensory Deficits in the teetering Mice Result from Mutation of the ESCRT Component HGS

Affiliations

Motor and Sensory Deficits in the teetering Mice Result from Mutation of the ESCRT Component HGS

Jennifer A Watson et al. PLoS Genet. .

Abstract

Neurons are particularly vulnerable to perturbations in endo-lysosomal transport, as several neurological disorders are caused by a primary deficit in this pathway. In this report, we used positional cloning to show that the spontaneously occurring neurological mutation teetering (tn) is a single nucleotide substitution in hepatocyte growth factor-regulated tyrosine kinase substrate (Hgs/Hrs), a component of the endosomal sorting complex required for transport (ESCRT). The tn mice exhibit hypokenesis, muscle weakness, reduced muscle size and early perinatal lethality by 5-weeks of age. Although HGS has been suggested to be essential for the sorting of ubiquitinated membrane proteins to the lysosome, there were no alterations in receptor tyrosine kinase levels in the central nervous system, and only a modest decrease in tropomyosin receptor kinase B (TrkB) in the sciatic nerves of the tn mice. Instead, loss of HGS resulted in structural alterations at the neuromuscular junction (NMJ), including swellings and ultra-terminal sprouting at motor axon terminals and an increase in the number of endosomes and multivesicular bodies. These structural changes were accompanied by a reduction in spontaneous and evoked release of acetylcholine, indicating a deficit in neurotransmitter release at the NMJ. These deficits in synaptic transmission were associated with elevated levels of ubiquitinated proteins in the synaptosome fraction. In addition to the deficits in neuronal function, mutation of Hgs resulted in both hypermyelinated and dysmyelinated axons in the tn mice, which supports a growing body of evidence that ESCRTs are required for proper myelination of peripheral nerves. Our results indicate that HGS has multiple roles in the nervous system and demonstrate a previously unanticipated requirement for ESCRTs in the maintenance of synaptic transmission.


Conflict of interest statement

SMW is a paid consultant for Progenra Incorporated. This does not alter the authors’ adherence to any of the PLOS Genetics policies on sharing data and materials, and it does not influence the generation or presentation of the data.

Figures

Fig 1
Fig 1. Positional cloning and phenotypic analysis of the tn mice.
(A) Image showing reduced size of 4-week-old Hgs tn/tn mice relative to wild type HGS +/+ mice. (B) Body mass of 3- to 5-week-old HGS +/+, heterozygous Hgs tn/+ and Hgs tn/tn mice. n > 6 mice per genotype. A two-way anova was used to find a significant effect of genotype on body mass. Symbols represent unpaired t-tests corrected for multiple comparisons using the Holm-Sidak method (C) Kaplan-Meier survival curve of wild type (Hgs +/+) and Hgs-mutant mice. The Hgs KO allele does not complement the Hgs tn allele. A Mantel-Cox test with p<0.001 demonstrated a significant difference between the survival curves of the Hgs tn/tn and Hrs KO/tn mice as compared to the Hg KO/+ Hgs tn/+, and Hgs +/+ mice. (D) Meiotic linkage map depicting SNP markers that define the tn critical region. (E) Genomic sequencing of HGS revealed an adenine to guanine change in the Hgs tn/tn mice, resulting in a methionine to valine substitution at amino acid 89 of HGS. (F) Schematic of HGS protein structure in eukaryotes, demonstrating the conservation of the methionine residue at position 89 in the VHS domain (orange box). Data are shown as mean ± SE. *p < 0.05 and ***p < 0.001.
Fig 2
Fig 2. HGS expression in Hgs +/+ and Hgs tn/tn tissues.
(A) qPCR analysis of Hgs mRNA expression in 4-week-old Hgs +/+ tissues. Transcript level is expressed relative to Hgs level found in the brain. (B) Representative immunoblot of HGS expression in 4-week-old Hgs +/+ (wt) and Hgs tn/tn (tn) mice. β-actin was used as a loading control. (C) qPCR analysis of Hgs levels from the brains of Hgs +/+ mice during postnatal development. (D) Representative immunoblot analysis of HGS expression from embryonic day 15 (E15) to postnatal day 35 (P35) in Hgs +/+ (wt) and Hgs tn/tn (tn) brain lysates. β-tubulin is used as a loading control. (E) Quantitation of developmental time course of HGS expression in Hgs +/+ (wt) and Hgs tn/tn (tn) mice expressed as percent of E15 Hgs +/+ levels. Symbols represent unpaired t-tests corrected for multiple comparisons using the Holm-Sidak method. A one way anova with a Geisser-Greenhouse adjustment demonstrated a significant difference between time points. (F) Quantitation of HGS expression in Hgs tn/tn mice expressed as a percent of Hgs +/+ controls at each developmental time point. Data are shown as ± SE. Symbols represent unpaired t-tests. *p<0.05 and ***p<0.001.
Fig 3
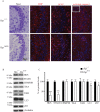
Fig 3. Comparison of hippocampal structure and protein expression between Hgs tn/tn and Hgs +/+ mice.
(A) CA3 hippocampal sections from 4-week-old Hgs +/+ and Hgs tn/tn mice were stained for Nissl, myelin basic protein (MBP), glial fibrillary protein (GFAP) and activated caspase 3. Inset is positive control (E13 embryo) for activated caspase-3. Nuclei are stained with DAPI (blue). (B) Representative immunoblot of hippocampal lysates from 4-week-old Hgs +/+ and Hgs tn/tn mice. Blots were probed for the ESCRT components HGS, STAM1, and CHMP2B, the receptor tyrosine kinases TrkA and TrkB, and the autophagic markers LC3 and p62. (C) Quantitation of immunoblots from hippocampal lysates. n = 3 mice per genotype. Data are shown as mean ± SE. *p<0.05 and ***p<0.001.
Fig 4
Fig 4. Gene dosage effects of HGS expression on motor and sensory function in 3- to 4-week-old mice.
(A) Reduced HGS expression results in clawed paws in Hgs tn/tn mice. Behavioral assays of (B) open field, (C) rotarod, (D) elevated beam, (E) von Frey and (F) forelimb grip strength for Hgs +/+ (black), Hgs tn/+, Hgs tn/tn and Hgs KO/+ mice. n = 6 mice per genotype for all assays except rotarod, where n = 4. Symbols represent unpaired t-tests corrected for multiple comparisons using the Holm-Sidak method. Data are shown as mean ± SE and n>6 animals per genotype for all assays except rotarod, where n = 4. A two-way anova demonstrated a significant effect of genotype on rotarod and elevated beam performance. Data are shown as mean ± SE. *p<0.05, **p<0.01 and ***p<0.001.
Fig 5
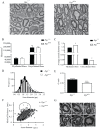
Fig 5. Examination of sciatic nerves from 4-week-old Hgs +/+ and Hgs tn/tn mice.
(A) Electron micrograph of sciatic nerves from 4-week-old Hgs tn/tn and Hgs +/+ mice. Scale bar, 2 μm. Arrowheads indicate hypermyelinated fibers, curved arrows indicated disorganized myelin and arrows indicate demyelination. (B) Quantitation of axon density in myelinated and unmyelinated nerves. (C) Quantitation of average myelinated and unmyelinated axon diameters. (D) Histogram of frequency of axon diameters demonstrating an increase in large diameter myelinated axons in the sciatic nerves of Hgs tn/tn mice relative to Hgs +/+ controls. Shaded region represents axonal size distribution from Hgs +/+ mice. An unpaired t-test with a Welch’s correction demonstrated a significant difference in the distribution of axonal size frequency between Hgs +/+ and Hgs tn/tn mice. (E) Quantitation of the ratio of axon diameter to total fiber thickness (G-ratio). Symbols represent unpaired t-tests. (F) Relationship between myelin thickness and axon diameter in Hgs +/+ and Hgs tn/tn sciatic nerves. Circled region depicts 1.0–2.0 μm diameter axons that are affected in the Hgs tn/tn sciatic nerves. (G) Representative micrographs of myelin pathology in Hgs tn/tn nerves demonstrating (1–2) Tomaculous fibers, (3–5) myelin infoldings compared to (6) Hgs +/+controls. n = 3 mice per genotype. Scale bar, 5 μm. Data are shown as mean ± SE. *p<0.05 and ***p<0.001.
Fig 6
Fig 6. Distribution of HGS in sciatic nerves of 4-week-old Hgs +/+mice.
Top panel, cross sections of sciatic nerves stained with antibodies against neurofilament (NF, green) and HGS (red). Bottom panel, sciatic nerves were stained with antibodies to the Schwann cell marker S100β (green) and HGS (red). Scale bar, 10 μm.
Fig 7
Fig 7. Analysis of ESCRT and RTK expression in the sciatic nerves of 4-week-old Hgs +/+ and Hgs tn/tn mice.
(A) Representative immunoblot of ESCRT expression in sciatic nerve extracts. β-tubulin was used as a loading control. (B) Quantitation of immunoblots of ESCRT expression in sciatic nerve extracts. (C) qPCR analysis of ESCRT-0 components in the sciatic nerve. (D) Representative immunoblot of TrkB.FL and TrkB.T1, EGFR and ERBB2 in sciatic nerves. β-tubulin was used as a loading control. (E) Quantitation of receptor tyrosine kinases in the sciatic nerve. (F) qPCR analysis of TrkB and BDNF in the sciatic nerve. Symbols represent unpaired t-tests corrected for multiple comparisons using the Holm-Sidak method. Data are shown as mean ± SE. n > 3 mice per genotype. **p<0.01 and ***p<0.001.
Fig 8
Fig 8. Levels of HGS-interacting proteins and putative substrates in spinal cord extracts of 4-week-old Hgs +/+ and Hgs tn/tn mice.
(A) Representative immunoblot and (B) quantitation of the ESCRT-0 proteins HGS and STAM1, the ESCRT-I protein TSG101, the ESCRT-0 interacting proteins EPS15, and the receptor tyrosine kinases TrkB, TrkA and EGFR in the spinal cords of Hgs +/+ and Hgs tn/tn mice. β-tubulin was used as a loading control. (C) qPCR analysis of Hgs and Stam1 in the spinal cords of Hgs +/+ and Hgs tn/tn mice. Levels are expressed relative to levels found in wild type Hgs +/+ mice. Symbols represent unpaired t-tests corrected for multiple comparisons using the Holm-Sidak method. Data are shown as mean ± SE. (D) Motor neuron counts from lumbar segments 4/5 from Hgs +/+ and Hgs tn/tn mice. n = 3 mice per genotype. (E) Immunostaining of Hgs +/+ and Hgs tn/tn L4/5 segments with GFAP. Scale bar, 100 μm. Data are shown as mean ± SE. n > 3 mice per genotype. ***p<0.001.
Fig 9
Fig 9. Alterations in muscles and motor endplates in the Hgs tn/tn mice.
(A) Wet weights of gastrocnemius muscles from 4 week-old Hgs +/+ and Hgs tn/tn mice. (B) Ratio of gastrocnemius muscle weights to body mass. n > 6 mice per genotype for each time point. (C) Gastrocnemius muscle fiber size measurements for Hgs +/+ and Hgs tn/tn mice. n > 6 mice per genotype. Symbols represent unpaired t-tests. (D) qPCR analysis of AChR-α, AChR-β, AChR-δ, AChR-ε, and AChR-γ mRNAs from the gastrocnemius muscles of 4-week-old Hgs +/+ and Hgs tn/tn mice. n > 3 mice per genotype. Symbols represent unpaired t-tests corrected for multiple comparisons using the Holm-Sidak method. (E) Motor endplate pathology in the Hgs tn/tn mice. TA muscle fibers from Hgs +/+ and Hgs tn/tn mice containing the Thy1-Yfp transgene (green) were stained with TRITC-α-bungarotoxin (red) to label the postsynaptic receptors. The presynaptic axons and nerve terminals are shown in green. Arrowheads mark ultra-terminal sprouting, and curved arrows mark swollen presynaptic terminals. Scale bar, 20 μm. (F) Quantitation of terminal swellings and terminal sprouting from Hgs +/+ and Hgs tn/tn mice. n > 6 mice per genotype. Symbols represent unpaired t-tests corrected for multiple comparisons using the Holm-Sidak method. (G) Histogram of endplate area defined by TRITC-α-bungarotoxin (red) labeling of the postsynaptic AChR in Hgs +/+ and Hgs tn/tn mice. An unpaired t-test with a Welch’s correction demonstrated a significant difference in the distribution of endplate size frequency between Hgs +/+ and Hgs tn/tn mice. n > 6 mice per genotype. Data are shown as mean ± SE. *p<0.05, **p<0.01 and ***p<0.001.
Fig 10
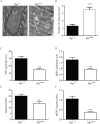
Fig 10. Loss of HGS increases the number of endosome-like structures and results in synaptic transmission deficits at the NMJ.
(A) Representative electron micrographs of NMJs in the TA muscle from 4-week-old Hgs +/+ and Hgs tn/tn mice. Arrowheads point to endosomes-like structures. Asterisk marks an MVB in the Hgs tn/tn presynaptic terminal. No MVBs were observed in Hgs +/+ terminals. Scale bar, 500 μm. (B) Quantitation of endosome-like structures at the motor axon terminals. Symbol represents unpaired t-tests. (C) A 50% reduction in EPC amplitudes was observed in the endplates from 3-week-old Hgs tn/tn mice (n = 12 endplates from 6 mice) as compared to controls (n = 12 endplates from 5 mice). (D) MEPC amplitudes were reduced in the Hgs tn/tn mice (n = 19 endplates from 6 mice) to 46% of Hgs +/+ controls (n = 15 endplates from 8 mice). (E) Quantal content was significantly lower in Hgs tn/tn mice (n = 8 endplates from 6 mice) than in Hgs +/+ controls (n = 12 endplates from 5 mice). (F) Reduced HGS expression results in a 65% reduction in MEPC frequency at the TA muscles of Hgs tn/tn mice (n = 17 endplates from 6 mice) compared to Hgs +/+controls (n = 14 endplates from 5 mice). Symbol represents unpaired t-tests **p<0.01 and ***p<0.001.
Fig 11
Fig 11. Effect of reduced HGS expression on ubiquitin conjugates in the nervous system of Hgs tn/tn mice.
(A) Representative immunoblot of ubiquitin conjugates from the nervous system of 4-week-old Hgs +/+ (wt) and Hgs tn/tn (tn) mice. (B) Quantitation of immunoblots. n = 3 per genotype. Symbols represent unpaired t-tests corrected for multiple comparisons using the Holm-Sidak method. Data are shown as mean ± SE. **p<0.001.

Similar articles

Cited by

References

    1. Morgan JR, Comstra HS, Cohen M, Faundez V (2013) Presynaptic membrane retrieval and endosome biology: defining molecularly heterogeneous synaptic vesicles. Cold Spring Harb Perspect Biol 5: a016915 10.1101/cshperspect.a016915 - DOI - PMC - PubMed
    1. Rodahl LM, Stuffers S, Lobert VH, Stenmark H (2009) The role of ESCRT proteins in attenuation of cell signalling. Biochem Soc Trans 37: 137–142. 10.1042/BST0370137 - DOI - PubMed
    1. Clague MJ, Urbe S (2001) The interface of receptor trafficking and signalling. J Cell Sci 114: 3075–3081. - PubMed
    1. Henne WM, Stenmark H, Emr SD (2013) Molecular mechanisms of the membrane sculpting ESCRT pathway. Cold Spring Harb Perspect Biol 5. - PMC - PubMed
    1. Hurley JH (2010) The ESCRT complexes. Crit Rev Biochem Mol Biol 45: 463–487. 10.3109/10409238.2010.502516 - DOI - PMC - PubMed

Publication types

MeSH terms

Substances

LinkOut - more resources