Clinical Trial
. 2015 Jun 27:13:204.
doi: 10.1186/s12967-015-0567-0.

Improved Natural Killer cell activity and retained anti-tumor CD8(+) T cell responses contribute to the induction of a pathological complete response in HER2-positive breast cancer patients undergoing neoadjuvant chemotherapy

Affiliations
Clinical Trial

Improved Natural Killer cell activity and retained anti-tumor CD8(+) T cell responses contribute to the induction of a pathological complete response in HER2-positive breast cancer patients undergoing neoadjuvant chemotherapy

E Muraro et al. J Transl Med. .

Abstract

Background: Locally advanced HER2-overexpressing breast cancer (BC) patients achieve a high rate of pathological complete responses (pCR) after neoadjuvant chemotherapy (NC). The apparently unaltered immune proficiency of these patients together with the immune-modulating activities of NC drugs suggest a potential contribution of host immunity in mediating clinical responses. We thus performed an extensive immunomonitoring in locally advanced BC patients undergoing NC to identify immunological correlates of pCR induction.

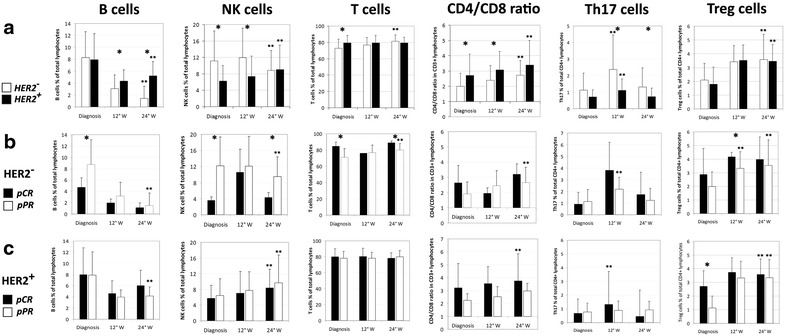
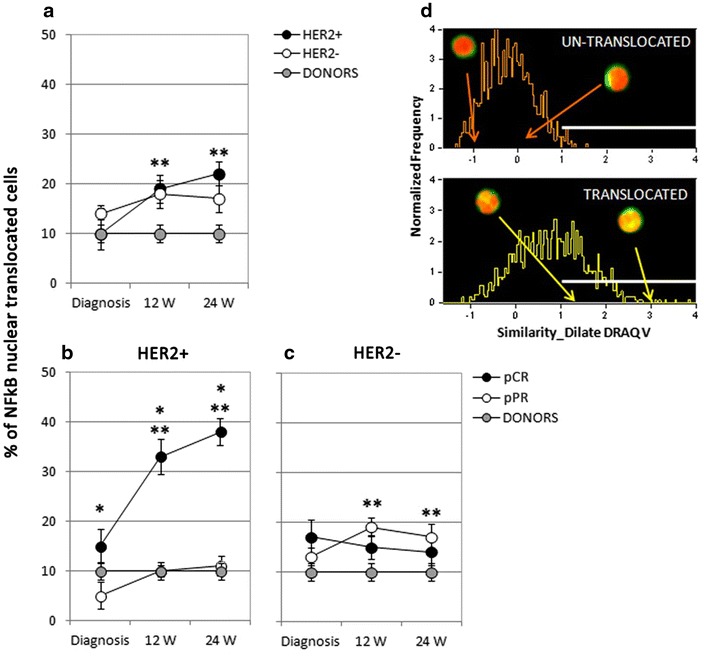
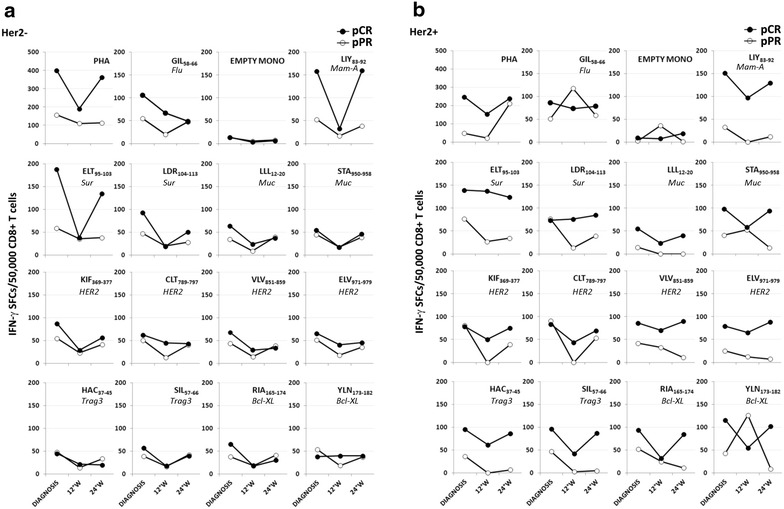
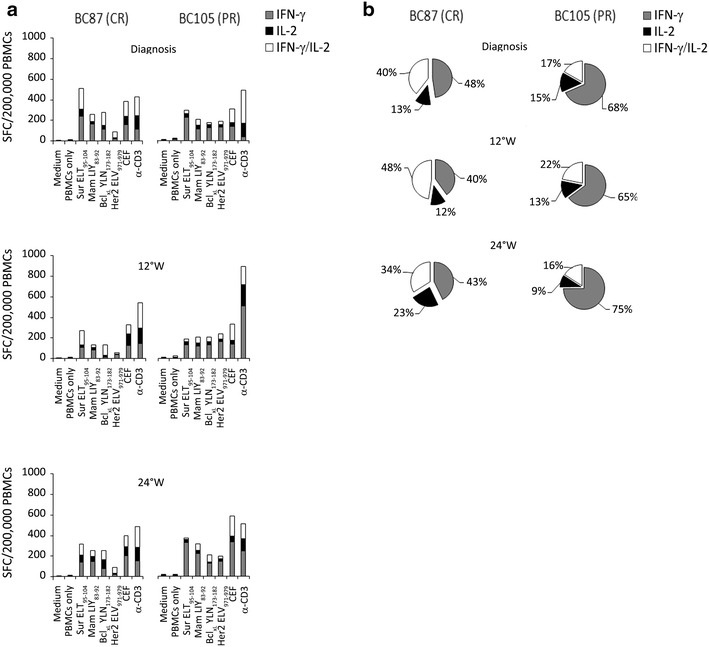
Methods: The immune profile of 40 HER2-positive and 38 HER2-negative BC patients was characterized at diagnosis and throughout NC (Paclitaxel and Trastuzumab, or Docetaxel and Epirubicin, respectively). The percentages of circulating immune cell subsets including T and B lymphocytes, Natural Killer (NK) cells, regulatory T cells, T helper 17 lymphocytes, were quantified by multiparametric flow cytometry. NK cells functional activity was evaluated through the analysis of NF-kB nuclear translocation by Multispectral flow cytometry, and with the in vitro monitoring of Trastuzumab-mediated antibody-dependent cell cytotoxicity (ADCC). CD8(+) T cell responses against six different tumor-associated antigens (TAA) were characterized by IFN-γ ELISPOT and IFN-γ/IL-2 DualSpot assays.

Results: After NC, HER2-positive patients showed a significant increase in the number of NK cells and regulatory T cells irrespective of the pathological response, whereas patients undergoing a pCR disclosed higher percentages of T helper 17 cells. Notably, a significant increase in the number of activated NK cells was observed only in HER2-positive patients achieving a pCR. Characterization of anti-tumor T cell responses highlighted sustained levels of CD8(+) T cells specific for survivin and mammaglobin-A throughout NC in patients undergoing a pCR in both arms. Moreover, HER2-positive patients achieving a pCR were characterized by a multi-epitopic and polyfunctional anti-tumor T cell response, markedly reduced in case of partial response.

Conclusions: These results indicate that maintenance of functional T cell responses against selected antigens and improvement of NK cell proficiency during NC are probably critical requirements for pCR induction, especially in HER2-positive BC patients. Trail registration:

Trial registration number: NCT02307227, registered on ClinicalTrials.gov ( http://www.clinicaltrials.gov , November 26, 2014).


Figures

Figure 1
Figure 1
Phenotyping of circulating immune cells in HER2-negative and HER2-positive BC patients during NC. a Comparison of the percentage of several immune cell subsets quantified in the peripheral blood of HER-negative (white plots; n = 33) and HER2-positive (black plots; n = 23) BC patients throughout NC. *p < 0.05 comparing HER2-positive with HER2-negative patients. b Analysis of immune cell percentages within HER2-negative patients comparing individuals achieving a pathological complete response (pCR; black plots; n = 4) with those characterized by a pathological partial response (pPR; white plots; n = 29). *p < 0.05 comparing pCR with pPR patients. c Immune cell percentages observed in HER2-positive patients undergoing a pCR (black plots; n = 11) and in HER2-positive patients showing a pPR (white plots; n = 12). *p < 0.05 comparing pCR with pPR patients. NK Natural Killer cells, Th17 T helper 17 cells, Treg regulatory T cells, W week, pCR pathological complete response, pPR pathological partial response; **p < 0.05 in respect to the corresponding diagnosis values.
Figure 2
Figure 2
NF-kB nuclear translocation in NK cells of HER2-positive and HER2-negative patients throughout NC. a Quantification of the nuclear translocation of NF-kB in NK cells of HER2-positive (HER2+; black dots; n = 12) and HER2-negative patients (HER2−; white dots; n = 10) at diagnosis and during NC, and in healthy donors (DONORS; gray dots; n = 10). b Analysis performed within HER2-positive patients comparing NF-kB nuclear translocation observed in NK cells of patients undergoing a pathological complete response (pCR, black dots; n = 5) with that measured in case of partial response (pPR, white dots; n = 7) throughout NC, and with levels found in healthy donors (gray dots; n = 10). *p < 0.05 comparing values observed in case of complete response with those measured in partial responders. c Comparison of NF-kB nuclear translocation observed in the NK cells of HER2-negative patients achieving a pathological Complete response (pCR, black dots; n = 3) with levels measured in NK cells of HER2-negative partial responders (pPR, white dots; n = 7) during NC, and with the amount noticed in NK cells from healthy donors (gray dots; n = 10). d Representative plots obtained by Multispectral Flow Cytometry showing typical histograms of NK cells without (upper plot) or with (lower plot) the nuclear translocation of NF-kB. Representative cell pictures are shown. W week, pCR pathological complete response, pPR pathological partial response; **p < 0.05 in respect to the corresponding diagnosis values.
Figure 3
Figure 3
CD8+ T cell responses to BC-associated epitopes assessed by IFN-γ-ELISPOT in BC patients throughout NC. a Quantification of CD8+ T cell responses against 13 HLA-A*0201-restricted epitopes derived from 6 different BC-associated antigens (or against the flu matrix protein1-derived epitope) at diagnosis and during NC (12° and 24° week) in HER2-negative patients achieving a complete response (pCR, black dots; n = 2) and in those characterized by a partial response (pPR, white dots; n = 5). PHA-treated T cells and empty monocytes (EMPTY MONO) were used as positive and negative controls, respectively. b Analysis of CD8+ T cell responses against TAA-derived epitopes in HER2-positive patients reaching a complete response (pCR, black dots; n = 4) and a partial response (pPR, white dots; n = 2). SFC Spot Forming Cells, pCR pathological complete response, pPR pathological partial response, PHA phytohemagglutinin, Flu influenza, Mam-A Mammaglobin-A, Sur survivin, Muc mucin-1, Trag3 taxol resistance associated gene 3, W week.
Figure 4
Figure 4
Polyfunctional CD8+ T cell responses to BC-associated antigens assessed by DualSpot in HER2-positive patients during NC. a Representative histograms of the quantification of IFN-γ (gray bars), IL-2 (black bars), and IFN-γ/IL-2 (white bars) releasing CD8+ T cells after stimulation with four epitopes derived from four different BC-associated antigens obtained at diagnosis and during NC in one HER2-positive patient achieving a pathological complete response (BC87, pCR) and in one HER2-positive patient characterized by a partial response (BC105, pPR). Medium and PBMCs alone were used as negative controls, CEF and α–CD3 as positive controls. b Slices of cakes represent the means of the percentages of CD8+ T cells releasing IFN-γ (gray), IL-2 (black), or IFN-γ/IL-2 (white) after stimulation with all the four epitopes derived from BC-associated antigens in case of complete response (left) or partial response (right). SFC spot forming cells, pCR pathological complete response, pPR pathological partial response, W week, Sur survivin, Mam mammaglobin-A, CEF mix of peptides derived from Cytomegalovirus, Epstein-Barr virus, and influenza.

References

    1. Houssami N, Macaskill P, von Minckwitz G, Marinovich ML, Mamounas E. Meta-analysis of the association of breast cancer subtype and pathologic complete response to neoadjuvant chemotherapy. Eur J Cancer. 2012;48(18):3342–3354. doi: 10.1016/j.ejca.2012.05.023. - DOI - PubMed
    1. Bardia A, Baselga J. Neoadjuvant therapy as a platform for drug development and approval in breast cancer. Clin Cancer Res. 2013;19(23):6360–6370. doi: 10.1158/1078-0432.CCR-13-0916. - DOI - PubMed
    1. Denkert C, Loibl S, Noske A, Roller M, Muller BM, Komor M, et al. Tumor-associated lymphocytes as an independent predictor of response to neoadjuvant chemotherapy in breast cancer. J Clin Oncol. 2010;28(1):105–113. doi: 10.1200/JCO.2009.23.7370. - DOI - PubMed
    1. Issa-Nummer Y, Loibl S, von Minckwitz G, Denkert C. Tumor-infiltrating lymphocytes in breast cancer: a new predictor for responses to therapy. Oncoimmunology. 2014;3:e27926. doi: 10.4161/onci.27926. - DOI - PMC - PubMed
    1. Bianchini G, Gianni L. The immune system and response to HER2-targeted treatment in breast cancer. Lancet Oncol. 2014;15(2):e58–e68. doi: 10.1016/S1470-2045(13)70477-7. - DOI - PubMed

Publication types

MeSH terms

Associated data