. 2015 Aug 1;195(3):994-1005.
doi: 10.4049/jimmunol.1500083. Epub 2015 Jun 26.

Codelivery of Envelope Protein in Alum with MVA Vaccine Induces CXCR3-Biased CXCR5+ and CXCR5- CD4 T Cell Responses in Rhesus Macaques

Affiliations

Codelivery of Envelope Protein in Alum with MVA Vaccine Induces CXCR3-Biased CXCR5+ and CXCR5- CD4 T Cell Responses in Rhesus Macaques

Smita S Iyer et al. J Immunol. .

Abstract

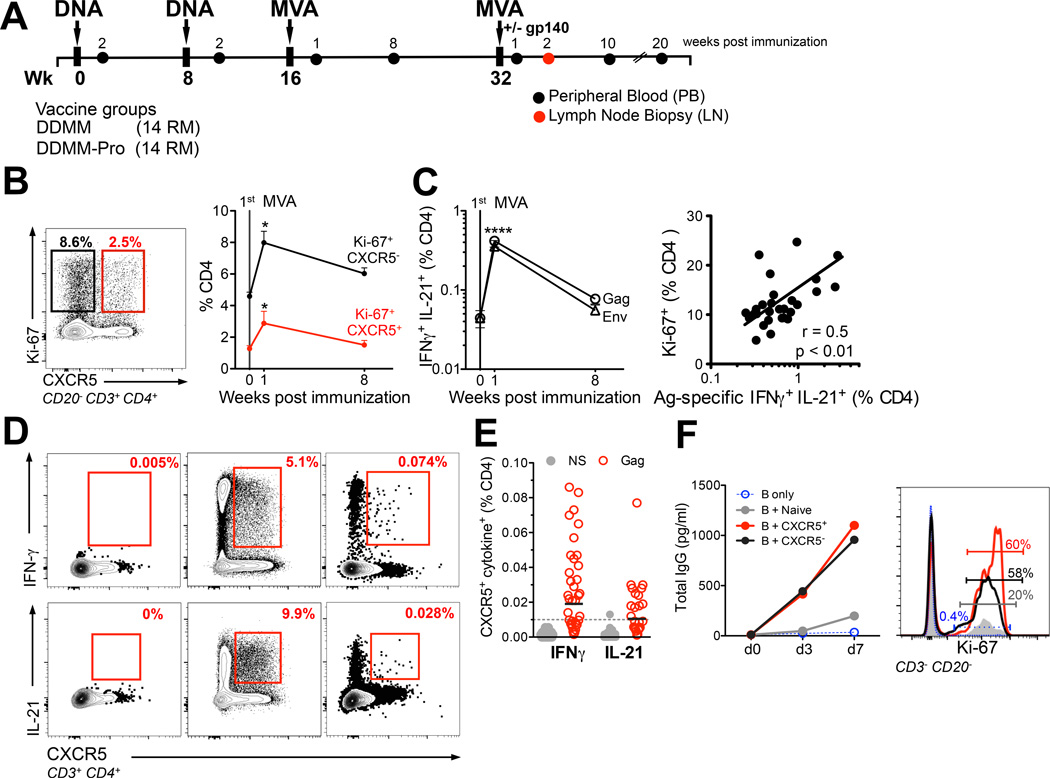
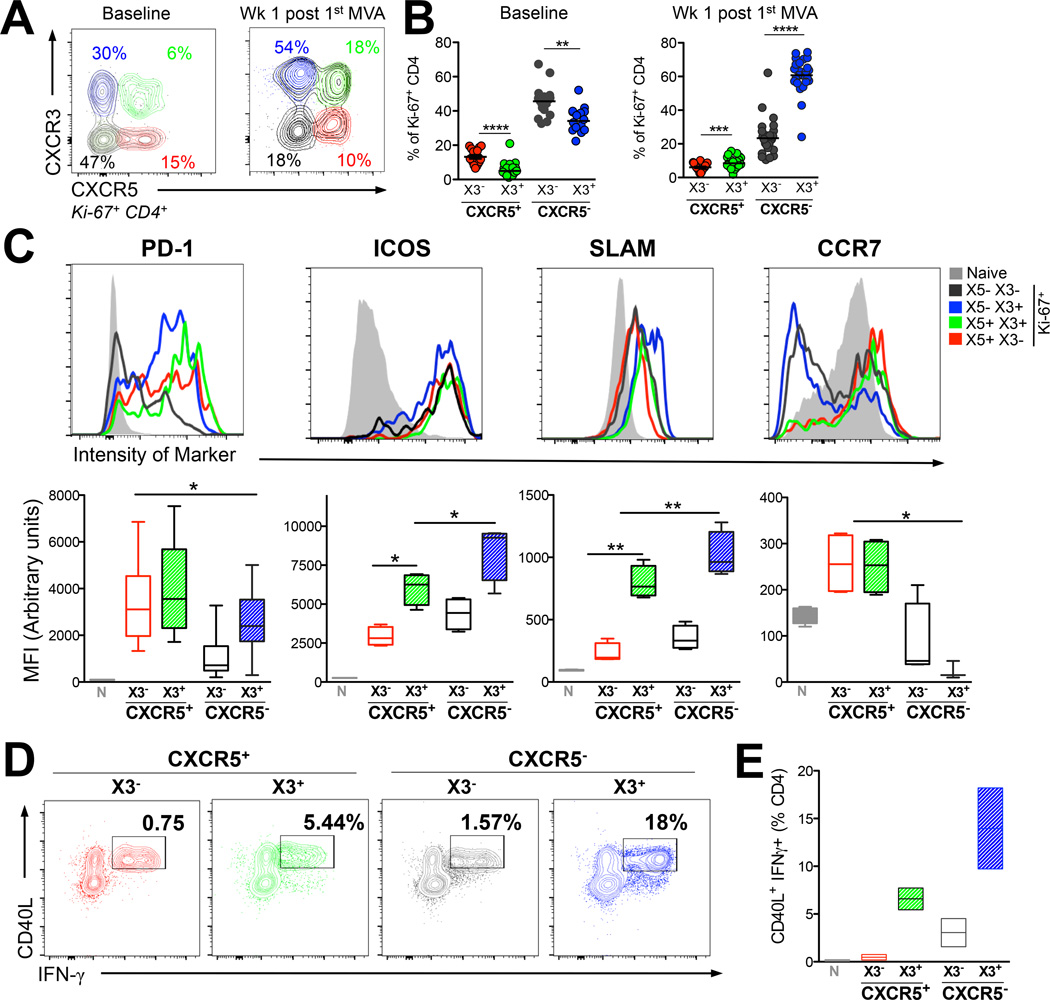
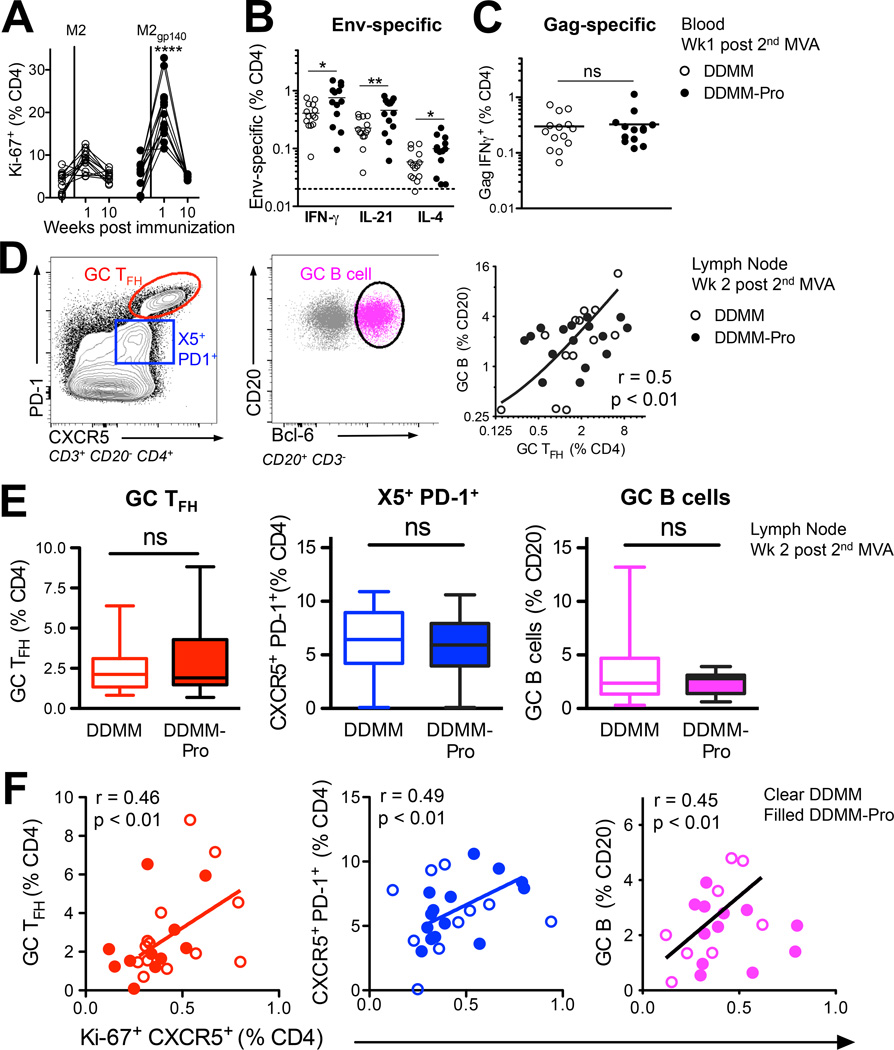
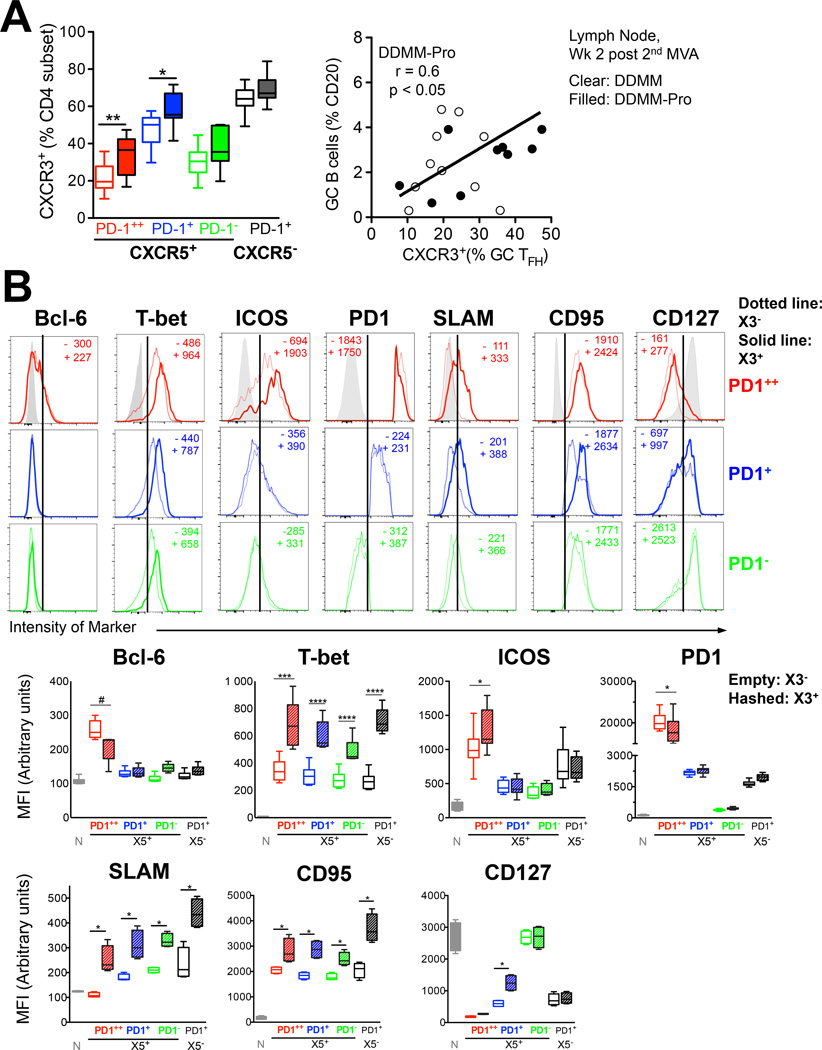
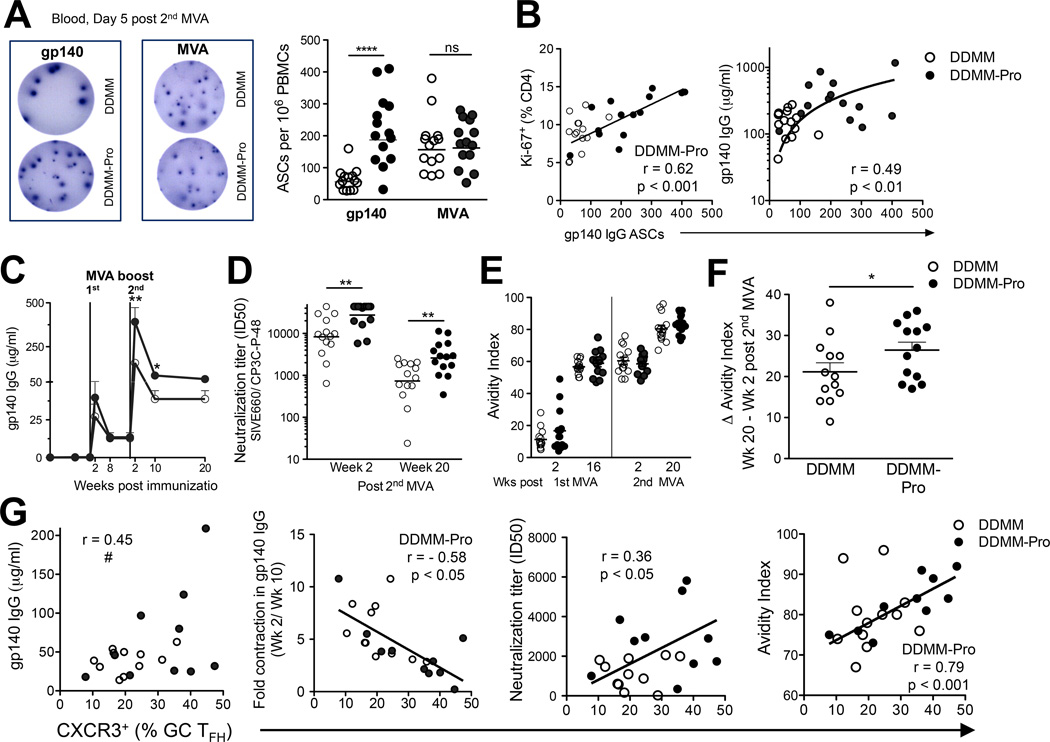
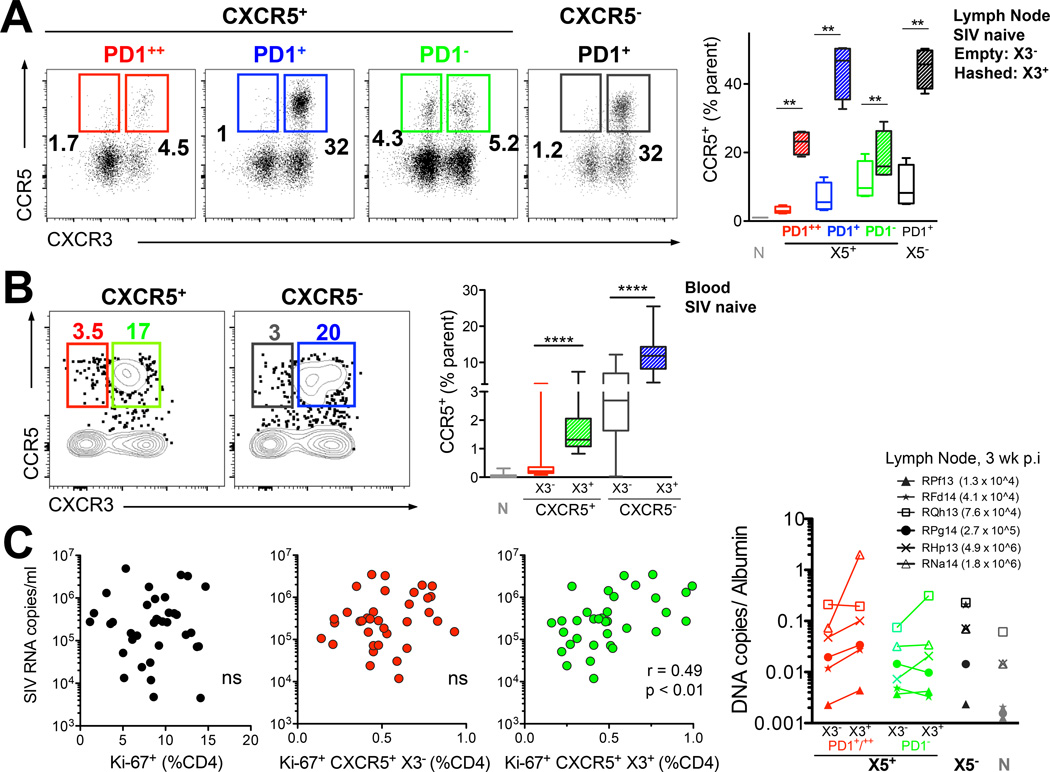
The goal of an HIV vaccine is to generate robust and durable protective Ab. Vital to this goal is the induction of CD4(+) T follicular helper (TFH) cells. However, very little is known about the TFH response to HIV vaccination and its relative contribution to magnitude and quality of vaccine-elicited Ab titers. In this study, we investigated these questions in the context of a DNA/modified vaccinia virus Ankara SIV vaccine with and without gp140 boost in aluminum hydroxide in rhesus macaques. In addition, we determined the frequency of vaccine-induced CD4(+) T cells coexpressing chemokine receptor, CXCR5 (facilitates migration to B cell follicles) in blood and whether these responses were representative of lymph node TFH responses. We show that booster modified vaccinia virus Ankara immunization induced a distinct and transient accumulation of proliferating CXCR5(+) and CXCR5(-) CD4 T cells in blood at day 7 postimmunization, and the frequency of the former but not the latter correlated with TFH and B cell responses in germinal centers of the lymph node. Interestingly, gp140 boost induced a skewing toward CXCR3 expression on germinal center TFH cells, which was strongly associated with longevity, avidity, and neutralization potential of vaccine-elicited Ab response. However, CXCR3(+) cells preferentially expressed the HIV coreceptor CCR5, and vaccine-induced CXCR3(+)CXCR5(+) cells showed a moderate positive association with peak viremia following SIV251 infection. Taken together, our findings demonstrate that vaccine regimens that elicit CXCR3-biased TFH cell responses favor Ab persistence and avidity but may predispose to higher acute viremia in the event of breakthrough infections.


Figures

Figure 1
Figure 1. DNA/MVA vaccine induces transient accumulation of PD-1 and ICOS expressing CXCR5+ and CXCR5 CD4+ T cells with B cell helper potential in peripheral blood
(A) Rhesus macaques were immunized with plasmid DNA expressing Gag, gp160 Env, Prt, RT, Tat, and Rev (3 mg at 0, 8 weeks) followed by boost with recombinant MVA expressing Gag, gp150 Env, and Prt (1×10^8 pfu at 16, 32 wks; DDMM). 14 macaques received 100µg of gp140 protein (adsorbed in 500µg Aluminum hydroxide) at week 32 concurrent with 2nd MVA immunization (DDMM-Pro). All immunizations were administered intramuscularly in the thigh. Peripheral blood (PB) and lymph node (LN) biopsies were obtained at stated time-points. (B) Examination of peripheral blood for the nuclear antigen Ki-67 together with CXCR5 showed that MVA immunization induced a proliferative burst in CXCR5+ (red line) and CXCR5 (black line) CD4+ T cells at day 7 (two-tailed paired t test showed significantly higher frequencies at week 1 compared to baseline and week 8 * p < 0.05). Data are mean ± SEM. (C) Kinetics of SIV-specific CD4 T cell response for Gag and Env in 28 RM. Data are mean ± SEM, response for Gag and Env at week 1 was significantly higher compared to baseline and week 8 using a paired two-tailed t test, **** p <0.0001). Magnitude of total Ki-67+ CD4+ T cells correlated with the magnitude of Gag + Env IFNγ+ IL-21+ CD4+ T cell response (Spearman R2 = 0.25 with a two-tailed p value of < 0.01 indicated by **). (D) Shows cytokine profile of CXCR5+ cells in blood under the following conditions: NS, PMA/Ionomycin, and Gag at 1 week post 1st MVA. Frequencies of Gag-specific CXCR5+ cells were above background for IFNγ and IL-21. (E) Scatter plot shows range of CXCR5+ IFNγ+ and CXCR5+ IL-21+ responses in NS (grey) and Gag stimulated PBMCs (red); each dot represents one animal (F) To determine B cell helper potential of blood CXCR5+ cells, these cells were co-cultured with autologous memory B cells obtained at week 1 post-1st MVA. Blood CXCR5 and CXCR5+ CD4 T cells efficiently induced IgG secretion and B cell proliferation. Data are representative of 1 of 4 independent replicates.
Figure 2
Figure 2. DNA/MVA vaccine induced CXCR5+ CD4+ T cells in peripheral blood demonstrate a TH1 propensity
(A) Ki-67+ CD4+ T cells were distinguished into four subsets based on expression of CXCR5 (X5) and CXCR3 (X3). (B) Proportion of Ki-67+ CD4+ subsets for expression X5 and X3 at stated time points (****, p < 0.00001; ***, p < 0.001;**, p< 0.01 computed using a paired two-tailed t test). (C) Histograms show relative expression of phenotypic markers in naive (grey) X5+ X3 (red); X5+ X3+ (green), X5 X3 (tungsten), X5 X3+ (blue) subsets in blood at week 1 post 1st MVA. Box plots show median fluorescence intensity (MFI) of respective markers in Ki-67+ CD4 T cells for several markers; PD-1 (X5+ subsets showed significantly higher expression compared to X3 SP cells *, p < 0.05), X3+ cells expressed significantly higher levels of ICOS, SLAM and did not express CCR7. Data shown are from 4 animals and are representative of 3 independent replicates. (D, E) expression of CD40L and IFNγ on FACS sorted cell subsets memory cells after stimulation with PMA/Ionomycin.
Figure 3
Figure 3. Blood CXCR5+ CD4+ T cells predict germinal center TFH cell and B cell responses
(A) Higher frequency of Ki-67+ CD4+ T cells after 2nd MVA in DDMM-Pro group (****, p < 0.0001 at week 1 with a two-tailed, non-parametric t test). (B) To determine if gp140 boost resulted in higher Env-specific CD4+ T cells, responses were compared using a one-tailed t test, which showed increased Env IFN-γ+, IL-21+, and IL-4+ frequencies in DDMMgp140 group at week 1 post 2nd MVA immunization and no change in (C) Gag responses. (D) Inguinal lymph nodes were biopsied from the lymph node non-draining to immunization site at 2 weeks post-2nd MVA immunization (E) Flow plot shows presence of distinct subsets of CXCR5+ CD4+ T cells in lymph node ; PD-1++GC TFH (red) , PD-1+, (blue) , and PD-1 cells. Middle panel shows GC B cells identified by Bcl-6 and scatter lot shows correlation between GC B cells and GC TFH cells. (D) Inclusion of gp140 boost did not alter frequencies of GC TFH cells, CXCR5+PD-1+, and GC B cells. (F) To determine if responses in blood (at week 1 post 2nd MVA) were positively correlated with magnitude of GC responses, these indices were correlated using a one-tailed Spearman correlation (*, p < 0.05). Blood Ki-67+ CXCR5+ cells correlated with GC TFH cells (R2 = 0.21), CXCR5+ PD-1+ TFH cells (R2 = 0.24), and GC B cells (R2 = 0.20) in lymph node.
Figure 4
Figure 4. Alum-adjuvanted gp140 protein boost enhances the frequency of CXCR3+ CD4+ TFH cells in lymph node
Inclusion of protein boost in alum skewed the phenotype of responding CD4+ T cells towards CXCR3 in (A) lymph node GC TFH and CXCR5+ PD1+ cells examined at 2 weeks post-2nd MVA boost. Clear bars DDMM group, filled bars DDMM-Pro group. Comparisons were made using a two-tailed non-parametric t test, **, p < 0.001; *, p < 0.01. Scatter plot shows association of % CXCR3+ GC TFH cells with magnitude of GC B cell response (B) Histograms show expression of markers on GC TFH cells (red), CXCR5+ PD1+ cells (blue), and CXCR5+ PD1 cells (green) in lymph node. Solid lines denote expression in CXCR3+ subsets, dotted line CXCR3 subset and whisker plots show Median Fluorescence intensity for X3 (empty plots) and X3+ (hashed plots) TFH subsets for the transcription factors Bcl-6, T-bet; activation markers ICOS, PD-1, SLAM, CD95 and memory marker CD127 (#, p = 0.08; ****, p< 0.0001; ***, p < 0.001, * p < 0.05 computed using a paired two-tailed t test)
Figure 5
Figure 5. CXCR3+ GC TFH cells correlate with longevity and avidity of gp140 antibody titers
ELISPOT assays were used to quantify gp140 and MVA ASCs. ELISPOT image for (A) gp140 and MVA at day 5 post 2nd MVA boost in DDMM (top) and DDMM-Pro (bottom) groups. Spots shown are for an input of 100,000 PBMCs per well. Graph in (A) shows concurrent immunization of gp140 with 2nd MVA increases gp140 IgG ASC responses (***, p < 0.001 with a non-parametric two-tailed t test). MVA IgG ASCs comparable in DDMM (clear circles) and DDMM-Pro groups (filled circles). (B) Correlation between gp140 ASCs and magnitude of Ki-67+ CD4 T cells (Spearman R2 = 0.38). Magnitude of gp140 ASC response correlates with scale of gp140 antibody titers at week 2 post 2nd MVA (Spearman R2 = 0.24). (C) kinetics of gp140 antibody responses after 1st MVA boost showed significant increase with gp140 boost at week 2 and week 10 post 2nd MVA (**, p< 0.001; *, p< 0.01 using a non-parametric two-tailed t test) (D) neutralization titers against tier 1 SIV E660 also increased with gp140 boost (E) kinetics of antibody avidity (F) Computation of increase in avidity (Wk 20- Wk 2) after 2nd MVA immunization revealed greater increase with gp140 boost (*, p < 0.05 with a non-parametric one-tailed t test). (G) shows a trend for association between CXCR3+ GC TFH and gp140 titers at memory measured at week 20 (#, p = 0.05); shows inverse correlation between contraction of gp140 titers and % of CXCR3+ GC TFH cells in DDMMgp140 group (Spearman R2 = 0.33; *, p < 0.05). CXCR3 expression on GC TFH cells directly correlated with neutralization titers (Spearman R2 = 0.12; *, p < 0.05) and avidity index (Spearman R2 = 0.62; **, p < 0.01).
Figure 6
Figure 6. Vaccine elicited induction of CXCR3+ CXCR5+ CD4+ T cells associates with peak viral load after infection with SIV251
Expression of CCR5 on CXCR5+ and CXCR5 CD4 T cells in SIV naive (A) lymph node and (B) blood. (C) vaccine-induced CXCR3+ CXCR5+ CD4 T cells at week 1 post 2nd MVA associate with peak viremia at 3 weeks post SIV infection (Spearman R2 = 0.2; *, p < 0.01 with a non-parametric two-tailed t test ). (D) CXCR3+ CXCR5+ PD-1+/++ TFH cells in lymph node at 3 weeks post SIV infection harbor higher levels of pro-viral DNA compared to X3 subsets. Values in parentheses are serum viral RNA copies at 3 weeks post-infection for each animal.

Similar articles

Cited by

References

    1. Slifka MK, Matloubian M, Ahmed R. Bone marrow is a major site of long-term antibody production after acute viral infection. Journal of virology. 1995;69:1895–1902. - PMC - PubMed
    1. Chan TD, Gatto D, Wood K, Camidge T, Basten A, Brink R. Antigen affinity controls rapid T-dependent antibody production by driving the expansion rather than the differentiation or extrafollicular migration of early plasmablasts. J Immunol. 2009;183:3139–3149. - PubMed
    1. Crotty S. Follicular helper CD4 T cells (TFH) Annual review of immunology. 2011;29:621–663. - PubMed
    1. Cyster JG. Shining a light on germinal center B cells. Cell. 2010;143:503–505. - PubMed
    1. Pallikkuth S, Parmigiani A, Silva SY, George VK, Fischl M, Pahwa R, Pahwa S. Impaired peripheral blood T-follicular helper cell function in HIV-infected nonresponders to the 2009 H1N1/09 vaccine. Blood. 2012;120:985–993. - PMC - PubMed

Publication types

MeSH terms