. 2015 Aug 18;43(14):6701-13.
doi: 10.1093/nar/gkv605. Epub 2015 Jun 27.

BreakSeek: a breakpoint-based algorithm for full spectral range INDEL detection

Affiliations

BreakSeek: a breakpoint-based algorithm for full spectral range INDEL detection

Hui Zhao et al. Nucleic Acids Res. .

Abstract

Although recent developed algorithms have integrated multiple signals to improve sensitivity for insertion and deletion (INDEL) detection, they are far from being perfect and still have great limitations in detecting a full size range of INDELs. Here we present BreakSeek, a novel breakpoint-based algorithm, which can unbiasedly and efficiently detect both homozygous and heterozygous INDELs, ranging from several base pairs to over thousands of base pairs, with accurate breakpoint and heterozygosity rate estimations. Comprehensive evaluations on both simulated and real datasets revealed that BreakSeek outperformed other existing methods on both sensitivity and specificity in detecting both small and large INDELs, and uncovered a significant amount of novel INDELs that were missed before. In addition, by incorporating sophisticated statistic models, we for the first time investigated and demonstrated the importance of handling false and conflicting signals for multi-signal integrated methods.


Figures

Figure 1.
Figure 1.
Outline of the multi-signal integrated BreakSeek framework. (A) A three-step workflow in BreakSeek. (B) Illustrations of the three core algorithms implemented in BreakSeek. (B1) BP clustering. Breakreads are clustered using single-linkage hierarchical clustering with self-defined distance (see Materials and Methods). The median position of the breakreads within the same cluster is assigned as the BP position. (B2) Four examples from chr20 of the NZYGMN dataset illustrate the INDEL classification procedure. A typical deletion with significant deletion-supporting breakreads at both BPs, which are paired by PE read pairs (colored in cyan). An insertion with evenly number of left and right BP-supporting breakreads companied by read pairs with reduced PEM distance (colored in green). A deletion with only the right BP recognized using breakreads recovered its missing BP using the EM-estimated deletion size through SW alignment. A small deletion identified using breakreads. (B3) Smith–Waterman alignment of deletions. For deletions with both BP identified, two breakreads most evenly split by the BPs are selected to perform the SW alignment. For deletions with only one BP identified, position of the missing BP is calculated using the reported BP and the EM-estimated deletion size, the clipped segment of the selected breakread is aligned to the extrapolated missing BP region (see Materials and Methods).
Figure 2.
Figure 2.
Performance comparisons between BreakSeek and seven other widely used INDEL detection tools on simulated datasets with varying sequencing depth. INDELs were divided into six groups according to their sizes, and the sensitivity of methods for each group was calculated and presented separately. BP accuracy was calculated based on the deviation of estimated BP position from its actual position.
Figure 3.
Figure 3.
Performance comparisons of INDEL detection on the NA12878 dataset. Venn diagrams of small insertion, small deletion and non-small deletion calls were presented in subfigures (A), (B) and (C), respectively. All three diagrams were partitioned and marked with unique colors to highlight INDELs detected exclusively by BreakSeek (orange), SOAPindel (purple), Pindel (green), LUMPY (pink) and PRISM (brown), and calls recovered by all methods (red), INDELs detected by at least two methods other than BreakSeek (lightgreen) as well as calls detected by both BreakSeek and at least one but not all of the other methods (yellow). The line and bar charts below the Venn diagram show the validation rate using PacBio long reads. Both the validation rate and the number of validated (dark gray) and unvalidated INDEL calls (light gray) were summarized and presented by methods and by Venn partitions.
Figure 4.
Figure 4.
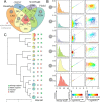
Summary of performance on detection of large deletions on the NZYGMN dataset. (A) Large deletion calls reported by the four methods were presented in a Venn diagram and were colored into seven partitions. (B) For each Venn partition, column I records distribution of total number of breakreads from both BPs of the deletion calls. Column II presents the scatterplot of reported deletion size (x) versus EM-estimated size (y) with colored density, and column III shows the scatterplot of total PE read pairs spanning only single BP (x) versus the number of read pairs spanning both BPs (y). (C) Hierarchical clustering of deletion calls by all four methods according to their similarity in the composition of calls from each Venn partition. Deletion predictions were classified into 16 groups according to their strength of PEM and BP signals.
Figure 5.
Figure 5.
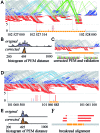
Examples of two large deletion calls on NZYGMN with original and corrected distribution of local PEM distance. (A) Visualization of PEM of a false positive call by Pindel using inGAP. (B) Comparison of the original and corrected local PEM distribution near the Pindel call. Abnormally mapped read pairs were corrected based on their optimal EM-estimated PEM distance. (C) Visualization of corrected PEM of the Pindel call. The chromatogram of amplified sequence confirms that there is no deletion in this tandem repeat region. (D) Visualization of PEM of a BreakSeek exclusive call. (E) Comparison of the original and corrected local PEM distribution near the BreakSeek call. (F) SW alignment of deletion-supporting breakreads. PEMs were visualized using inGAP, read pairs with normal PEM distances were linked by gray lines, read pairs with abnormally long PEM distances (> mean + 3*sd) were marked by blue lines and read pairs with abnormally short PEM distances (< mean - 3*sd) were linked by green lines.

References

    1. Stankiewicz P., Lupski J.R. Structural variation in the human genome and its role in disease. Ann. Rev. Med. 2010;61:437–455. - PubMed
    1. Feuk L., Carson A.R., Scherer S.W. Structural variation in the human genome. Nat. Rev. Genet. 2006;7:85–97. - PubMed
    1. Alkan C., Coe B.P., Eichler E.E. Genome structural variation discovery and genotyping. Nat. Rev. Genet. 2011;12:363–376. - PMC - PubMed
    1. Mills R.E., Pittard W.S., Mullaney J.M., Farooq U., Creasy T.H., Mahurkar A.A., Kemeza D.M., Strassler D.S., Ponting C.P., Webber C. Natural genetic variation caused by small insertions and deletions in the human genome. Genome Res. 2011;21:830–839. - PMC - PubMed
    1. Mullaney J.M., Mills R.E., Pittard W.S., Devine S.E. Small insertions and deletions (INDELs) in human genomes. Hum. Mol. Genet. 2010;19:R131–R136. - PMC - PubMed

Publication types