. 2015 Aug 18;43(14):6787-98.
doi: 10.1093/nar/gkv608. Epub 2015 Jun 27.

Complementing tissue characterization by integrating transcriptome profiling from the Human Protein Atlas and from the FANTOM5 consortium

Affiliations

Complementing tissue characterization by integrating transcriptome profiling from the Human Protein Atlas and from the FANTOM5 consortium

Nancy Yiu-Lin Yu et al. Nucleic Acids Res. .

Abstract

Understanding the normal state of human tissue transcriptome profiles is essential for recognizing tissue disease states and identifying disease markers. Recently, the Human Protein Atlas and the FANTOM5 consortium have each published extensive transcriptome data for human samples using Illumina-sequenced RNA-Seq and Heliscope-sequenced CAGE. Here, we report on the first large-scale complex tissue transcriptome comparison between full-length versus 5'-capped mRNA sequencing data. Overall gene expression correlation was high between the 22 corresponding tissues analyzed (R > 0.8). For genes ubiquitously expressed across all tissues, the two data sets showed high genome-wide correlation (91% agreement), with differences observed for a small number of individual genes indicating the need to update their gene models. Among the identified single-tissue enriched genes, up to 75% showed consensus of 7-fold enrichment in the same tissue in both methods, while another 17% exhibited multiple tissue enrichment and/or high expression variety in the other data set, likely dependent on the cell type proportions included in each tissue sample. Our results show that RNA-Seq and CAGE tissue transcriptome data sets are highly complementary for improving gene model annotations and highlight biological complexities within tissue transcriptomes. Furthermore, integration with image-based protein expression data is highly advantageous for understanding expression specificities for many genes.


Figures

Figure 1.
Figure 1.
Schematic diagram of CAGE and RNA-Seq read coverage for a gene with two isoforms. RNA-Seq reads are 100 bp short reads that cover the entire transcript with decreasing coverage at the 5′ and 3′ ends of the transcripts, while CAGE reads (∼27 bp) provide sharp coverage for transcript start sites (TSS) of the first exons for all transcripts that are expressed.
Figure 2.
Figure 2.
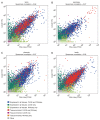
Gene expression correlations between corresponding tissues in the FANTOM5 CAGE and HPA RNA-Seq data sets. Scatterplots of gene expressions measured in TPMs for CAGE data set and FPKM values for RNA-Seq data set are shown for (A) brain, (B) pancreas, (C) placenta and (D) testis. The axes are shown in log10 scales. Only protein-coding genes mapped in both data sets are used in this analysis.
Figure 3.
Figure 3.
Comparison of overall correlation values between 22 tissue samples chosen from the FANTOM5 and HPA data sets. (A) The dotplot shows the ranges of correlation values between each of the 27 tissue samples in FANTOM5 data set against all of the 75 HPA tissue samples (brain, colon, heart, lung, and testis each has two samples coming from the same tissue). (B) Hierarchical clustering shows tissue relationships within the 27 FANTOM5 samples. The heatmap shows subtle differences in the correlation relationship of HPA tissue samples to FANTOM5 tissues samples. All correlation scores were calculated as pair-wise Spearman correlation coefficients between the tissue samples.
Figure 4.
Figure 4.
Distribution of ubiquitously expressed and single tissue-enriched genes among FANTOM5 CAGE and HPA RNA-Seq data sets. (A) Distribution of ubiquitously expressed genes in either FANTOM5 or HPA data set. A gene is considered as ubiquitously expressed for both data sets if it is expressed in all samples in one data set and in 95% of the tissues in the other data set. (B) Top histogram shows distribution of FANTOM5 ubiquitously expressed genes in HPA RNA-Seq tissue samples. Bottom histogram shows distribution of HPA ubiquitous gene expression in FANTOM5 CAGE tissue samples. The histograms confirm that most of the genes are expressed in 95% of the tissues in the other data set. (C) Distribution of single tissue-enriched genes among 22 tissues identified in either FANTOM5 or HPA data set for 3-, 5-, 7-, 10-fold, 5-fold–3-fold, 7-fold–5-fold, 7-fold–3-fold, and 10-fold–5-fold enrichment. (D) Tissue distribution of the single tissue-enriched genes identified in FANTOM5 and HPA tissue samples, shown for 7-fold–3-fold enrichment.
Figure 5.
Figure 5.
Examples of how HPA immunohistochemistry (IHC) staining can complement gene expression data by providing additional spatial distribution information at the single-cell level. (A) MUC5B, a CAGE-only gall bladder-enriched gene in the IHC images showed very distinct cell type-specific expression in gall bladder, which could explain the difference in expression value between CAGE and RNA-Seq. It show high expression in specific cell types in the colon, salivary gland, and even in the appendix, where both CAGE and RNA-Seq expressions were low. (B) SLC2A2, an RNA-Seq only liver-enriched gene in the IHC images display highly specific expression in kidney, liver and small intestine, which is in agreement with CAGE data. Colon IHC image shows no expression, suggesting that one of the FANTOM5 colon samples may be contaminated. (C) Variable composition of certain cell types: ACTA1 shows tissue-restricted expression in adipose, esophagus, heart, salivary gland, and thyroid in CAGE. RNA-Seq data does not show high expression in adipose tissue, salivary gland or thyroid. Examination of IHC images shows very specific staining patterns for muscle cells in each tissue sample, which explains the variable expressions of this gene between the two data sets. Tissue abbreviations are as following: Ad = adipose, Ap = appendix, Bl = bladder, Br = brain, Co = colon, Es = esophagus, Ga = gallbladder, He = heart, Ki = kidney, Li = liver, Lu = lung, Ly = lymph node, Ov = ovary, Pa = pancreas, Pl = placenta, Pr = prostate, Sa = salivary gland, Sm = small intestine, Sp = spleen, Te = testis, Th = thyroid, Ut = uterus.

References

    1. Schena M., Shalon D., Davis R.W., Brown P.O. Quantitative monitoring of gene expression patterns with a complementary DNA microarray. Science. 1995;270:467–470. - PubMed
    1. Mortazavi A., Williams B.A., McCue K., Schaeffer L., Wold B. Mapping and quantifying mammalian transcriptomes by RNA-Seq. Nat. Methods. 2008;5:621–628. - PubMed
    1. Kodzius R., Kojima M., Nishiyori H., Nakamura M., Fukuda S., Tagami M., Sasaki D., Imamura K., Kai C., Harbers M., et al. CAGE: cap analysis of gene expression. Nat. Methods. 2006;3:211–222. - PubMed
    1. Shiraki T., Kondo S., Katayama S., Waki K., Kasukawa T., Kawaji H., Kodzius R., Watahiki A., Nakamura M., Arakawa T., et al. Cap analysis gene expression for high-throughput analysis of transcriptional starting point and identification of promoter usage. Proc. Natl. Acad. Sci. U.S.A. 2003;100:15776–15781. - PMC - PubMed
    1. Andersson R., Gebhard C., Miguel-Escalada I., Hoof I., Bornholdt J., Boyd M., Chen Y., Zhao X., Schmidl C., Suzuki T., et al. An atlas of active enhancers across human cell types and tissues. Nature. 2014;507:455–461. - PMC - PubMed

Publication types