

An online open-source tool for automated quantification of liver and myocardial iron concentrations by T2* magnetic resonance imaging
- PMID: 26118302
- PMCID: PMC4743578
- DOI: 10.1259/bjr.20150269
An online open-source tool for automated quantification of liver and myocardial iron concentrations by T2* magnetic resonance imaging
Abstract
Objective: To assess whether an online open-source tool would provide accurate calculations of T2(*) values for iron concentrations in the liver and heart compared with a standard reference software.
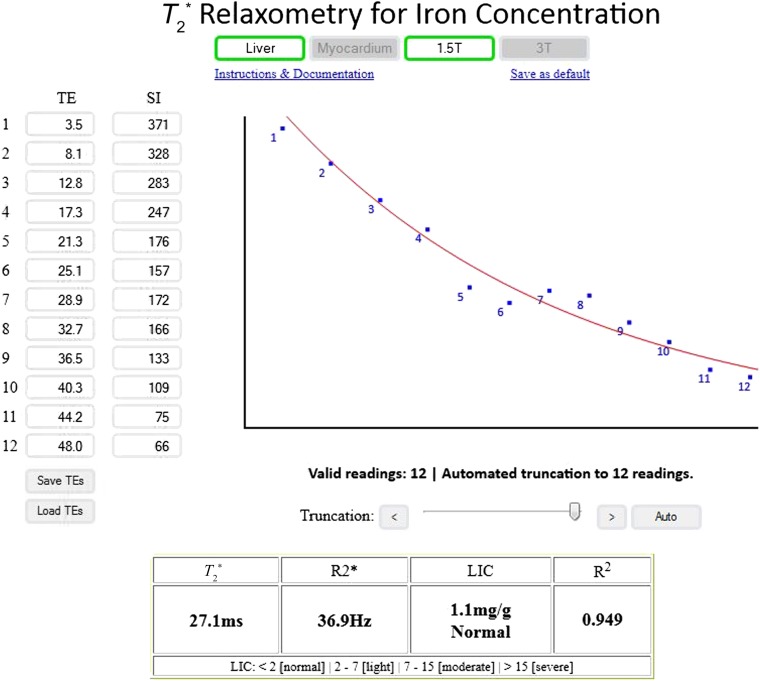
Methods: An online open-source tool, written in pure HTML5/Javascript, was tested in 50 patients (age 26.0 ± 18.9 years, 46% males) who underwent T2(*) MRI of the liver and heart for iron overload assessment as part of their routine workup. Automated truncation correction was the default with optional manual adjustment provided if needed. The results were compared against a standard reference measurement using commercial software with manual truncation (CVI(42)(®) v. 5.1; Circle Cardiovascular Imaging; Calgary, AB).
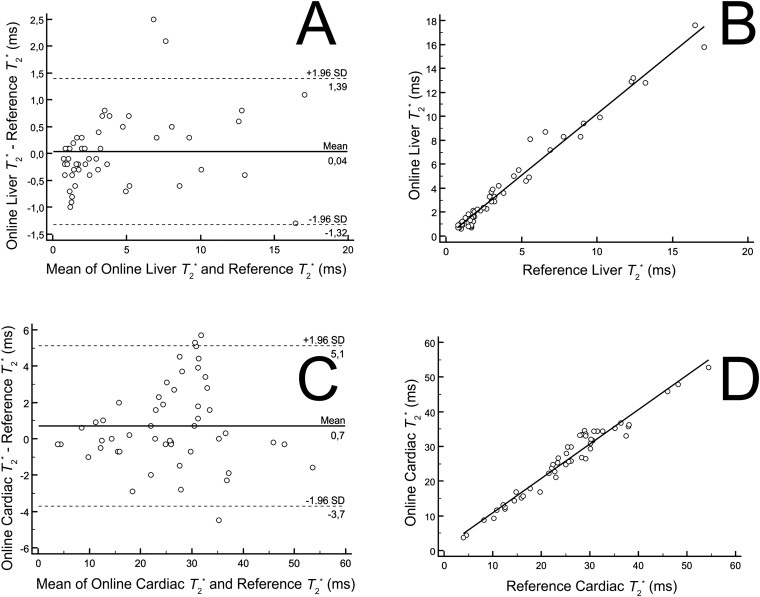
Results: The mean liver T2(*) values calculated with the automated tool was 4.3 ms [95% confidence interval (CI) 3.1 to 5.5 ms] vs 4.26 ms using the reference software (95% CI 3.1 to 5.4 ms) without any significant differences (p = 0.71). In the liver, the mean difference was 0.036 ms (95% CI -0.1609 to 0.2329 ms) with a regression correlation coefficient of 0.97. For the heart, the automated T2(*) value was 26.0 ms (95% CI 22.9 to 29.0 ms) vs 25.3 ms (95% CI 22.3 to 28.3 ms), p = 0.28. The mean difference was 0.72 ms (95% CI 0.08191 to 1.3621 ms) with a correlation coefficient of 0.96.
Conclusion: The automated online tool provides similar T2(*) values for the liver and myocardial iron concentrations as compared with a standard reference software.
Advances in knowledge: The online program provides an open-source tool for the calculation of T2(*) values, incorporating an automated correction algorithm in a simple and easy-to-use interface.
Figures
References
Publication types
MeSH terms
Substances
LinkOut - more resources
Full Text Sources
Other Literature Sources
Medical
