. 2015 Jun 29:5:11454.
doi: 10.1038/srep11454.

Cortical actin networks induce spatio-temporal confinement of phospholipids in the plasma membrane--a minimally invasive investigation by STED-FCS

Affiliations

Cortical actin networks induce spatio-temporal confinement of phospholipids in the plasma membrane--a minimally invasive investigation by STED-FCS

Débora M Andrade et al. Sci Rep. .

Abstract

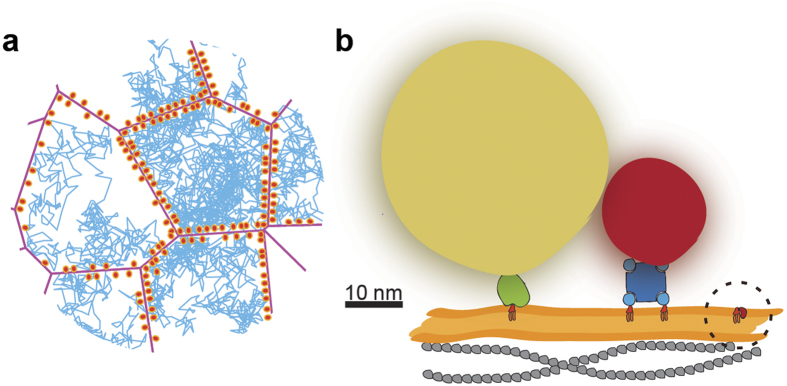
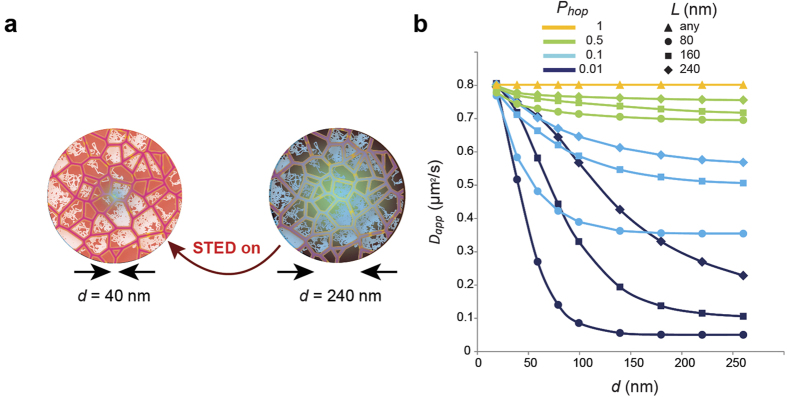
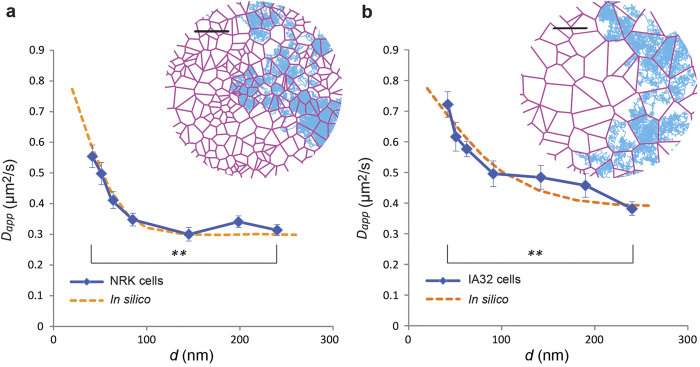
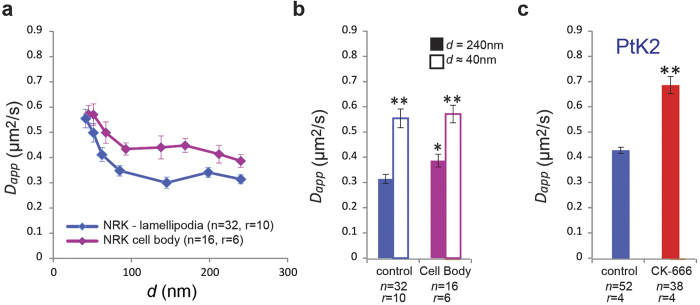
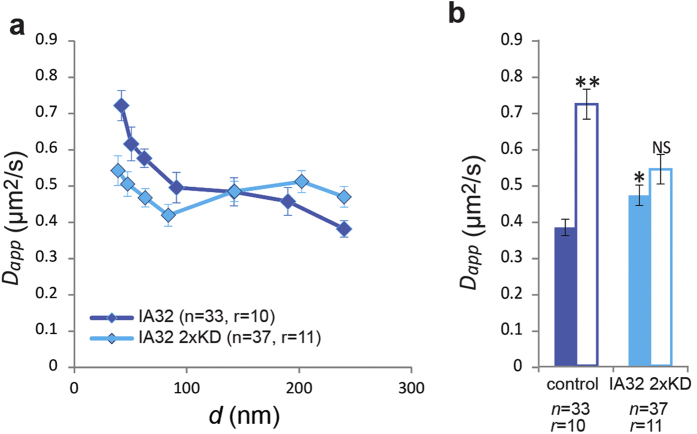
Important discoveries in the last decades have changed our view of the plasma membrane organisation. Specifically, the cortical cytoskeleton has emerged as a key modulator of the lateral diffusion of membrane proteins. Cytoskeleton-dependent compartmentalised lipid diffusion has been proposed, but this concept remains controversial because this phenomenon has thus far only been observed with artefact-prone probes in combination with a single technique: single particle tracking. In this paper, we report the first direct observation of compartmentalised phospholipid diffusion in the plasma membrane of living cells using a minimally invasive, fluorescent dye labelled lipid analogue. These observations were made using optical STED nanoscopy in combination with fluorescence correlation spectroscopy (STED-FCS), a technique which allows the study of membrane dynamics on a sub-millisecond time-scale and with a spatial resolution of down to 40 nm. Specifically, we find that compartmentalised phospholipid diffusion depends on the cortical actin cytoskeleton, and that this constrained diffusion is directly dependent on the F-actin branching nucleator Arp2/3. These findings provide solid evidence that the Arp2/3-dependent cortical actin cytoskeleton plays a pivotal role in the dynamic organisation of the plasma membrane, potentially regulating fundamental cellular processes.


Figures

Figure 1
Figure 1. Detecting compartmentalised diffusion with a small lipid probe.
(a) Schematic showing branched actin networks (magenta) and associated membrane achors (orange), which partially confine two-dimensional diffusion of molecules. As exemplarily shown by single-molecule diffusion tracks (blue), molecules are assumed to diffuse freely within compartments, and in the event of hitting the compartment boundaries, transposition to the adjacent compartment occurs with a certain hopping probability Phop. (b) Schematic of lipid probes used in SPT and in STED-FCS, put in perspective (from left to right): gold particle (yellow, ~40 nm in diameter) linked to a lipid (orange: chains, light red: head group) by Fab antibody fragment (green), and QD (red, ~20 nm in diameter) linked to two lipids via streptavidin (blue), as often used in SPT; and a fluorescent lipid analogue (dark red: organic dye, ~1 nm in diameter), as used in STED-FCS. Possible oligomerisation induced by SPT probes is illustrated for the QD. The membrane bilayer is shown in orange and the actin cytoskeleton in grey.
Figure 2
Figure 2. STED-FCS simulation of compartmentalised diffusion.
(a) In STED-FCS, the apparent diffusion coefficient Dapp is determined for different sizes of the observation spot (given by the diameter d), as formed by varying the STED laser power (red: STED light, green: effective observation or fluorescence area). (b) In silico STED-FCS experiments: Simulations show characteristic dependencies of Dapp on the diameter d of the observation area, assuming a model for compartmentalised diffusion as depicted in Fig. 1a with Dfree = 0.8µm2/s. As d is increased, Dapp decreases. Characteristic compartment size of length L, free diffusion coefficient Dfree, and hopping probability Phop define the diffusion model. These simulations (using Dfree = 0.8µm2/s and Phop and L as given) show that only strong confinement (small Phop) renders clear patterns of compartmentalised diffusion whereas weaker confinement (for example, Phop = 0.5) closely resembles free diffusion.
Figure 3
Figure 3. Experimental observation of lipid compartmentalised diffusion by STED-FCS.
Dapp(d) dependencies (blue) for DPPE-Atto647N diffusion in NRK (a) and IA32 cells (b). Clear compartmentalised diffusion patterns are observed. **P < 0.01 (unpaired t test). Error bars are s.e.m. In a, n = 32 cells; in b, n = 33 cells. In a and b, r = 10 (n stands for the number of cells, from r samples). Fitting of the experimental data using Monte-Carlo simulations (orange dotted lines) resulted for NRK cells, Dfree = 0.8 ( ±0.03) μm2/s, Phop = 0.1 ( ±0.01) and L = 80 ( ±8) nm, and for IA32 cells, Dfree = 0.8 ( ±0.02) μm2/s, Phop = 0.1 ( ±0.01) and L = 150 ( ±12) nm. Insets: Representative Voronoi lattices (red) relative to the correspondent compartment sizes as well as simulated diffusion trajectories (blue) correspondent to the fitted parameters. Scale bars: 250 nm.
Figure 4
Figure 4. Investigation of molecular mechanisms underlying compartmentalised lipid diffusion via STED-FCS: Pharmacological treatments.
Dapp(d) dependencies: (a,b) Cytoskeleton depletion in NRK (a) and IA32 (b) cells, respectively: treatment with Latrunculin B and CK-666 as labelled, (c,d) Cholesterol depletion and myosin II inhibition in NRK (c) and IA32 (d) cells, respectively: treatment with Cholesterol Oxidase and Blebbistatin as labelled. (e,f) Summary of NRK and IA32 data, respectively, showing values of Dapp for confocal (d = 240 nm, filled columns) and STED recordings (d ~ 40 nm, open columns) – the increase in Dapp from 240 to 40 nm indicates the extent of compartmentalised diffusion. Error bars are s.e.m. Symbols on top of the columns represent results of the statistical test (**P < 0.01, *P < 0.05, NS not significant; two-tailed unpaired t test): for d ~ 40 nm comparison with the value representing d = 240 nm in the same experiment, and for d = 240 nm comparison with the respective value for d = 240 nm in the control (untreated) experiment. n stands for the number of cells, from r samples.
Figure 5
Figure 5. STED-FCS of lipid diffusion in different parts of the cell and in PtK2 cells.
(a) Dapp(d) dependencies in NRK cells: diffusion near the cell edge (lamellipodia) and under the cell body (as labelled). (b) Values of Dapp for confocal (d = 240 nm, filled columns) and STED recordings (d ~ 40 nm, open columns) for diffusion probed near the cell edge (control, blue) and under the cell body (purple) – the increase in Dapp from 240 to 40 nm indicates the extent of compartmentalised diffusion. Compartmentalised diffusion is more pronounced near the cell edge. (c) Results from measurements on PtK2 cells: Experimental diffusion coefficient of the fluorescent DPPE analogue in the plasma membrane of untreated and CK-666-treated PtK2 cells (d = 240 nm). We have previously shown that diffusion of this DPPE analogue in PtK2 cells is apparently free, therefore the measurements corresponding to d = 240 nm are expected to effectively represent the range (d = 40 nm to d = 240 nm). Error bars are s.e.m. Symbols on top of the columns represent results of the statistical test (**P < 0.01, *P < 0.05, NS not significant; two-tailed unpaired t test): for d ~ 40 nm comparison with the value representing d = 240 nm in the same experiment, and for d = 240 nm comparison with the respective value for d = 240 nm in the control experiment. Here, n stands for the number of cells, from r samples.
Figure 6
Figure 6. Comparing compartmentalisation in Arp2/3 knock-down cells.
(a) Dapp(d) dependencies in IA32 MEFs and IA32 2xKD MEFs (Arp 2/3 knock-down), respectively. (b) Values of Dapp for confocal (d = 240 nm, filled columns) and STED recordings (d ~ 40 nm, open columns) in IA32 MEFs (control, dark blue) and IA32 2xKD MEFs (IA32 2xKD, light blue) – the increase in Dapp from 240 to 40 nm indicates the extent of compartmentalised diffusion. Error bars are s.e.m. Symbols on top of the columns represent results of the statistical test (**P < 0.01, *P < 0.05, NS not significant; two-tailed unpaired t test): for d ~ 40 nm comparison with the value representing d = 240 nm in the same experiment, and for d = 240 nm comparison with the respective value for d = 240 nm in the control experiment. n stands for the number of cells, from r samples.

References

    1. Singer S. & Nicolson G. L. The fluid mosaic model of the structure of cell membranes. Science 175, 720–731 (1972). - PubMed
    1. Fujiwara T., Ritchie K., Murakoshi H., Jacobson K. & Kusumi A. Phospholipids undergo hop diffusion in compartmentalized cell membrane. J Cell Biol 157, 1071–1081 (2002). - PMC - PubMed
    1. Kusumi A. et al. Paradigm shift of the plasma membrane concept from the two-dimensional continuum fluid to the partitioned fluid: High-speed single-molecule tracking of membrane molecules. Annu Rev Biophys 34, 351–378 (2005). - PubMed
    1. Wawrezinieck L., Rigneault H., Marguet D. & Lenne P. F. Fluorescence correlation spectroscopy diffusion laws to probe the submicron cell membrane organization. Biophys J 89, 4029–4042 (2005). - PMC - PubMed
    1. Eggeling C. et al. Direct observation of the nanoscale dynamics of membrane lipids in a living cell. Nature 457, 1159–1162 (2009). - PubMed

Publication types