. 2015 Jun 29:5:11589.
doi: 10.1038/srep11589.

Metabolome progression during early gut microbial colonization of gnotobiotic mice

Affiliations

Metabolome progression during early gut microbial colonization of gnotobiotic mice

Angela Marcobal et al. Sci Rep. .

Abstract

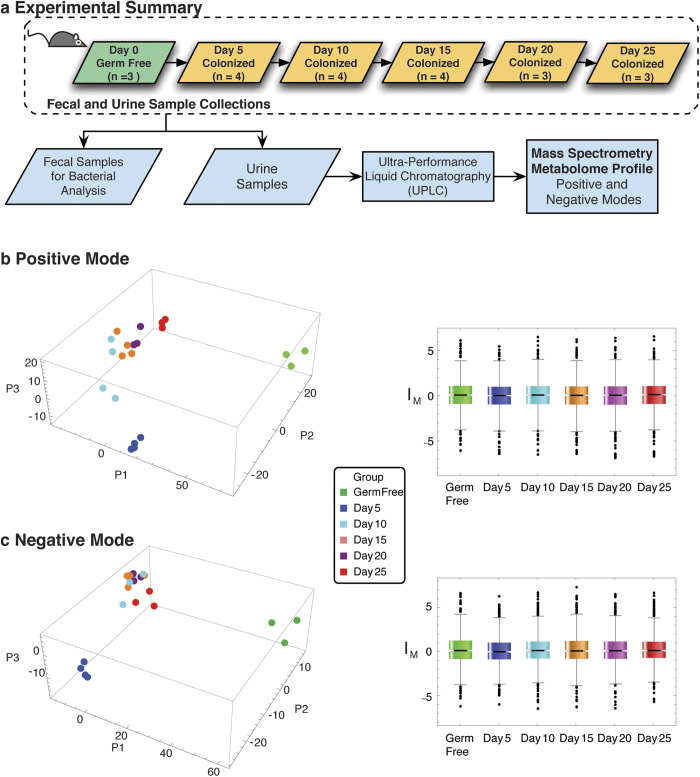
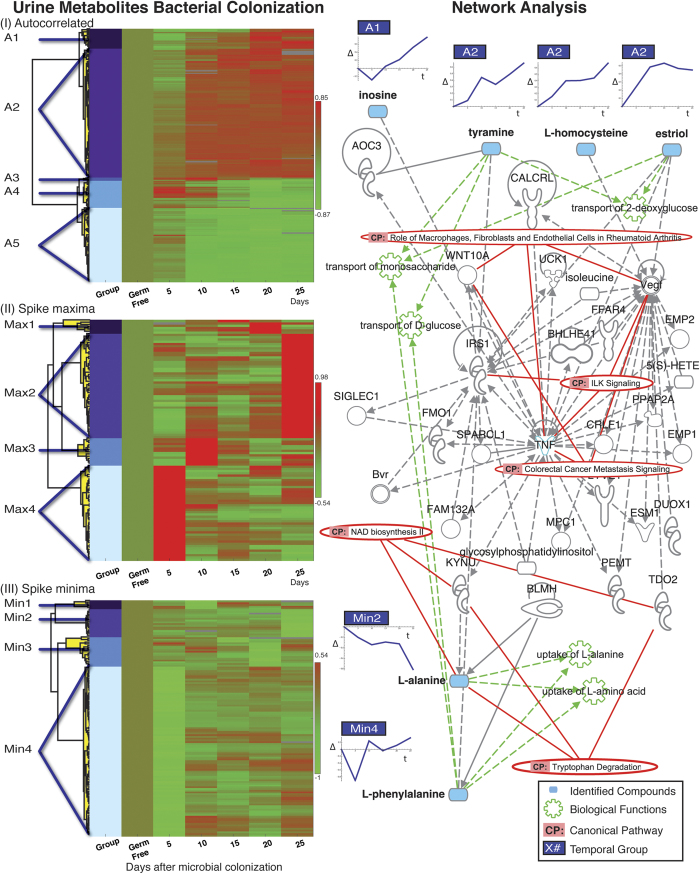
The microbiome has been implicated directly in host health, especially host metabolic processes and development of immune responses. These are particularly important in infants where the gut first begins being colonized, and such processes may be modeled in mice. In this investigation we follow longitudinally the urine metabolome of ex-germ-free mice, which are colonized with two bacterial species, Bacteroides thetaiotaomicron and Bifidobacterium longum. High-throughput mass spectrometry profiling of urine samples revealed dynamic changes in the metabolome makeup, associated with the gut bacterial colonization, enabled by our adaptation of non-linear time-series analysis to urine metabolomics data. Results demonstrate both gradual and punctuated changes in metabolite production and that early colonization events profoundly impact the nature of small molecules circulating in the host. The identified small molecules are implicated in amino acid and carbohydrate metabolic processes, and offer insights into the dynamic changes occurring during the colonization process, using high-throughput longitudinal methodology.


Figures

Figure 1
Figure 1. Inoculation of Germ Free Mice.
(a) Germ free mice were inoculated on Day 0 with Bacteriodes. thetaiotaomicron and Bifidobacterium longum by oral gavage ingestion. Urine and fecal samples were processed for metabolome and colony profiling respectively from these mice on days 5, 10, 15, 20, 25. Principal Component Analysis in both Positive (b) and Negative (c) acquisition mode full metabolome results reveal that the mice samples aggregate into groups, with the Germ Free and Day 5 groups well separated. The components account for 81% and 80% of the variances in Positive and Negative modes respectively. The corresponding normalized distributions are shown on the right panels displaying similar profiles, where intensities IM have been standardized (with median and median absolute deviation), indicating symmetry in approach in positive and negative modes. See also Supplementary Fig. S1, Supplementary Table S1.
Figure 2
Figure 2. Simulation of Random Time Series.
(a) Simulations of the autocorrelation classification methodology were performed to assess robustness and reconstruction of temporal trends in known linear signals. The example illustrates a random realization that corresponds to a simulation of: 12,000 linear signals, of equal numbers of positive (+) or negative slope/trend (−), combined with a randomly generated equivalent set of 6000 random signals, and in randomized order. The numbers in each set were equally distributed between having zero or one time point missing (excluding the first one which is used as a reference). Additionally a simulation of 100,000 random signals was used as a background of bootstrap simulation. In particular, for simulations of linear signals with 5% random error per timepoint, Filter S corresponds to a strict p < 0.05 cutoff for autocorrelation at lag 1 (random series bootstrap, n = 100,000). In Filter R the p-value is relaxed until the entire set of linear trends is recovered. As seen, this results in modest false discovery rates. The simulation was repeated for linear signals with 20% error per timepoint for both filters. The corresponding heatmaps and clustering are shown in (b). (c) The reconstruction of autocorrelations from the periodogram, and the exact autocorrelations are shown for a straight signal, for a series of n = 6 and n = 100 time points. For n = 100 the reconstruction is indistinguishable from the exact calculation in the figure.
Figure 3
Figure 3. Temporal Trends and Associated Networks.
On the left the hierarchical clustering per classification (Autocorrelated, Spike Maxima and Spike Minima) is shown. For each trend molecules with unique KEGG ID or identified through MS standards were used in QIAGEN’s IPA Ingenuity pathway construction (IPA®, QIAGEN Redwood City, www.qiagen.com/ingenuity). The network displayed on the right (network score 16, “Cell-mediated Immune Response, Inflammatory Response, Gastrointestinal Disease”) includes 5 molecules, each shown aligned horizontally with its corresponding temporal trend and identified with its group on the left. Significant functions and canonical pathway results that include more than two of the metabolites or network components respectively are also included. See also Supplementary Table S4 for detailed network composition and functional analysis and Supplementary Fig. S3.

References

    1. Whitman W. B., Coleman D. C. & Wiebe W. J. Prokaryotes: the unseen majority. Proc. Natl. Acad. Sci. USA 95, 6578–6583 (1998). - PMC - PubMed
    1. Human Microbiome Jumpstart Reference Strains, C. et al. A catalog of reference genomes from the human microbiome. Science 328, 994–999, 10.1126/science.1183605 (2010). - DOI - PMC - PubMed
    1. Gevers D. et al. The Human Microbiome Project: a community resource for the healthy human microbiome. PLoS Biol. 10, e1001377, 10.1371/journal.pbio.1001377 (2012). - DOI - PMC - PubMed
    1. Grice E. A. & Segre J. A. The human microbiome: our second genome. Annu. Rev. Genomics Hum. Genet. 13, 151–170, 10.1146/annurev-genom-090711-163814 (2012). - DOI - PMC - PubMed
    1. Human Microbiome Project, C. A framework for human microbiome research. Nature 486, 215–221, 10.1038/nature11209 (2012). - DOI - PMC - PubMed

Publication types

LinkOut - more resources