. 2015 Jul 2;17(1):74-88.
doi: 10.1016/j.stem.2015.05.014. Epub 2015 Jun 25.

Transcriptional Mechanisms of Proneural Factors and REST in Regulating Neuronal Reprogramming of Astrocytes

Affiliations

Transcriptional Mechanisms of Proneural Factors and REST in Regulating Neuronal Reprogramming of Astrocytes

Giacomo Masserdotti et al. Cell Stem Cell. .

Abstract

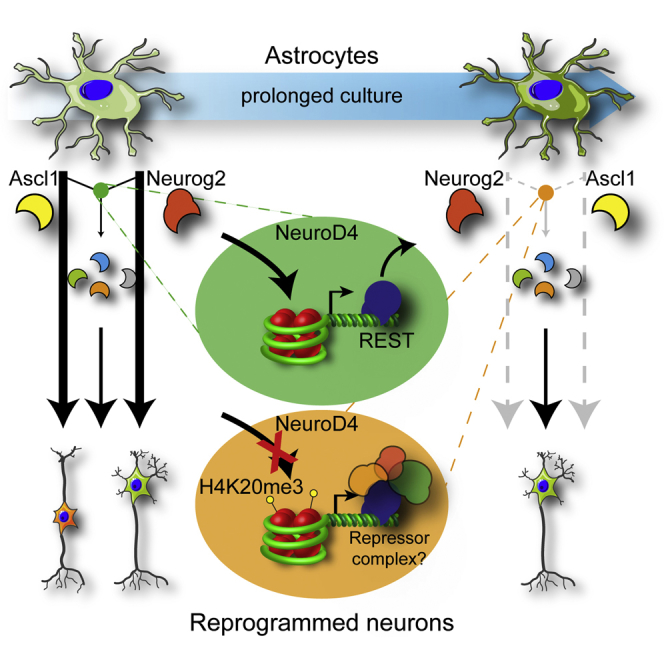
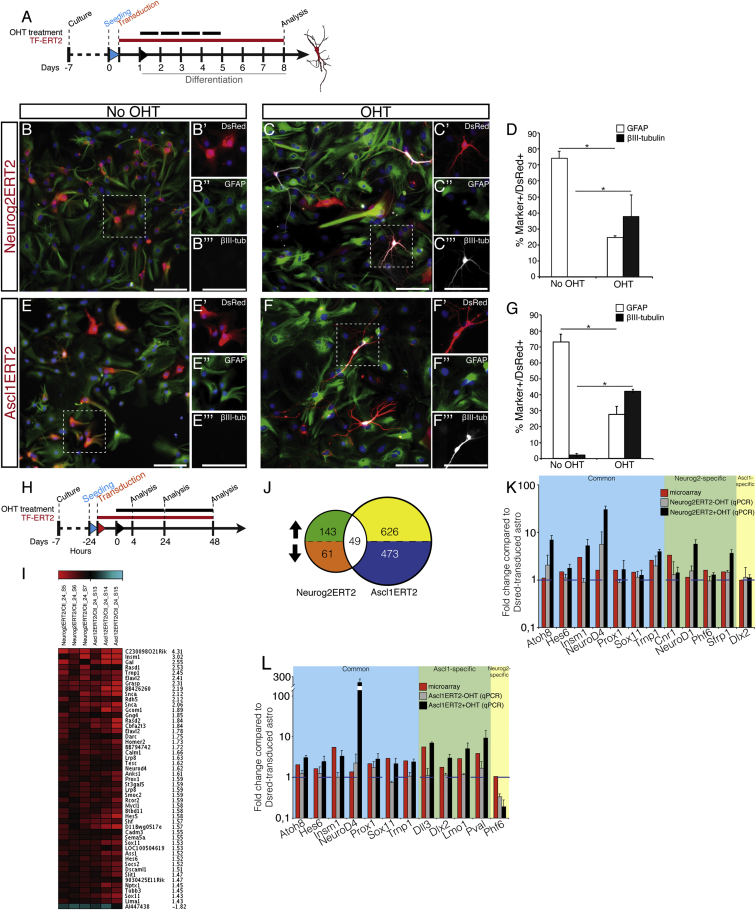
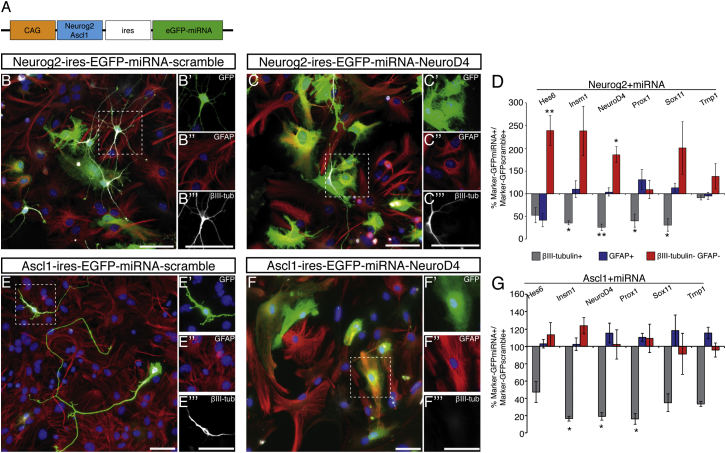
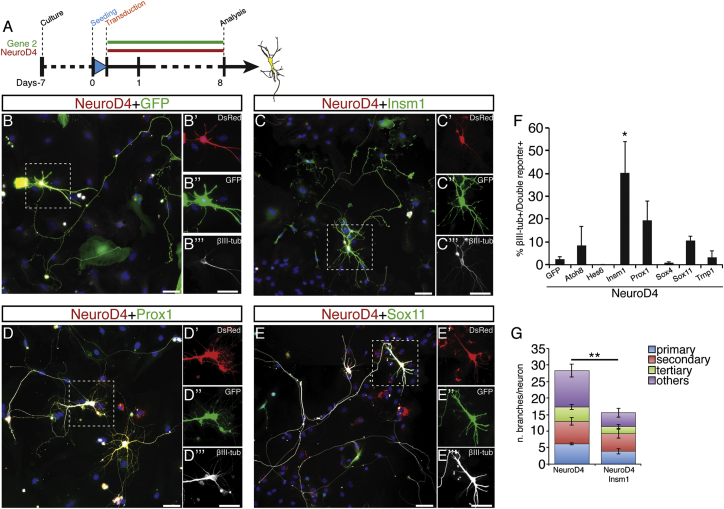
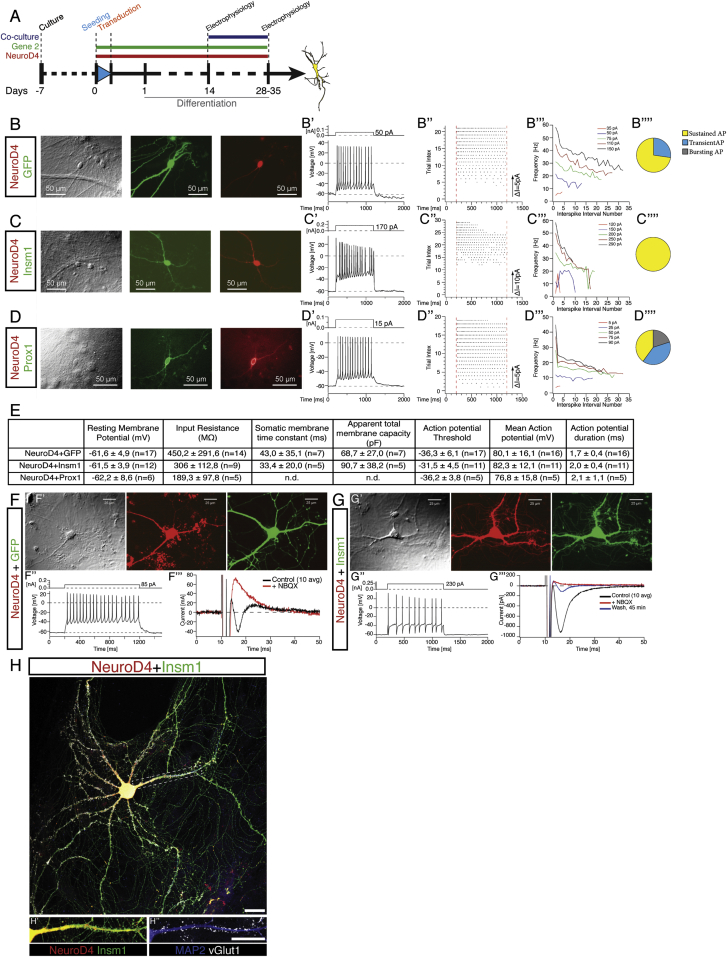
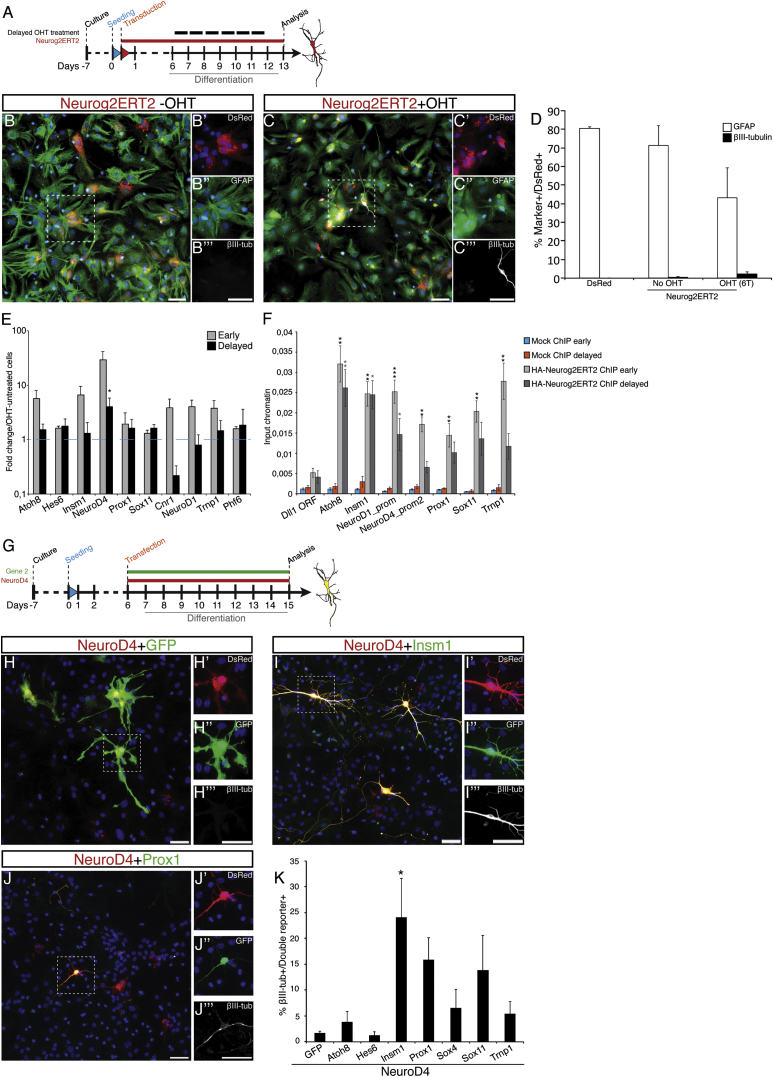
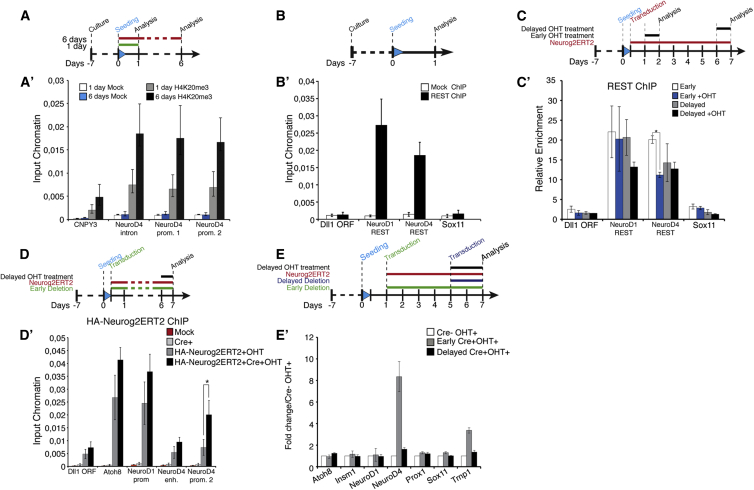
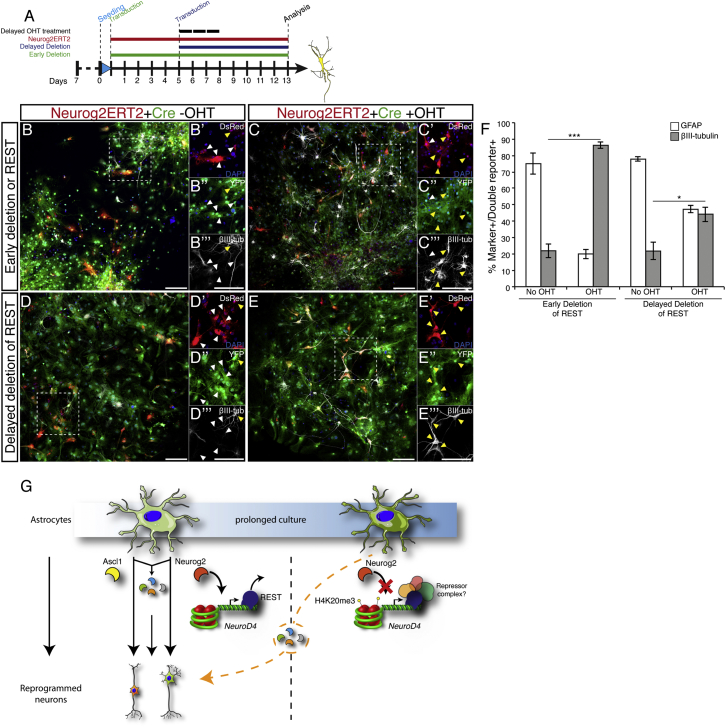
Direct lineage reprogramming induces dramatic shifts in cellular identity, employing poorly understood mechanisms. Recently, we demonstrated that expression of Neurog2 or Ascl1 in postnatal mouse astrocytes generates glutamatergic or GABAergic neurons. Here, we take advantage of this model to study dynamics of neuronal cell fate acquisition at the transcriptional level. We found that Neurog2 and Ascl1 rapidly elicited distinct neurogenic programs with only a small subset of shared target genes. Within this subset, only NeuroD4 could by itself induce neuronal reprogramming in both mouse and human astrocytes, while co-expression with Insm1 was required for glutamatergic maturation. Cultured astrocytes gradually became refractory to reprogramming, in part by the repressor REST preventing Neurog2 from binding to the NeuroD4 promoter. Notably, in astrocytes refractory to Neurog2 activation, the underlying neurogenic program remained amenable to reprogramming by exogenous NeuroD4. Our findings support a model of temporal hierarchy for cell fate change during neuronal reprogramming.


Figures

None
Graphical abstract
Figure 1
Figure 1
Temporal Analysis of Genome-wide Transcription Changes in Astrocyte Reprogramming (A) Schematic representation of the experimental procedure inducing the activation of Neurog2ERT2-IRES-DsRed or Ascl1ERT2-IRES-DsRed by tamoxifen (OHT indicated by uppermost black bars) for reprogramming astrocytes into neurons. (B, C, E, and F) Micrographs of astrocytes infected with the constructs indicated in red on the left side and immunostained for the astrocytic marker GFAP (green) and the neuronal marker βIII-tubulin (white). Scale bars, 100 μm. (D and G) Quantification of non-reprogrammed cells (GFAP) or reprogrammed cells (βIII-tubulin) without or with OHT 8 days post-induction (DPI). Mean ± SEM; n = 4 independent experiments; statistical test: two-tailed Mann-Whitney test (p < 0.05). (H) Schematic representation of the experimental procedure for genome-wide mRNA analysis. (I) Heatmap of genes regulated by both Neurog2ERT2 and Ascl1ERT2 within 24 hr after induction by OHT. (J) Venn diagram of genes regulated by Neurog2ERT2 or Ascl1ERT2 24 hr after OHT. (K and L) Real-time qPCR) analysis on selected candidates upon Neurog2ERT2 (K) or Ascl1ERT2 (L) induction by OHT for 24 hr. Mean ± SEM; n = 3 independent experiments. See also Figure S1, Table S1, Table S2, Table S3, Table S4, and Table S5.
Figure 2
Figure 2
Identification of Essential Downstream Effectors in Astrocyte Reprogramming (A) Schematic representation of retrovirus with expression cassette for miRNAs. (B, C, E, and F) Micrographs of astrocytes, infected with the vectors indicated on top of the panels (green), were immunostained for GFAP (red) and βIII-tubulin (white). Scale bars, 50 μm. (D and G) Quantification of changes in βIII-tubulin+ neurons (gray bars), GFAP+ astrocytes (blue bars) or double-negative cells (red bars) at 8 DPI with the vectors indicated on top of the histograms. Mean ± SEM in (D); n = 4 independent experiments (p < 0.05; ∗∗p < 0.01). Mean ± SEM in (G); n = 3 independent experiments (p < 0.05). See also Figure S2.
Figure 3
Figure 3
Combinations of Common Downstream Targets Reprogram Astrocytes into Neurons (A) Schematic representation of the experimental procedure. (B–E) Micrographs depicting astrocytes co-infected with the constructs indicated on top of the panels (red and green) immunostained for βIII-tubulin (white) at 8 DPI. Scale bars, 50 μm. (F) Quantification of βIII-tubulin+ cells with neuronal morphology among DsRed+GFP+ double infected cells at 8 DPI. Mean ± SEM; n = 4 independent experiments (p < 0.05). (G) Quantification of branches per neurons/combination. Mean ± SEM; n = 3 independent experiments (∗∗p < 0.01). See also Figures S3 and S4.
Figure 4
Figure 4
Generation of Synaptically Mature Neurons upon Combined Expression of Downstream Targets (A) Schematic representation of the experimental procedure. (B–D) Electrophysiological characterization of induced neurons upon overexpression of the constructs indicated by live fluorescence during recordings. Examples of sustained trains of APs generated when recording in current-clamp mode are shown (in B′, C′, and D′ top panel: stimulation protocol). 50% repetitive firing NeuroD4/GFP cells present first spike latency lower than 70 ms, with 50% higher than 150 ms; an example of frequency adaptation is shown (B′′ and B′′′). In (C′), an example of a repetitive AP generated in NeuroD4/Insm1 transduced cells is shown (four generated the first spike with a latency lower than 70 ms and the remaining two did so with a latency higher than 150 ms) and characterized by spike accommodation (C′′) and spike adaptation (C′′′). (D′′ and D′′′) show examples of repetitive spike discharge in NeuroD4+Prox1-expressing neurons. (B′′′′–D′′′′) A pie chart shows the fraction of cells firing bursting (gray), transient (blue), or sustained (yellow) APs. (E) Table summarizing the electrophysiological parameters measured (brackets indicate the number of cells analyzed). (F) Example of NeuroD4-induced neurons at 14 DPT (F′). A depolarizing current pulse (1 s, 85 pA) induced a train of APs (F′′). In (F′′′) the autaptic response (black trace, average of 10) could be blocked by NBQX (5 μM, red trace, average of 10). (G and G′) Example of NeuroD4-Insm1-induced neurons at 14 DPI. A depolarizing current pulse (1 s, 230 pA) induced a train of APs (G′′). In (G′′′) the autaptic responses (black trace, average of 10) could be blocked by NBQX (10 μM, 10 min red trace, average of 10) and partially reversed following washout for 45 min (blue trace). (H) Micrograph depicting a neuron induced by co-expression of NeuroD4-containing viral vector (red) and Insm-containing viral vector (green) immunostained at 30 DPI for MAP2 (H′, blue) and vGlut1 (H′′, white). Scale bar, 50 μm. See also Figure S3.
Figure 5
Figure 5
Delayed Induction of Neurog2ERT2 Reveals a Block in Astrocyte Reprogramming (A) Scheme of the experimental procedure. (B and C) Micrographs of Neurog2ERT2-infected astrocytes (red) immunostained for GFAP (green) and βIII-tubulin (white), without (B) or with (C) OHT treatment starting at 6 days after being plated. Scale bars, 100 μm. (D) Histogram depicting the proportion of GFAP+ or βIII-tubulin+ cells among infected cells upon delayed Neurog2ERT2 activation at 13 DPI. n = 4 independent experiments. (E and F) Histograms of real-time qPCR (E) and HA-Neurog2ERT2 μChIP-PCR (F) of astrocyte cultures treated as indicated in the legend (early, early OHT treatment, gray bars in E from Figure 1A; and delayed, OHT treatment 6 days later). For (F) cells were exposed to OHT treatment for 24 hr. Percentages of input chromatin were quantified in duplicate from three independent biological samples (mean ± SEM). Significance was tested between samples and respective Dll1 ORF negative region by two-tailed unpaired t test (p < 0.05, ∗∗p < 0.01, ∗∗∗p < 0.0001). (G) Scheme of the experiment. (H–J) Micrographs of astrocytes transfected with the constructs indicated on top of the panels with a 5 day delay immune-stained for βIII-tubulin 8 days post transfection (DPT). Scale bars, 50 μm. (K) Histogram depicting the proportion of βIII-tubulin+ cells at 8 DPT. Mean ± SEM; n = 4 independent experiments (p < 0.05). See also Figure S5.
Figure 6
Figure 6
Chromatin Marks and REST Binding at Regulatory Regions of the Downstream Targets NeuroD4, NeuroD1, and Sox11 (A and A′) H4K20me3 μChIP-PCR on immunoprecipitated material from astroglia cultures collected 1 day or 6 days after being plated as indicated in the scheme at top of (A). (B and B′) Analysis of REST binding to NeuroD4 by μChIP-PCR on immunoprecipitated samples from short-term astroglia cultures as indicated in the scheme in (B). Amplification of the REST binding element within the NeuroD1 intron was used as a positive control while a region within the promoter of Sox11 was used as a negative control. Percentages of input chromatin were quantified in duplicate from three independent biological samples (mean ± SEM). (C and C′) REST μChIP-PCR on immunoprecipitated samples from Neurog2ERT2-transduced astrocytes cultured for shorter or longer periods and treated with OHT for 24 hr as indicated at the top of (C). REST ChIP values were normalized to their respective mock ChIP values (mean ± SEM in duplicate from three independent biological samples; two-tailed unpaired t test, p < 0.05). (D and D′) HA-Neurog2ERT2 μChIP-PCR on immunoprecipitated genomic DNA from delayed astroglia cultures. RESTflox cKO were transduced with Neurog2ERT2 and adeno-Cre virus with a late OHT induction as indicated (D). The Atoh8 promoter and NeuroD1 promoter regions were used as controls for the effect of REST deletion on Neurog2 binding. Percentages of input chromatin were quantified in duplicate from three independent biological samples (mean ± SEM; two-tailed unpaired t test, p < 0.05). (E and E′) Real-time qPCR analysis on Neurog2ERT2-astrocytes treated with OHT for 48 hr after early or late REST Cre-mediated deletion as indicated at the top of the histogram (E). Control samples (Cre- OHT+) were transduced with adeno null virus 1 day after being seeded at the same time as the delayed Cre sample (adeno-Cre virus, Early Cre+OHT+). In parallel, another set of cells was transduced with adeno-Cre virus 5 days later (Delayed Cre+OHT+). Mean ± SEM in duplicate from three independent culture batches. See also Figure S6.
Figure 7
Figure 7
Deletion of REST Removes Reprogramming Block in Astrocytes (A) Schematic representation of the experimental procedure. (B–E) Micrographs of Neurog2ERT2-infected astrocytes (red) with early (B and C) or late (D and E) deletion of REST by infection with a Cre containing viral vector (green) immunostained for the neuronal marker βIII-tubulin (white) at 8 DPI. Yellow arrowheads indicate triple positive cells (DsRed, YFP, βIII-tubulin) while white arrowheads indicate double positive cells (DsRed, GFP). Scale bars, 150 μm. (F) Histogram depicting the proportion of co-transduced double positive cells (red and green) for the astrocytic marker (GFAP, white bars) or the neuronal marker (βIII-tubulin, black bars). Mean ± SEM, three independent biological samples; two-tailed unpaired t test, p < 0.05; ∗∗∗p < 0.001. (G) Postnatal (day 6–7) mouse cortical astrocytes transduced with Ascl1 or Neurog2 are reprogrammed into neurons. However, when cells are maintained longer in culture, increasing levels of H4K20me3 modify the local chromatin environment that becomes favorable to the repressive complex REST. Consequently, Neurog2 fails to access the NeuroD4 promoter. This is bypassed by common downstream transcription factors to both Ascl1 and Neurog2 that are able to generate neurons also in prolonged astrocytic cultures. Unidentified REST co-factors might be recruited to the locus to further remodel the chromatin over time. See also Figure S7.

Comment in

References

    1. Berninger B., Costa M.R., Koch U., Schroeder T., Sutor B., Grothe B., Gotz M. Functional properties of neurons derived from in vitro reprogrammed postnatal astroglia. J. Neurosci. 2007;27:8654–8664. - PMC - PubMed
    1. Gao Z., Ure K., Ding P., Nashaat M., Yuan L., Ma J., Hammer R.E., Hsieh J. The master negative regulator REST/NRSF controls adult neurogenesis by restraining the neurogenic program in quiescent stem cells. J. Neurosci. 2011;31:9772–9786. - PMC - PubMed
    1. Ge W.P., Miyawaki A., Gage F.H., Jan Y.N., Jan L.Y. Local generation of glia is a major astrocyte source in postnatal cortex. Nature. 2012;484:376–380. - PMC - PubMed
    1. Gohlke J.M., Armant O., Parham F.M., Smith M.V., Zimmer C., Castro D.S., Nguyen L., Parker J.S., Gradwohl G., Portier C.J., Guillemot F. Characterization of the proneural gene regulatory network during mouse telencephalon development. BMC Biol. 2008;6:15. - PMC - PubMed
    1. Guo Z., Zhang L., Wu Z., Chen Y., Wang F., Chen G. In vivo direct reprogramming of reactive glial cells into functional neurons after brain injury and in an Alzheimer’s disease model. Cell Stem Cell. 2014;14:188–202. - PMC - PubMed

Publication types

MeSH terms

Associated data