. 2016 Apr 7;35(14):1811-21.
doi: 10.1038/onc.2015.246. Epub 2015 Jun 29.

PML is required for telomere stability in non-neoplastic human cells

Affiliations

PML is required for telomere stability in non-neoplastic human cells

M Marchesini et al. Oncogene. .

Erratum in

  • PML is required for telomere stability in non-neoplastic human cells.
    Marchesini M, Matocci R, Tasselli L, Cambiaghi V, Orleth A, Furia L, Marinelli C, Lombardi S, Sammarelli G, Aversa F, Minucci S, Faretta M, Pelicci PG, Grignani F. Marchesini M, et al. Oncogene. 2016 Apr 7;35(14):1876. doi: 10.1038/onc.2015.312. Oncogene. 2016. PMID: 27052595 Free PMC article. No abstract available.

Abstract

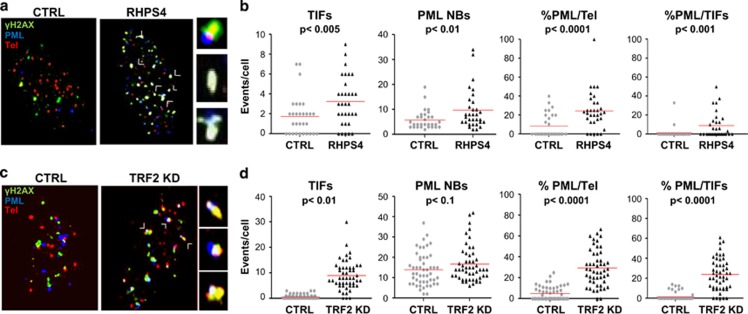
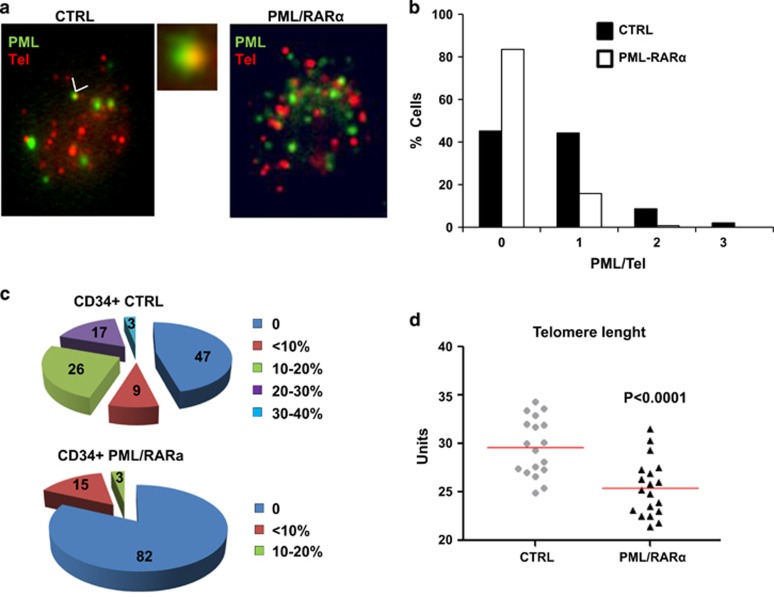
Telomeres interact with numerous proteins, including components of the shelterin complex, whose alteration, similarly to proliferation-induced telomere shortening, initiates cellular senescence. In tumors, telomere length is maintained by Telomerase activity or by the Alternative Lengthening of Telomeres mechanism, whose hallmark is the telomeric localization of the promyelocytic leukemia (PML) protein. Whether PML contributes to telomeres maintenance in normal cells is unknown. We show that in normal human fibroblasts the PML protein associates with few telomeres, preferentially when they are damaged. Proliferation-induced telomere attrition or their damage due to alteration of the shelterin complex enhances the telomeric localization of PML, which is increased in human T-lymphocytes derived from patients genetically deficient in telomerase. In normal fibroblasts, PML depletion induces telomere damage, nuclear and chromosomal abnormalities, and senescence. Expression of the leukemia protein PML/RARα in hematopoietic progenitors displaces PML from telomeres and induces telomere shortening in the bone marrow of pre-leukemic mice. Our work provides a novel view of the physiologic function of PML, which participates in telomeres surveillance in normal cells. Our data further imply that a diminished PML function may contribute to cell senescence, genomic instability, and tumorigenesis.


Figures

Figure 1
Figure 1
PML associates with telomeres in telomerase-positive and non-neoplastic cells. (a) Confocal images of a representative immuno-FISH experiment performed with anti-PML antibodies (green, Alexa488) and a telomeric PNA probe (red, Cy3) in normal human fibroblast (MRC5) a telomerase-positive cell line (HeLa) and an ALT cell line (U2OS). PML/Tel colocalizations were identified as overlapping signals in cell nuclei evidenced by DAPI staining. An enlargement of the colocalizing signals pointed by the arrows is shown on the right. (b) Quantitative analysis of immune-FISH experiments for PML-telomere colocalization in WI38, MRC-5 (normal human fibroblasts), mouse embryonic fibroblasts (MEFs), U937, HeLa, A549 (telomerase-positive cancer cells) and U2OS, SK-LU1, SA-OS-2 (ALT-positive cancer cells). Fifty cells per type were scored in each of three experiments. The percentage of PML-NBs co-localizing with telomeres is shown as average ±s.d.
Figure 2
Figure 2
Automated Image Cytometry Analysis of PML-telomere association. (a) Images from automated Image Cytometry Analysis on MRC5 cells. The cells were stained with fluorescent antibodies conjugated with different dyes against 53BP1 (Pacific Orange), TRF2 (Alexa 647), PML (Alexa 488); DNA was stained with (DAPI) and EdU (Pacific Blue). Damaged telomeres were analyzed by PLA to detect 53BP1 and Trf2 proximity (see text and Materials and methods). PLA foci, Trf2 foci, PML foci and 53BP1 foci indicate the electronic signals automatically identified by the computer within the indicated nuclear contour. The overlap of all the fluorescences is shown in the last panel. (b) Parameters of computational analysis for the Image Cytometry Analysis software; dXY: distance of the X and Y centers; rPML, rTel: radius of the signal; (c) Average number of PML-NBs and the average number of their colocalization with telomeres per cell in a representative experiment. The total number of cells, telomeres, PML-NBs and colocalizations is indicated. (d) EdU-DNA content dot plot showing the procedure to identify cell-cycle phases, as explained in Materials and methods. The inset shows the DNA content distribution of the analyzed population of cells (n=15 636). (e) Bivariate dot plot reporting on the X axis the DNA content and on the Y axis the number of colocalization PML signals per cell of PML and Trf2 bodies. The insert shows the average number of PML signals in each cell-cycle phase as identified by the analysis. (f) Bivariate dot plot reporting on the X axis the DNA content and on the Y axis the number of PML bodies per cell. The insert shows the average number of events in each cell-cycle phase as identified by the analysis; the number of analyzed MRC5 exponentially growing cells is indicated. (g, h) Average number of PML-NBs or TIFs, as scored by analysis of the indicated number of proliferating (P) or late passage NS cells, as indicated and defined in the Materials and methods. Statistical significance has been calculated by a two-tailed Student's t-test. (i, j) Representative experiments showing the percentage of cells with at least one TIF or one PML/TIF colocalization. TIF scored by PLA between Trf2 and 53BP1 protein.
Figure 3
Figure 3
PML association with telomeres increases upon telomeres attrition. (a) Representative immune-FISH experiments on WI38 normal proliferating (P) or late passage NS human fibroblasts. Merged images of the fluorescence signals produced by a telomeric probe (red, Cy3), anti-PML (Cy5) or anti-γH2AX antibodies (green, Alexa488). Enlargements of triple overlapping signals are shown. (b) Quantitative analysis of experiments as in (a). Each dot represents one of fifty cells analyzed in one experiment representative of three. The average values (red lines) indicate the number of TIFs ±s.d. (1.78±0.19 in proliferating and 4.86±0.5 in NS cells) or PML-NBSs per cell (8.72±0.79 in proliferating and 15.06±0.9 in NS cells), the percentage of PML-NBSs colocalizing with telomeres (PML/Tel%: 21.62±4.08 in proliferating and 45.83±3.9 in NS cells) and the percentage of PML-NBSs colocalizing with TIFs (PML/TIFs% 16.03±2.75 in proliferating and 30.56±3.39 in NS cells), as detected by triple γH2AX/telomeres/PML signals colocalization. (c) Representative immuno-FISH experiment performed on normal age-matched control (CTRL) and TERT-mutated IL-2 stimulated peripheral blood T cells, using a telomeric PNA probe (red, Cy3) and anti-PML antibodies (green, Alexa488) and merged images. Enlargements of PML/Telomere colocalizations are shown on the right. (d) Quantitative analysis of experiments as in (c), on IL-2 stimulated normal (CTRL) or TERT-deficient T-cells (Pt) at culture days 7 (d7) and 21 (d21). Percentage of cells with TIFs (average±s.d. from three independent experiments: day 7 CTRL 3.1±0.19, Pt 26.1±0.45; day 21 CTRL 12.0±0.53, Pt 32.1±0.75). (e) Quantitative analysis of immune-FISH experiments performed as in (a). The average values (red lines) indicate the number of TIFs or PML-NBSs per cell and the percentage of PML-NBs colocalizing with telomeres (% PML/Tel). (TIFs: day 7, CTRL 0.26±0.09, Pt 0.66±0.18; day 21, CTRL 0.64±0.19, Pt 1.46±0.33 PML-NBs: day 7, CTRL 4.22±0.32, Pt 5.48±0.44; day 21, CTRL 3.1± 0.19, Pt 3.92±0.34; %PML/Tel day 7, CTRL 10.2.7±2.27, Pt 25.2±2.87; day 21, CTRL 16.9±3.16, Pt 37.6±3.42). The P-values are based on a two-tailed Student's t-test.
Figure 4
Figure 4
PML associates with damaged telomeres. (a) Representative immuno-FISH experiments on WI38 normal human fibroblasts, before and after specific telomeric damage induced by RHPS4 treatment. Merged images generated by a telomeric PNA probe (red, Cy3) and anti-γH2AX (green, Alexa488) or anti-PML (blue, Cy5) antibodies. Enlargements of triple overlapping signals are shown on the right. (b) Quantitative analysis of the immune-FISH experiments shown in (a). Each dot represents one of fifty cells analyzed in each of three experiments and counted before (CTRL) and after RPHS4 treatment. The average values (red lines) show the number of TIFs per cell (1.77±0.36 before and 3.25±0.43 after treatment) or PML-NBs per cell (5.9±0.7 before and 9.78±1.39 after treatment), the percentage of PML-NBs colocalizing with telomeres (%PML/Tel: 8.38±2.25 before and 24.77±3.55 after treatment) and the percentage of PML-NBs colocalizing with TIFs (%PML/TIFs: 1.44±1.15 before and 8.88±2.37 after treatment) as detected by triple γH2AX/telomeres/PML signals colocalization. (c) Representative immuno-FISH experiment, performed as in (a), on WI38 cells before (CTRL) after (TRF2 KD) TRF2 RNA interference. Three enlargements of triple overlapping signals are shown. (d) Quantitative analysis, as in (b), of immune-FISH experiments performed on WI38 cells before (CTRL) after (TRF2 KD) TRF2 RNA interference. TIFs 0.72±0.13 in control and 9.04±0.81 in TRF2 KD cells; PML-NBs 14.0±1.14 in control and 17.0±1.25 in TRF2 KD cells; % PML/Tel 5.28±0.94 in control and 29.5±2.44 in TRF2 KD cells; % PML/TIFs 1.75±0.57 in control and 23.99±2.26 in TRF2 KD cells. The P-values indicated in (b) and (d) are based on a two-tailed Student's t-test.
Figure 5
Figure 5
PML depletion leads to telomere damage and senescence in human fibroblasts. (a) Growth of WI38 and MRC5 cells infected with PML shRNAs KD1 or KD2 or control luciferase shRNA (CTRL). Cells were counted at the indicated times after 6 days of puromycin selection. The error bars indicate the s.d. of the counts obtained in three experiments. Above the curves is a representative western blotting with the indicated antibodies, from cells lysed at day 3 after selection. (b) Microphotographs of control (CTRL) or PML knockdown (PML KD1) WI38 cells at 6 days post selection, unstained or stained for SA-β-galactosidase. (c) Quantitative analysis of SA-β-gal-staining on the cells shown in (b). (d) Western blotting with the indicated antibodies on the indicated WI38 cells lysed after 6 days of PML RNAi. (e) Representative immuno-FISH experiment on MRC-5 cells infected with PML-KD1: merged image of the signals obtained with a telomeric probe (red, Cy3) and anti-yH2AX (green, Alexa488) and anti-PML (blue, Cy5) antibodies. Enlarged PML/TIF colocalization images are shown on the right. (f) Quantitative analysis of immuno-FISH experiments performed as in (e), showing the number of TIFs per cell in MRC5 and WI38 cells, before (CTRL) and after PML knockdown (PML KD). Each dot represents one of the fifty cells analyzed in each of three experiments. The average value (red line) shows the number of TIFs per cell (0.96±0.19 in Control and 2.9±0.36 PML KD MRC5 cells and 1.34±0.19 in control or 2.6±0.3 in PML KD WI38 cells, respectively). The P-value was obtained by a two-tailed Student's t-test. (g) Representative immuno-FISH experiment performed on PML-depleted MRC-5 cells using a telomeric probe (red, Cy3) and anti-p53 (green, Alexa488) and anti-γH2AX (blue, Cy5) antibodies; notably, very few apoptotic nuclei were detected in PML-depleted cells without a significant increase as compared with control cells. Enlargements of a single p53-positive cell and TIFs are shown on the right. (h) Quantitative evaluation of p53-positive MRC5 cells after the infection with a control vector (CTRL) or the PML-KD1 vector. (i) Quantitative analysis of immuno-FISH experiments indicating the percentage of p53-positive cells showing the indicated number of TIFs per cell. The experiments shown in (h) and (i) are representative of three.
Figure 6
Figure 6
PML depletion causes nuclear and chromosomal abnormalities in human fibroblasts. (a) Microphotographs at the indicated magnification of MGG-stained slides of MRC5 cells, transfected with a control non-specific siRNA (CTRL) or PML-KD1 siRNA (PML-KD) for PML RNA interference. (b) Percentage of binucleated cells counted in wild type (Wt), control (CTRL) and PML KD MRC5 cells relative to total asynchronous events evaluated by DAPI staining. A representative experiment of three is shown. One hundred cells were analyzed in each experiment. (c) DAPI nuclear staining (DAPI) and immunofluorescence with anti-PML antibodies (PML) on control (CTRL) or PML KD MRC5 cells, treated with blebbistatin to block cytokinesis. Representative images of NPBs, MNs and nuclear buds (Bs) in PML-depleted cells. (d) Quantitative analysis of overall nuclear abnormalities in PML-depleted cells. NPBs, MNs and Bs were counted and percentages calculated with respect to total cells. A representative experiment of three is shown. One hundred binucleated cells were analyzed in each experiment. (e) Metaphase spreads of control (CTRL) and PML-depleted (PML KD) MRC-5 cells, as above. Examples of chromosomal aberrations are enlarged on the right. (f) Chromosome aberration analysis in control (CTRL) and PML-depleted (PML KD) cells, as above. Bars represent metaphases with at least one aberration events as a percentage of all the scored metaphases. The error bars indicate the s.d. of the counts obtained in three experiments where 50 metaphases were analyzed. The P-value was obtained by a two-tailed Student's t-test.
Figure 7
Figure 7
The expression of the APL fusion protein PML/RARα impairs the telomeric function of PML. (a) Representative image from immuno-FISH experiments with a telomere probe (red, Cy3) and an anti-PML antibody (Alexa488), performed in human CD34+ HPCs infected with a control vector (CTRL) or a PML/RARα expressing vector. An enlargement of a PML/Telomere colocalization detected in CTRL cells is shown. (b) Percentage of cells with the indicated number of PML/telomere colocalization in control or PML/RARα expressing human CD34+ HPCs in a representative experiment of three. 100 cells were analyzed. (c) Percentage of CD34+ human HPCs with the indicated percentage of PML signals colocalizing with telomeres in a representative experiment. In control cells (CTRL) PML-NB were counted. In PML/RARα expressing cells microspeckles were counted. 100 cells were analyzed. One representative experiment of three is shown. (d) Telomere length in murine bone marrow cells obtained between 2 and 4 months after transplant with syngeneic Lin− bone marrow cells, infected in vitro with a control retroviral vector (CTRL) or a PML/RARα expressing vector. Telomeres length is expressed in arbitrary fluorescence units relative to a standard curve. Each dot represents a mouse. A red line indicates the average value: CTRL 29.7±4.6 s.d. PML/RARα 25.8±4.9 s.d. The indicated P-value is based on a two-tailed Student's t-test.

References

    1. Akbar AN, Vukmanovic-Stejic M. Telomerase in T lymphocytes: use it and lose it? J Immunol 2007; 178: 6689–6694. - PubMed
    1. Bailey SM, Meyne J, Chen DJ, Kurimasa A, Li GC, Lehnert BE et al. DNA double-strand break repair proteins are required to cap the ends of mammalian chromosomes. Proc Nati Acad Sci USA 1999; 96: 14899–14904. - PMC - PubMed
    1. Nandakumar J, Cech TR. Finding the end: recruitment of telomerase to telomeres. Nat Rev Mol Cell Biol 2013; 14: 69–82. - PMC - PubMed
    1. d'Adda di Fagagna F, Reaper PM, Clay-Farrace L, Fiegler H, Carr P, Von Zglinicki T et al. A DNA damage checkpoint response in telomere-initiated senescence. Nature 2003; 426: 194–198. - PubMed
    1. Takai H, Smogorzewska A, de Lange T. DNA damage foci at dysfunctional telomeres. Curr Biol 2003; 13: 1549–1556. - PubMed

Publication types