. 2015 Jul 23;22(7):938-45.
doi: 10.1016/j.chembiol.2015.05.019. Epub 2015 Jun 25.

DNA Electrochemistry Shows DNMT1 Methyltransferase Hyperactivity in Colorectal Tumors

Affiliations

DNA Electrochemistry Shows DNMT1 Methyltransferase Hyperactivity in Colorectal Tumors

Ariel L Furst et al. Chem Biol. .

Abstract

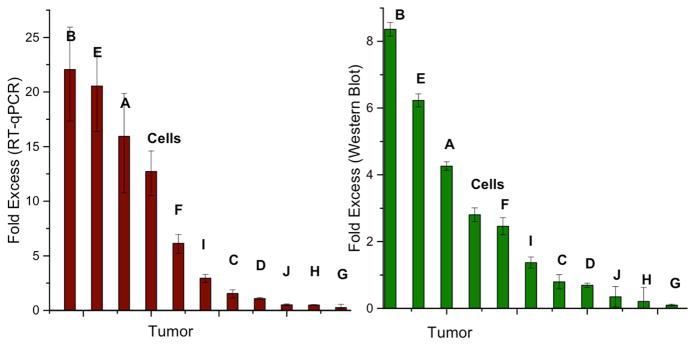
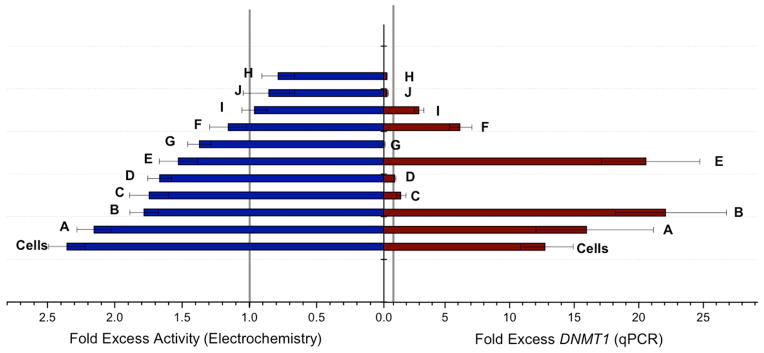
DNMT1, the most abundant human methyltransferase, is responsible for translating the correct methylation pattern during DNA replication, and aberrant methylation by DNMT1 has been linked to tumorigenesis. We have developed a sensitive signal-on electrochemical assay for the measurement of DNMT1 activity in crude tissue lysates. We have further analyzed ten tumor sets and have found a direct correlation between DNMT1 hyperactivity and tumorous tissue. In the majority of samples analyzed, the tumorous tissue has significantly higher DNMT1 activity than the healthy adjacent tissue. No such correlation is observed in measurements of DNMT1 expression by qPCR, DNMT1 protein abundance by western blotting, or DNMT1 activity using a radiometric DNA labeling assay. DNMT1 hyperactivity can result from both protein overexpression and enzyme hyperactivity. DNMT1 activity measured electrochemically provides a direct measure of activity in cell lysates and, as a result, provides a sensitive and early indication of cancerous transformation.


Figures

Figure 1
Figure 1
Electrochemical array for DNMT1 activity detection. The array contains two sets of fifteen gold electrodes, each embedded in a Teflon plate. Each electrode has a 1 mm diameter. The two complementary Teflon arrays are assembled with a 150 μm spacer between them, which was previously determined to be the optimal distance such that signals are not diffusion-limited.29 The electrodes of the primary (bottom) array are modified with DNA of the desired sequences such that DNA-mediated charge transport is detectable. The electrodes of the secondary (top) array are bare for electrochemical detection.
Figure 2
Figure 2
Signal-on electrochemical assay for DNMT1 detection. Left: The bottom electrode modified with a dilute DNA monolayer is responsible for generating electrochemical signals through DNA-mediated charge transport (CT) amplified by electrocatalysis. Methylene blue (MB+), a DNA intercalating redox probe, is reduced by DNA CT to leucomethylene blue (LB), where it can interact with an electron sink, ferricyanide. Upon interaction, ferricyanide is reduced to ferrocyanide, reoxidizing leucomethylene blue to methylene blue in the process. Current is generated and detected at the secondary electrode from the reoxidation of ferrocyanide. The current generated is proportional to the amount of ferrocyanide oxidized, which depends on the amount of methylene blue reduced by DNA CT and dissociated. To detect DNMT1, crude lysate (multicolored shapes in background) is added to the electrode. If DNMT1 (blue heart) is capable of methylating the hemi-methylated DNA substrate (green arrows), the DNA on the electrode becomes fully methylated. If the protein is not active, the DNA remains hemi-methylated (red arrows). The lysate is washed away prior to the addition of the restriction enzyme. A methylation-specific restriction enzyme (BssHII, brown heart) is then added that cuts the hemi-methylated DNA (red arrow), decreasing the amount of bound methylene blue and significantly attenuating the electrochemical signal, while leaving the fully methylated DNA untouched. Constant potential amperometry (right) is used to measure the percent change before and after restriction enzyme treatment. If the restriction enzyme did not affect the DNA (top), the signals overlay. If, however, the restriction enzyme cuts the DNA, the signal is significantly attenuated (bottom). Constant potential amperometry is run for 90 s with a 320 mV potential applied to the secondary electrode and a −400 mV potential applied to the primary electrode relative to an AgCl/Ag reference. All scans are in Tris buffer (10 mM Tris, 100 mM KCl, 2.5 mM MgCl2, 1 mM CaCl2, pH 7.6) with 4 μM methylene blue and 300 μM potassium ferricyanide.
Figure 3
Figure 3
Detection of DNMT1 in pure form and from crude lysate. A titration of pure DNMT1 protein (left) demonstrates the sensitivity of this method of detection. In blue is shown the titration of pure DNMT1 on our electrodes, while in red is shown pure DNMT1 added to HCT116 DNMT1−/− cultured cell lysate. When the data are fit to a Hill binding model (fits shown as solid traces in plot), a KD of 31±1.3 nM protein is extracted for pure DNMT1 and 32 nM±1.8 nM for DNMT1 added to lysate. The data from an array used to measure the DNMT1 activity from tumor A (right) show the differential between active lysate on electrodes and inactive lysate. The green bar shows electrodes treated with 65 nM pure DNMT1 as a positive control. The blue bars show electrodes treated with tumor A lysate on hemi-methylated substrate (solid) and unmethylated substrate (dashed). The red bars show electrodes treated with adjacent normal tissue A lysate on hemi-methylated DNA (solid) and unmethylated DNA (dashed). As can be seen, a significantly higher amount of signal protection is observed for the tumor tissue on the hemi-methylated substrate than for the adjacent normal tissue on that substrate. The error bars show standard error across three electrodes.
Figure 4
Figure 4
DNMT1 activity measured electrochemically and radioactively. The fold excess activity measured electrochemically (left) shows hyperactivity (fold excess > 1) in all but two of the tissue samples. Those that do not show hyperactivity show equivalent DNMT1 activity between tumor and normal tissue (fold excess ~1). When DNMT1 activity is measured with radioactive labeling (right), the same hyperactivity is not observed likely because the measurement is convoluted by genomic DNA in the lysate samples. In both cases, the data for both the tumor and normal tissue on the hemi-methylated substrate are first normalized to that of the unmethylated substrate, and the data for the tumor tissue are then normalized to the normal adjacent tissue. Data for hemimethylated substrates without normalization to unmethylated substrates are shown in Figures S1 and S2. Each of the letters represents one of the tumor and healthy adjacent tissue sets, and the bar denoted ‘cells’ represents the result from the comparison between HCT116 colorectal carcinoma and healthy CCD-18Co cultured cells.
Figure 5
Figure 5
DNMT1 expression and DNMT1 protein quantification. The fold excess DNMT1 expression is determined with RT-qPCR (left), which shows just as many samples with overexpression of DNMT1 in the tumor (fold excess > 1) as with equivalent expression (fold excess ~1) and underexpression (fold excess < 1). The RT-qPCR expression data for DNMT1 expression in the tumor tissue are normalized to that of the normal adjacent tissue. The error represents the standard error across four replicates. The DNMT1 protein content (right), determined by Western blot, follows the same trend as the fold excess DNMT1 expression; overexpression in the tumor sample correlates to more protein in that sample as compared to the normal adjacent tissue. The same trends are observed for those samples with equivalent expression and underexpression. For DNMT1 protein quantification, the measured intensity of the DNMT1 band is normalized to the Lamin A loading control, and subsequently, data for the tumor tissue are normalized to the normal adjacent tissue. Error bars represent standard error across four sets of Western blots. Sample bands used for quantification are shown in Figure S3. Each of the letters represents one of the tumor and healthy adjacent tissue sets, and the bar denoted ‘cells’ represents the result from the comparison between HCT116 colorectal carcinoma and healthy CCD-18Co cultured cells.
Figure 6
Figure 6
Direct comparison between DNMT1 activity measured electrochemically and DNMT1 expression. The two bar graphs directly compare the fold excess protein activity (blue) measured electrochemically and the fold excess gene expression (red). There is no correlation evident between the amount of expression of DNMT1 and the eventual activity of DNMT1 found in the tissue.

Comment in

References

    1. Baylin SB, Herman JG. DNA hypermethylation in tumorigenesis: epigenetics joins genetics. Trends in Genetics. 2000;16:168–174. - PubMed
    1. Bestor TH. The DNA methyltransferases of mammals. Human Mol Genet. 2000;9:2395–2402. - PubMed
    1. De Marzo AM, Marchi VL, Yang ES, Veeraswamy R, Lin X, Nelson WG. Abnormal Regulation of DNA Methyltransferase Expression during Colorectal Carcinogenesis. Cancer Res. 1999;59:3855–3860. - PubMed
    1. El-Deiry WS, Nelkin BD, Celano P, Yen RWC, Falco JP, Hamilton SR, Baylin SB. High expression of the DNA methyltransferase gene characterizes human neoplastic cells and progression stages of colon cancer. Proc Natl Acad Sci USA. 1991;88:3470–3474. - PMC - PubMed
    1. Esteller M, Toyota M, Sanchez-Cespedes M, Capella G, Peinado MA, Watkins DN, Issa JPJ, Sidransky D, Baylin SB, Herman JG. Inactivation of the DNA Repair Gene O6-Methylguanine-DNA Methyltransferase by Promoter Hypermethylation Is Associated with G to A Mutations in K-ras in Colorectal Tumorigenesis. Cancer Res. 2000;60:2368–2371. - PubMed

Publication types

MeSH terms

Substances