

Neighborhood Foreclosures, Racial/Ethnic Transitions, and Residential Segregation
- PMID: 26120142
- PMCID: PMC4479290
- DOI: 10.1177/0003122415581334
Neighborhood Foreclosures, Racial/Ethnic Transitions, and Residential Segregation
Abstract
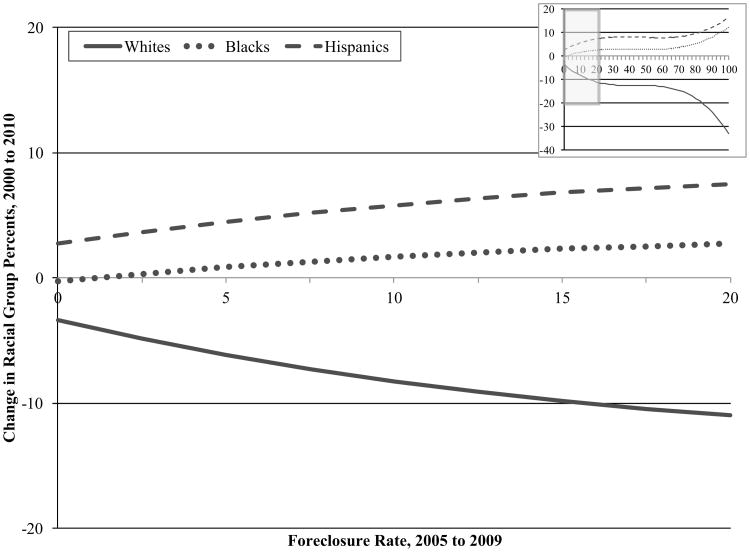
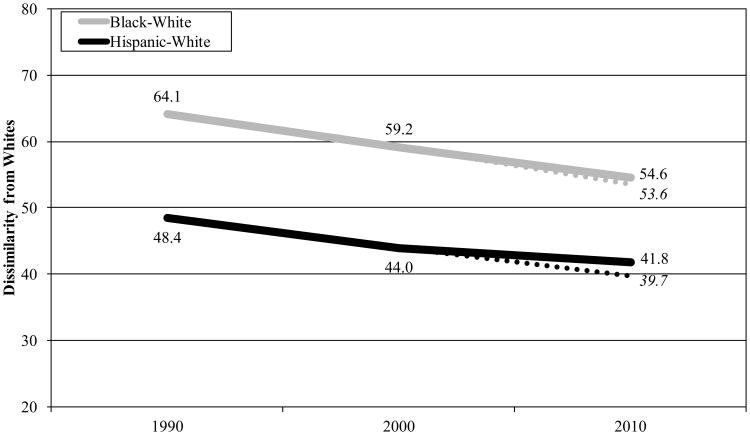
In this article, we use data on virtually all foreclosure events between 2005 and 2009 to calculate neighborhood foreclosure rates for nearly all block groups in the United States to assess the impact of housing foreclosures on neighborhood racial/ethnic change and on broader patterns of racial residential segregation. We find that the foreclosure crisis was patterned strongly along racial lines: black, Latino, and racially integrated neighborhoods had exceptionally high foreclosure rates. Multilevel models of racial/ethnic change reveal that foreclosure concentrations were linked to declining shares of whites and expanding shares of black and Latino residents. Results further suggest that these compositional shifts were driven by both white population loss and minority growth, especially from racially mixed settings with high foreclosure rates. To explore the impact of these racially selective migration streams on patterns of residential segregation, we simulate racial segregation assuming that foreclosure rates remained at their 2005 levels throughout the crisis period. Our simulations suggest that the foreclosure crisis increased racial segregation between blacks and whites by 1.1 dissimilarity points, and between Latinos and whites by 2.2 dissimilarity points.
Keywords: housing foreclosures; racial/ethnic inequality; segregation; subprime lending.
Figures
References
-
- Baumer Eric P, Wolff Kevin T, Arnio Ashley N. A Multicity Neighborhood Analysis of Foreclosure and Crime. Social Science Quarterly. 2012;93(3):577–601.
-
- Baxter Vern, Lauria Mickey. Residential Mortgage Foreclosure and Neighborhood Change. Housing Policy Debate. 2000;11(3):675–99.
-
- Bayer Patrick, Ferreira Fernando, Ross Stephen L. The Vulnerability of Minority Homeowners in the Housing Boom and Bust. National Bureau of Economic Research; 2013.
-
- Been Vicki, Chan Sewin, Ellen Ingrid Gould, Madar Josiah R. Decoding the Foreclosure Crisis: Causes, Responses, and Consequences. Journal of Policy Analysis and Management. 2011;30(2):388–96.
Grants and funding
LinkOut - more resources
Full Text Sources
Other Literature Sources