

doi: 10.1038/nn.4054.
Epub 2015 Jun 29.
Nuclear pore complex remodeling by p75(NTR) cleavage controls TGF-β signaling and astrocyte functions
Affiliations
- PMID: 26120963
- PMCID: PMC4878404
- DOI: 10.1038/nn.4054
Item in Clipboard
Nuclear pore complex remodeling by p75(NTR) cleavage controls TGF-β signaling and astrocyte functions
Nat Neurosci.
2015 Aug.
Abstract
Astrocytes modulate neuronal activity and inhibit regeneration. We show that cleaved p75 neurotrophin receptor (p75(NTR)) is a component of the nuclear pore complex (NPC) required for glial scar formation and reduced gamma oscillations in mice via regulation of transforming growth factor (TGF)-β signaling. Cleaved p75(NTR) interacts with nucleoporins to promote Smad2 nucleocytoplasmic shuttling. Thus, NPC remodeling by regulated intramembrane cleavage of p75(NTR) controls astrocyte-neuronal communication in response to profibrotic factors.
Conflict of interest statement
The authors declare no competing financial interests.
Figures
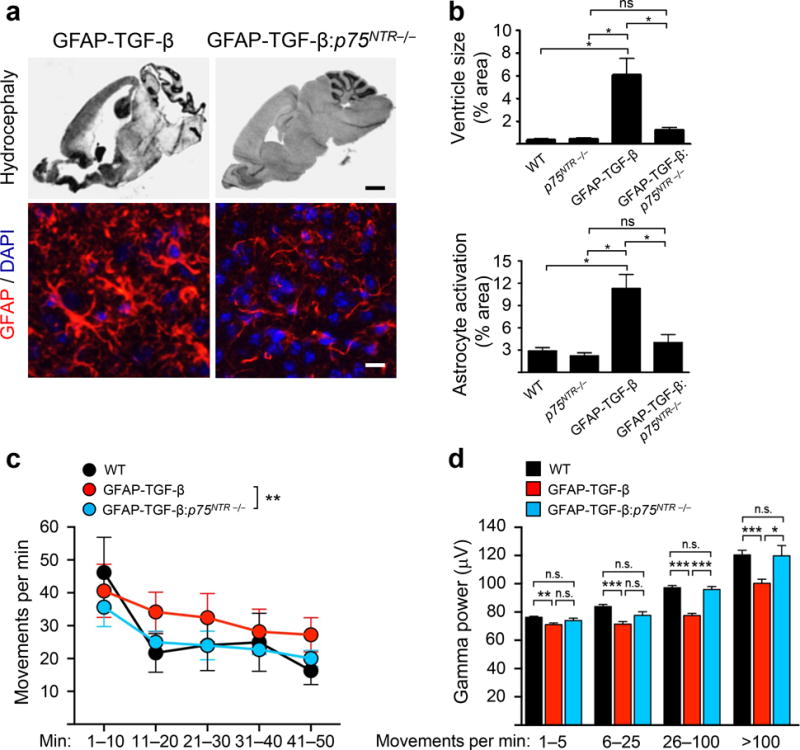
p75NTR deficiency rescues TGF-β-induced hydrocephalus, astrocyte activation and neuronal dysfunction. (a) Hematoxylin and eosin stain and GFAP immunostaining (red) of representative brain sections of 4-week old WT, p75NTR−/−, GFAP-TGF-β, and GFAP-TGF-β: p75NTR−/− mice. Nuclei are stained with 4′,6′-diamidino-2-phenylindole (DAPI) (blue). Representative images are shown from n = 4 mice. (b) Quantification of ventricle size and GFAP intensity (n = 4 mice per group). Values are mean ± SEM. Ventricle size (top), *P = 4.995 × 10⁻⁶; GFAP intensity (bottom), *P = 2.452 × 10⁻⁶ and ns, not significant, by one-way ANOVA. Scale bar, 750 μm (upper) and 15 μm (lower). (c) Locomotor activity in the open field during the 50 min of EEG recordings. p75NTR deficiency normalized locomotor activity in GFAP-TGF-β mice (n = 6–8 mice per group). ** P = 0.003 by repeated-measures ANOVA and Bonferroni post-hoc multiple comparisons test. (d) Gamma oscillatory power (30–80Hz) during different locomotor activity intervals in an open field from (c). GFAP-TGF-β, but not GFAP-TGF-β:p75NTR−/−, mice had impaired activity-dependent inductions of gamma oscillatory activity (n = 6–8 mice per group). *P < 0.05, ** P < 0.01, *** P < 0.001 by one-way ANOVA and Bonferroni post-hoc multiple comparisons test; 1–5 movements/min, P = 0.009; 6–25 movements/min, P = 9.568 × 10⁻⁵; 26-100 movements/min, P = 4.793 × 10⁻¹⁷; >100 movements/min, P = 0.0002.
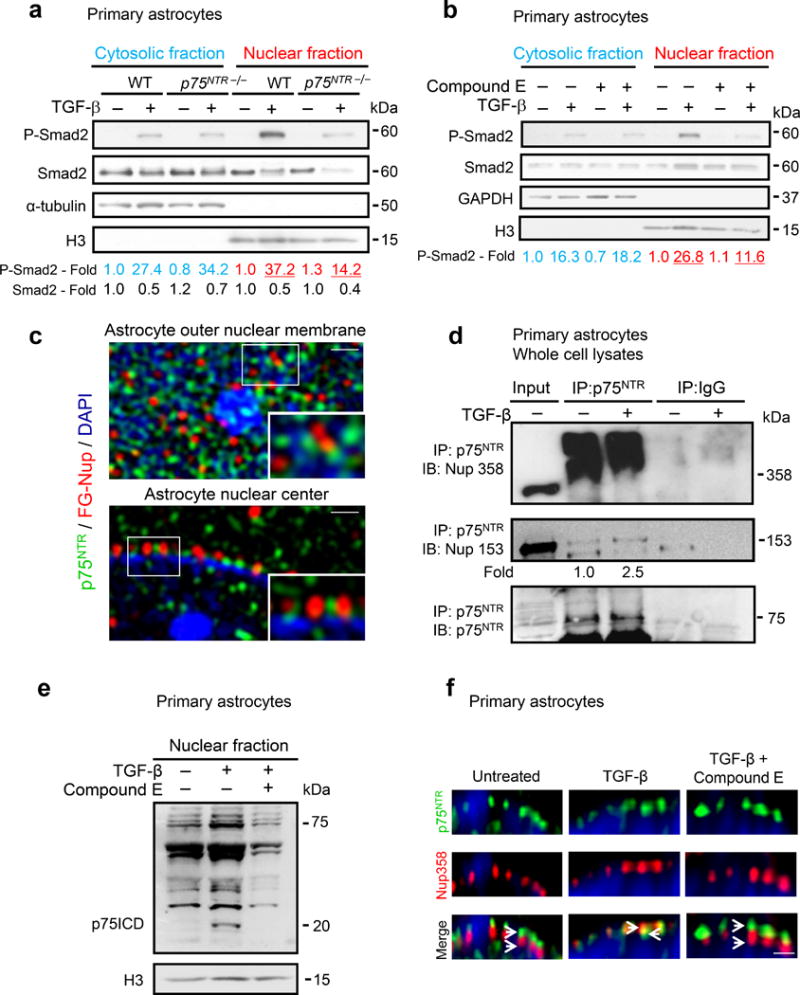
p75NTR is a component of the NPC regulating TGF-β-induced P-Smad2 nuclear translocation. (a) P-Smad2 in the cytosolic and nuclear fractions of WT and p75NTR−/− astrocytes. Representative immunoblots from three independent experiments are shown. (b) P-Smad2 in cytosol and nuclear fractions of TGF-β-treated astrocytes in the presence of the γ-secretase inhibitor compound E. Representative immunoblots from three independent experiments are shown. (c) 3D-SIM of WT astrocytes stained for p75NTR (green) and FG-Nup (red) shows abundant p75NTR staining at the nuclear surface (top) and sparse p75NTR staining in the nuclear center (bottom). Enlargement of regions indicated by a rectangle show p75NTR adjacent to FG-Nup proteins at the nuclear surface (top inset) and the nuclear center (bottom inset). Scale bars: 250 nm, top and bottom panel and 100 nm, insets. Nuclei are stained with DAPI (blue). Representative images from three independent experiments are shown. (d) Endogenous co-immunoprecipitation of p75NTR with individual FG-Nup proteins in whole cell lysates. Representative immunoblots are shown from two independent experiments. (e) Nuclear fraction of WT astrocytes treated with TGF-β for 1 h, or after 4 h pre-treatment with γ-secretase inhibitor compound E. Blots were developed with anti-p75NTR and H3 antibodies. Representative immunoblots from three independent experiments are shown. (f) 3D-STED of WT astrocytes stained for p75NTR (green) and FG-Nup358 (red). TGF-β-induced relocalization of p75NTR signal within the NPC is blocked by Compound E. Scale bar: 100 nm. Nuclei are stained with DRAQ5 (blue). Representative images are shown from two independent experiments. Full-length blots are shown in Supplemental Figure 15.
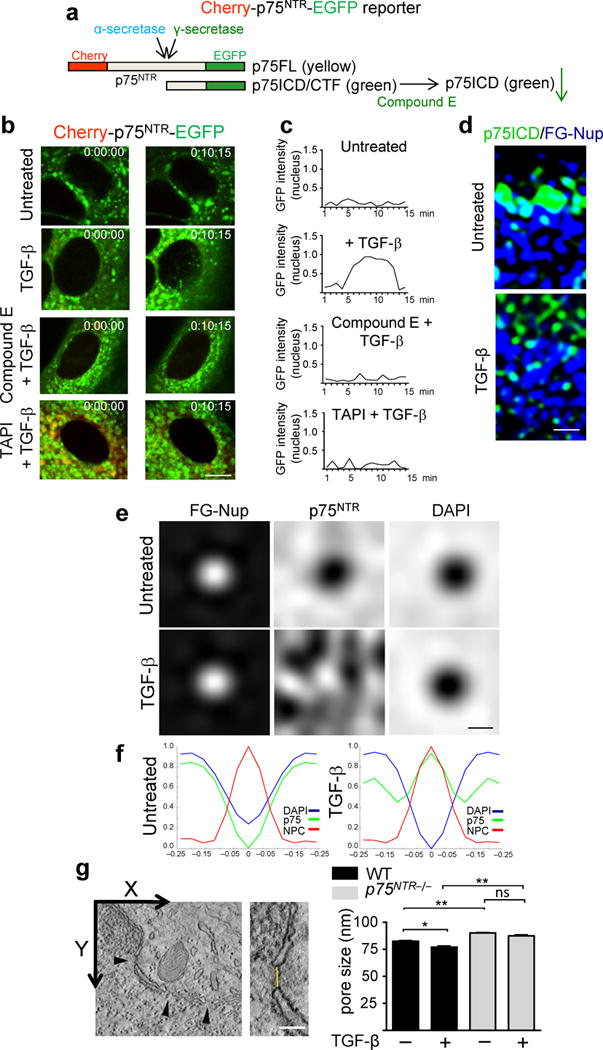
TGF-β-induced p75NTR intramembrane cleavage regulates the NPC structure and function. (a) Cherry-p75NTR-EGFP fusion protein. p75NTR N-terminal, Cherry (red); p75NTR C-terminal, EGFP (green); uncleaved p75FL (yellow). EGFP signal reduction after γ-secretase inhibition indicates reduced p75ICD formation. (b) Real-time imaging of TGF-β-treated astrocytes transfected with cherry-p75NTR-EGFP in the presence of the γ-secretase inhibitor compound E or the α-secretase inhibitor TAPI-2. Representative merged cherry/EGFP images from three independent experiments are shown. Scale bar, 5 μm. (c) Quantification of nuclear EGFP signal. Values from the mean of 20 nuclei obtained from three independent experiments. (d) TGF-β-treated WT astrocytes show increased nuclear p75ICD (right) compared to control (left). Scale bar: 200 nm. Representative images from five independent experiments are shown. (e) Averaged signal for p75NTR (white) revealed relocalization of p75NTR into the NPC in TGF-β-treated astrocytes. p75NTR signal is absent (black) in the NPC in untreated astrocytes. Scale bar, 100 nm. (f) Quantification of p75NTR (green), FG-Nup (red) and DAPI signals (blue) in ~800 NPCs obtained from three independent experiments. (g) Nuclear pore diameter measurements by 3D electron tomography in ~16 nuclear pores per condition. Values are mean ± SEM. *P < 0.01, ** P < 0.0001, and ns, not significant, by one-way ANOVA and Bonferroni post-hoc multiple comparisons; WT untreated vs WT + TGF-β, P = 0.0003; WT untreated vs p75NTR−/− untreated, P = 3.794 × 10⁻⁷; WT + TGF-β vs p75NTR−/− + TGF-β, P = 8.774 ×10⁻¹⁰; p75NTR−/− untreated vs p75NTR−/− + TGF-β, P = 0.054.
References
Publication types
MeSH terms
Substances
Grants and funding
- 8P41GM103412-24/GM/NIGMS NIH HHS/United States
- P41 GM103412/GM/NIGMS NIH HHS/United States
- 5P41RR004050-24/RR/NCRR NIH HHS/United States
- R21 NS082976/NS/NINDS NIH HHS/United States
- T32 AI007334/AI/NIAID NIH HHS/United States
- R21NS082976/NS/NINDS NIH HHS/United States
- AG047313/AG/NIA NIH HHS/United States
- R01NS066361/NS/NINDS NIH HHS/United States
- R01 NS066361/NS/NINDS NIH HHS/United States
- P41 RR004050/RR/NCRR NIH HHS/United States
- R01 NS052189/NS/NINDS NIH HHS/United States
- R01 NS051470/NS/NINDS NIH HHS/United States
- R01 AG047313/AG/NIA NIH HHS/United States
- R01NS052189/NS/NINDS NIH HHS/United States
- R01NS051470/NS/NINDS NIH HHS/United States
LinkOut - more resources
Full Text Sources
Other Literature Sources
Molecular Biology Databases
Research Materials
