

Brain Imaging and Blood Biomarker Abnormalities in Children With Autosomal Dominant Alzheimer Disease: A Cross-Sectional Study
- PMID: 26121081
- PMCID: PMC4625544
- DOI: 10.1001/jamaneurol.2015.1099
Brain Imaging and Blood Biomarker Abnormalities in Children With Autosomal Dominant Alzheimer Disease: A Cross-Sectional Study
Abstract
Importance: Brain imaging and fluid biomarkers are characterized in children at risk for autosomal dominant Alzheimer disease (ADAD).
Objective: To characterize and compare structural magnetic resonance imaging (MRI), resting-state and task-dependent functional MRI, and plasma amyloid-β (Aβ) measurements in presenilin 1 (PSEN1) E280A mutation-carrying and noncarrying children with ADAD.
Design, setting, and participants: Cross-sectional measures of structural and functional MRI and plasma Aβ assays were assessed in 18 PSEN1 E280A carriers and 19 noncarriers aged 9 to 17 years from a Colombian kindred with ADAD. Recruitment and data collection for this study were conducted at the University of Antioquia and the Hospital Pablo Tobon Uribe in Medellín, Colombia, between August 2011 and June 2012.
Main outcomes and measures: All participants had blood sampling, structural MRI, and functional MRI during associative memory encoding and resting-state and cognitive assessments. Outcome measures included plasma Aβ1-42 concentrations and Aβ1-42:Aβ1-40 ratios, memory encoding-dependent activation changes, resting-state connectivity, and regional gray matter volumes. Structural and functional MRI data were compared using automated brain mapping algorithms and search regions related to AD.
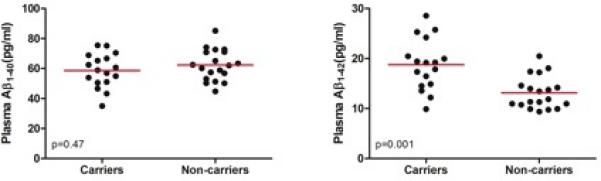
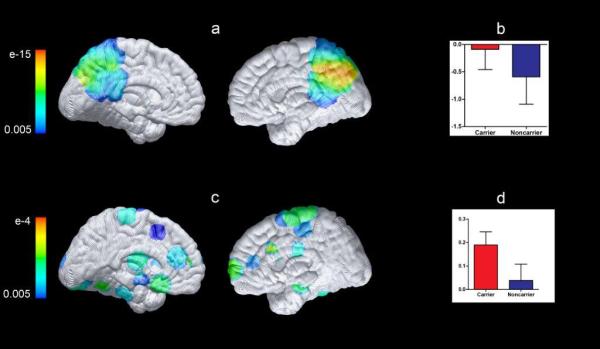
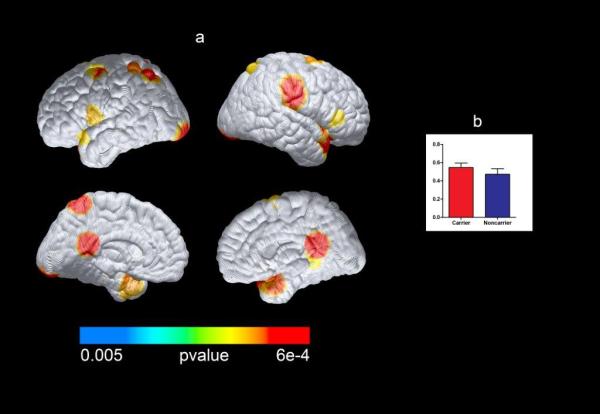
Results: Similar to findings in adult mutation carriers, in the later preclinical and clinical stages of ADAD, mutation-carrying children were distinguished from control individuals by significantly higher plasma Aβ1-42 levels (mean [SD]: carriers, 18.8 [5.1] pg/mL and noncarriers, 13.1 [3.2] pg/mL; P < .001) and Aβ1-42:Aβ1-40 ratios (mean [SD]: carriers, 0.32 [0.06] and noncarriers, 0.21 [0.03]; P < .001), as well as less memory encoding task-related deactivation in parietal regions (eg, mean [SD] parameter estimates for the right precuneus were -0.590 [0.50] for noncarriers and -0.087 [0.38] for carriers; P < .005 uncorrected). Unlike carriers in the later stages, mutation-carrying children demonstrated increased functional connectivity of the posterior cingulate cortex with medial temporal lobe regions (mean [SD] parameter estimates were 0.038 [0.070] for noncarriers and 0.190 [0.057] for carriers), as well as greater gray matter volumes in temporal regions (eg, left parahippocampus; P < . 049, corrected for multiple comparisons).
Conclusions and relevance: Children at genetic risk for ADAD have functional and structural brain changes and abnormal levels of plasma Aβ1-42. The extent to which the underlying brain changes are either neurodegenerative or developmental remains to be determined. This study provides additional information about the earliest known biomarker changes associated with ADAD.
Figures
References
-
- Dubois B, Feldman HH, Jacova C, et al. Revising the definition of Alzheimer's disease: a new lexicon. Lancet neurology. 2010;9:1118–1127. - PubMed
Publication types
MeSH terms
Substances
Grants and funding
- R00 EY021624/EY/NEI NIH HHS/United States
- R01 AG031581/AG/NIA NIH HHS/United States
- P30 AG062421/AG/NIA NIH HHS/United States
- K99 EY021624/EY/NEI NIH HHS/United States
- RF1AG041705/AG/NIA NIH HHS/United States
- DP5OD019833/OD/NIH HHS/United States
- 2UF1 AG032438/AG/NIA NIH HHS/United States
- UF1 AG032438/AG/NIA NIH HHS/United States
- P30 AG19610/AG/NIA NIH HHS/United States
- P30 AG019610/AG/NIA NIH HHS/United States
- K24 AG035007/AG/NIA NIH HHS/United States
- R01 AG055444/AG/NIA NIH HHS/United States
- EY021624/EY/NEI NIH HHS/United States
- P50 AG005134/AG/NIA NIH HHS/United States
- DP5 OD019833/OD/NIH HHS/United States
- RF1 AG041705/AG/NIA NIH HHS/United States
LinkOut - more resources
Full Text Sources
Other Literature Sources
Medical
