. 2015 Jun 29;10(6):e0130379.
doi: 10.1371/journal.pone.0130379. eCollection 2015.

A FOXM1 Dependent Mesenchymal-Epithelial Transition in Retinal Pigment Epithelium Cells

Affiliations

A FOXM1 Dependent Mesenchymal-Epithelial Transition in Retinal Pigment Epithelium Cells

Parul Choudhary et al. PLoS One. .

Abstract

The integrity of the epithelium is maintained by a complex but regulated interplay of processes that allow conversion of a proliferative state into a stably differentiated state. In this study, using human embryonic stem cell (hESC) derived Retinal Pigment Epithelium (RPE) cells as a model; we have investigated the molecular mechanisms that affect attainment of the epithelial phenotype. We demonstrate that RPE undergo a Mesenchymal-Epithelial Transition in culture before acquiring an epithelial phenotype in a FOXM1 dependent manner. We show that FOXM1 directly regulates proliferation of RPE through transcriptional control of cell cycle associated genes. Additionally, FOXM1 modulates expression of the signaling ligands BMP7 and Wnt5B which act reciprocally to enable epithelialization. This data uncovers a novel effect of FOXM1 dependent activities in contributing towards epithelial fate acquisition and furthers our understanding of the molecular regulators of a cell type that is currently being evaluated as a cell therapy.


Conflict of interest statement

Competing Interests: PC, BS, AG, JKD, PJW and CLB are full-time employees of Pfizer Ltd. This does not alter the authors' adherence to PLOS ONE policies on sharing data and materials.

Figures

Fig 1
Fig 1. A Mesenchymal-Epithelial Transition with temporal FOXM1 expression during RPE culture.
A. Immunocytochemistry was performed for CRALBP, ZO1, αSMA and Ki67 at Day 0 (D0), Day 3 (D3) and Day 35 (D35). Arrowheads point towards Ki67 positive nuclei. B. Microarray heatmap of the expression profiles of the top 250 genes, ranked by the significance of their expression changes, over time in culture. Raw expression data are mean centred and scaled to unit variance prior to clustering. A schematic of the scaled expression is shown on the right where individual gene profiles are in light grey and the mean expression profile is shown in black. C. Microarray heatmap showing transcript expression for a panel of representative markers over a timecourse of RPE culture. D. Immunocytochemistry for FOXM1 at Day 2 and Day 14 of RPE culture. Arrowheads point towards FOXM1 positive nuclei. E. Quantification of immunocytochemistry showing percentage of nuclei staining positive for FOXM1 over time. Bars represent Mean ± SD (n = 3). F. Expression of FOXM1 transcript measured using qPCR (relative to housekeeping genes ACTB and GAPDH) in iPSC derived RPE, human foetal RPE and ARPE19 cells over time. Bars represent Mean ± SD (n = 3)
Fig 2
Fig 2. FOXM1 promotes RPE epithelial fate.
A. qPCR based measurement of transcript expression of a panel of epithelial (red) and mesenchymal (green) markers at Day 10 post siFOXM1 transfection (except levels of FOXM1 itself which are measured at Day 2 post knockdown). Data is normalized to transfection with non-targeting siRNA used as a control. ACTB, GAPDH, IPO8 and HPRT1 are used as housekeeping genes. Bars represent Mean + SD (n = 3). P<0.05 (Student’s t-test). B. Immunocytochemistry for PMEL17 upon FOXM1 knockdown (siFOXM1) or overexpression (pFOXM1) at Day 10 post transfection. C. Level of knockdown obtained upon transient transfection of siRNA against SNAI2, SNAI1, ZEB1, TWIST1 and GSC. Knockdown was measured by qPCR at Day 6 post transfection and is expressed relative to non-targeting siRNA used as control. CYC1 and GAPDH were used as housekeeping genes. Bars represent Mean ± SD (n = 6–9). Knockdown of EMT-TF expression was significant, P<0.05 (Student’s t-test). D. No significant effect on PMEL, MITF or BEST1 expression was observed under the same conditions described above for Fig 2C.
Fig 3
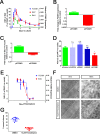
Fig 3. FOXM1 regulates RPE proliferation.
A. Graph showing quantification of immunocytochemistry where % Ki67 (n = 3) or % EdU (n = 6) is plotted on the left Y axis and relative expression of FOXM1 transcript (n = 3; ACTB used as housekeeping gene) on the right Y axis over days in culture (x axis). B. Quantification of change in FOXM1 transcript upon transient overexpression (pFOXM1) or knockdown (siFOXM1), 48h post transfection, measured by qPCR. Data is normalized to appropriate controls (Empty vector for pFOXM1 and non-targeting siRNA for siFOXM1). Bars represent Mean + SD (n = 3). C. Quantification of change in EdU incorporation upon FOXM1 overexpression or knockdown, 72h post transfection. Data is normalized to appropriate controls (Empty vector for pFOXM1 and non-targeting siRNA for siFOXM1). Bars represent Mean + SD (n = 4). P<0.0001 (Student’s t-test). D. Quantification of immunocytochemistry for Ki67 upon siRNA mediated knockdown of non-targeting control, GAPDH, SNAI1, SNAI2 and FOXM1, at Day 6 post transfection. Bars represent Mean + SD (n = 3). n.s non-significant, * p<0.05 Student’s t-test. E. Effect of Thiostrepton on EdU incorporation [left Y axis, red] and FOXM1 transcript expression measured by qPCR [right Y axis, blue]. Bars represent Mean ± SD (n = 6). F. Bright-field microscopy showing a scratch introduced in a RPE monolayer at 0 hrs and 19hrs in the presence of DMSO or 10μM Thiostrepton. Edge of the scratch is marked with a white line. Scale bar = 200 μm. G. Quantification of F (above). Bars represent Mean + SD (n = 7). P<0.0001 (Student’s t-test)
Fig 4
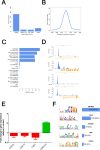
Fig 4. FOXM1 binds to promoters of proliferation associated genes.
A. Percentage of FOXM1 peaks within proximity boundaries to Transcription Start Sites (TSS). B. Plot showing the mean read depth over FOXM1 peaks with a majority of binding within 100bp of peak centres. C. Protein coding genes with a FOXM1 peak within 1kb of TSS are highly enriched for GO categories relevant to cell cycle related functions but not EMT, MET, epithelial or mesenchymal related functions. In addition to the GO category, enrichment was also tested at a published EMT gene signature [55] with no significant binding seen. Enrichment was calculated using a hypergeometric distribution, the—log10 p-value is shown. Dashed line represents p = 0.05. D. Schematic showing FOXM1 binding to the promoters of representative cell cycle genes; CDK12, CDC20, CDC5L & CDKN1A. ChIP-seq coverage is shown in blue and annotated genomic features shown in orange. E. Quantification of change in transcript expression of representative FOXM1 bound genes, measured by qPCR, upon siRNA mediated FOXM1 knockdown (relative to transfection with non-targeting siRNA used as a control), 72h post transfection. ACTB is used as a housekeeping gene. Bars represent Mean + SD (n = 3). P<0.05 (Student’s t-test). F. Significantly enriched transcription factor motifs in FOXM1 peaks alongside frequencies of occurrence.
Fig 5
Fig 5. Epithelial fate acquisition is density dependent.
A. Quantification of change in cell density (number of DAPI positive nuclei per cm2 imaged area) upon FOXM1 overexpression or knockdown, 72h post transfection. Data is normalized to appropriate controls (Empty vector for pFOXM1 and non-targeting siRNA for siFOXM1). Bars represent Mean + SD (n = 4). P<0.0001 (Student’s t-test). B. Heatmap showing changes in gene expression of a panel of representative markers over a timecourse of RPE culture where cells are seeded at high (100000 cells/cm2) or low (8000 cells/cm2) density. C. Plot showing differential expression of BMP7 and Wnt5B transcripts extrapolated from the microarray data. The shaded area represents 95% confidence intervals around the point estimates (circles) of the difference between the mean high density expression vs the mean low density expression.
Fig 6
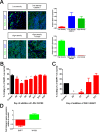
Fig 6. BMP/Wnt signalling is required for MET.
A. Immunocytochemistry for PMEL17 where cells are seeded at either low density (16000 cells/cm2) in the presence or absence of BMP4/7 (top left) or at high density (25000 cells/cm2) in the presence or absence of Wnt5B (bottom left) and cultured for a period of 14 days. Also shown is the expression of BEST1 under the same conditions (top and bottom right). ACTB and B2M are used as housekeeping genes. Bars represent Mean + SD (n = 3). B. Quantification of immunocytochemistry for % CRALBP at Day 21 where cells are either treated with media alone (Control) or media supplemented with 10μM LDN-193189 added at Day 2,4,6,8,11,14 or 18. * indicates significant difference between control and compound treatment (One way ANOVA with Dunnett’s multiple comparisons). C. Quantification of immunocytochemistry for % CRALBP at Day 28 where cells are either treated with media alone (Control) or media supplemented with 10μM WAY-262611 added at Day 2,7,14 or 21. * indicates significant difference between control and compound treatment (One way ANOVA with Dunnett’s multiple comparisons). D. qPCR based measurement of BMP7 and Wnt5B transcript expression at Day 10 post siFOXM1 transfection (relative to transfection with non-targeting siRNA used as a control). GAPDH, HPRT1 and IPO8 were used as housekeeping genes. Bars represent Mean + SD (n = 3). P<0.05 (Student’s t-test).
Fig 7
Fig 7. Model showing proposed roles of FOXM1 in epithelial fate acquisition.
RPE first acquire a mesenchymal morphology upon dissociation and culture followed by proliferation and mesenchymal-epithelial transition to re-uptake an epithelial phenotype. Proliferation of RPE is directly regulated by FOXM1 which also affects expression of BMP7 and Wnt5B by an unknown mechanism. Both these activities are required for successful MET and epithelialization.

References

    1. Strauss O (2005) The retinal pigment epithelium in visual function. Physiol Rev 85: 845–881. - PubMed
    1. da Cruz L, Chen FK, Ahmado A, Greenwood J, Coffey P (2007) RPE transplantation and its role in retinal disease. Prog Retin Eye Res 26: 598–635. - PubMed
    1. Buchholz DE, Hikita ST, Rowland TJ, Friedrich AM, Hinman CR, et al. (2009) Derivation of functional retinal pigmented epithelium from induced pluripotent stem cells. Stem Cells 27: 2427–2434. 10.1002/stem.189 - DOI - PubMed
    1. Kawasaki H, Suemori H, Mizuseki K, Watanabe K, Urano F, et al. (2002) Generation of dopaminergic neurons and pigmented epithelia from primate ES cells by stromal cell-derived inducing activity. Proc Natl Acad Sci U S A 99: 1580–1585. - PMC - PubMed
    1. Okamoto S, Takahashi M (2011) Induction of retinal pigment epithelial cells from monkey iPS cells. Invest Ophthalmol Vis Sci 52: 8785–8790. 10.1167/iovs.11-8129 - DOI - PubMed

MeSH terms

LinkOut - more resources