Longitudinal Associations Between Neighborhood Physical and Social Environments and Incident Type 2 Diabetes Mellitus: The Multi-Ethnic Study of Atherosclerosis (MESA)
- PMID: 26121402
- PMCID: PMC4799846
- DOI: 10.1001/jamainternmed.2015.2691
Longitudinal Associations Between Neighborhood Physical and Social Environments and Incident Type 2 Diabetes Mellitus: The Multi-Ethnic Study of Atherosclerosis (MESA)
Abstract
Importance: Neighborhood environments may influence the risk for developing type 2 diabetes mellitus (T2DM), but, to our knowledge, no longitudinal study has evaluated specific neighborhood exposures.
Objective: To determine whether long-term exposures to neighborhood physical and social environments, including the availability of healthy food and physical activity resources and levels of social cohesion and safety, are associated with incident T2DM during a 10-year period.
Design, setting, and participants: We used data from the Multi-Ethnic Study of Atherosclerosis, a population-based cohort study of adults aged 45 to 84 years at baseline (July 17, 2000, through August 29, 2002). A total of 5124 participants free of T2DM at baseline underwent 5 clinical follow-up examinations from July 17, 2000, through February 4, 2012. Time-varying measurements of neighborhood healthy food and physical activity resources and social environments were linked to individual participant addresses. Neighborhood environments were measured using geographic information system (GIS)- and survey-based methods and combined into a summary score. We estimated hazard ratios (HRs) of incident T2DM associated with cumulative exposure to neighborhood resources using Cox proportional hazards regression models adjusted for age, sex, income, educational level, race/ethnicity, alcohol use, and cigarette smoking. Data were analyzed from December 15, 2013, through September 22, 2014.
Main outcomes and measures: Incident T2DM defined as a fasting glucose level of at least 126 mg/dL or use of insulin or oral antihyperglycemics.
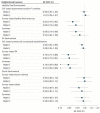
Results: During a median follow-up of 8.9 years (37,394 person-years), 616 of 5124 participants (12.0%) developed T2DM (crude incidence rate, 16.47 [95% CI, 15.22-17.83] per 1000 person-years). In adjusted models, a lower risk for developing T2DM was associated with greater cumulative exposure to indicators of neighborhood healthy food (12%; HR per interquartile range [IQR] increase in summary score, 0.88 [95% CI, 0.79-0.98]) and physical activity resources (21%; HR per IQR increase in summary score, 0.79 [95% CI, 0.71-0.88]), with associations driven primarily by the survey exposure measures. Neighborhood social environment was not associated with incident T2DM (HR per IQR increase in summary score, 0.96 [95% CI, 0.88-1.07]).
Conclusions and relevance: Long-term exposure to residential environments with greater resources to support physical activity and, to a lesser extent, healthy diets was associated with a lower incidence of T2DM, although results varied by measurement method. Modifying neighborhood environments may represent a complementary, population-based approach to prevention of T2DM, although further intervention studies are needed.
Figures

Comment in
-
Risk for Type 2 Diabetes Mellitus: Person, Place, and Precision Prevention.JAMA Intern Med. 2015 Aug;175(8):1321-2. doi: 10.1001/jamainternmed.2015.2701. JAMA Intern Med. 2015. PMID: 26120971 No abstract available.
-
Neighborhoods and Risk of Diabetes Mellitus: Person and Place or Person in Place?JAMA Intern Med. 2015 Dec;175(12):2002. doi: 10.1001/jamainternmed.2015.6686. JAMA Intern Med. 2015. PMID: 26641364 Free PMC article. No abstract available.
-
Neighborhoods and Risk of Diabetes Mellitus--Reply: Person and Place or Person in Place?JAMA Intern Med. 2015 Dec;175(12):2002-3. doi: 10.1001/jamainternmed.2015.6689. JAMA Intern Med. 2015. PMID: 26641365 No abstract available.
References
-
- Danaei G, Finucane MM, Lu Y, et al. Global Burden of Metabolic Risk Factors of Chronic Diseases Collaborating Group (Blood Glucose) National, regional, and global trends in fasting plasma glucose and diabetes prevalence since 1980: systematic analysis of health examination surveys and epidemiological studies with 370 country-years and 2.7 million participants. Lancet. 2011;378(9785):31–40. - PubMed
-
- Hu FB, Manson JE, Stampfer MJ, et al. Diet, lifestyle, and the risk of type 2 diabetes mellitus in women. N Engl J Med. 2001;345(11):790–797. - PubMed
-
- Mokdad AH, Bowman BA, Ford ES, Vinicor F, Marks JS, Koplan JP. The continuing epidemics of obesity and diabetes in the United States. JAMA. 2001;286(10):1195–1200. - PubMed
Publication types
MeSH terms
Grants and funding
- N01-HC-95162/HC/NHLBI NIH HHS/United States
- R01 HL071759/HL/NHLBI NIH HHS/United States
- N01 HC095169/HL/NHLBI NIH HHS/United States
- UL1-RR-024156/RR/NCRR NIH HHS/United States
- N01-HC-95159/HC/NHLBI NIH HHS/United States
- N01 HC095159/HL/NHLBI NIH HHS/United States
- N01-HC-95160/HC/NHLBI NIH HHS/United States
- N01 HC095165/HC/NHLBI NIH HHS/United States
- N01-HC-95161/HC/NHLBI NIH HHS/United States
- N01-HC-95166/HC/NHLBI NIH HHS/United States
- UL1 RR025005/RR/NCRR NIH HHS/United States
- UL1-RR-025005/RR/NCRR NIH HHS/United States
- N01-HC-95163/HC/NHLBI NIH HHS/United States
- N01-HC-95168/HC/NHLBI NIH HHS/United States
- UL1 RR024156/RR/NCRR NIH HHS/United States
- N01 HC095164/HC/NHLBI NIH HHS/United States
- N01 HC095166/HC/NHLBI NIH HHS/United States
- N01-HC-95165/HC/NHLBI NIH HHS/United States
- N01-HC-95169/HC/NHLBI NIH HHS/United States
- N01-HC-95164/HC/NHLBI NIH HHS/United States
- N01 HC095159/HC/NHLBI NIH HHS/United States
- N01-HC-95167/HC/NHLBI NIH HHS/United States
LinkOut - more resources
Full Text Sources
Other Literature Sources
Medical

