. 2015;15(4):436-46.
doi: 10.2174/1566523215666150630121557.

A Simple High Efficiency Intra-Islet Transduction Protocol Using Lentiviral Vectors

Affiliations

A Simple High Efficiency Intra-Islet Transduction Protocol Using Lentiviral Vectors

Carmen Maria Jimenez-Moreno et al. Curr Gene Ther. 2015.

Abstract

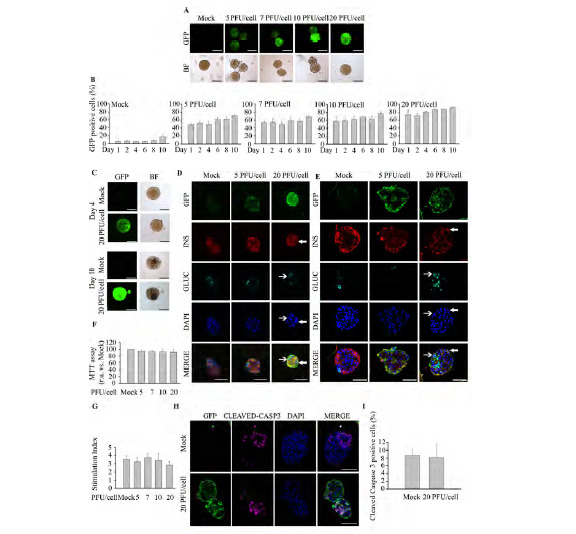
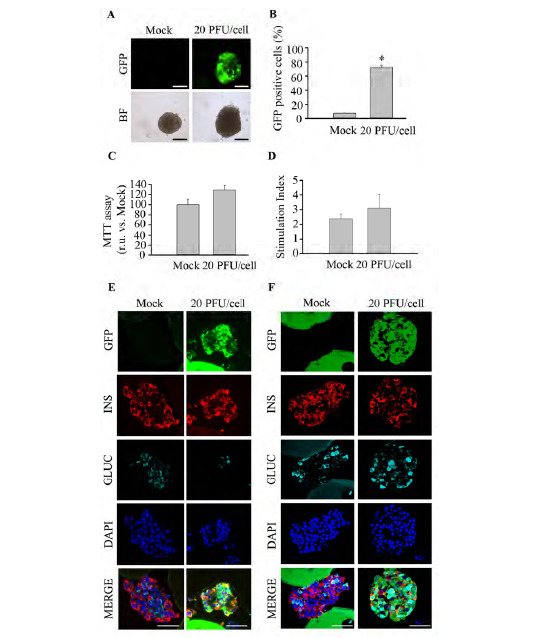
Successful normalization of blood glucose in patients transplanted with pancreatic islets isolated from cadaveric donors established the proof-of-concept that Type 1 Diabetes Mellitus is a curable disease. Nonetheless, major caveats to the widespread use of this cell therapy approach have been the shortage of islets combined with the low viability and functional rates subsequent to transplantation. Gene therapy targeted to enhance survival and performance prior to transplantation could offer a feasible approach to circumvent these issues and sustain a durable functional β-cell mass in vivo. However, efficient and safe delivery of nucleic acids to intact islet remains a challenging task. Here we describe a simple and easy-to-use lentiviral transduction protocol that allows the transduction of approximately 80 % of mouse and human islet cells while preserving islet architecture, metabolic function and glucose-dependent stimulation of insulin secretion. Our protocol will facilitate to fully determine the potential of gene expression modulation of therapeutically promising targets in entire pancreatic islets for xenotransplantation purposes.


Figures

Box. (1)
Box. (1)
Fig. (1)
Fig. (1)
Optimized protocol for lentiviral-mediated islet infection. Summarized scheme of the transduction protocol described in Box 1.
Fig. (2)
Fig. (2)
High pHRSIN DUAL-GFP PFU/cell levels compromise islet viability with sub-optimal islet transduction efficiency. Freshly isolated murine islets were exposed to increasing PFU/cell of pHRSIN DUAL-GFP. Non-transduced islets (Mock) were used as control. (A) Representative images of ex vivo cultured entire live transduced islets. Top; GFP expression was assessed by fluorescence acquisition using an ImageXpress Microsystem. Low; Bright field images. Images were captured at 4 days post-infection. Arrows indicate necrotic areas. Scale-bars indicate 100 µm. n=4 experiments per condition. (B) Transduction efficiency, defined as the percentage of islet cells expressing GFP, was determined by flow cytometry in disaggregated islets at 4 days post-infection. n=6 per condition. (C) Determination of islet metabolic activity using the MTT assay at 4 days post-infection n=4-6 per condition. (D-E) Representative immunofluorescence images of Affi-Gel bead-embedded pancreatic islets 4 days post-infection. Antibodies against GFP (green), insulin (red) and glucagon (cyan) were employed. Of note, in some instances the Affi-Gel beads, emitted a non specific fluorescent signal along with GFP (Green) and insulin (red). (D) Wide-field fluorescence microscopy. (E) Confocal microscopy. Scale-bars, 50 µm. n=3 per condition. Data are represented as the mean ± SEM. * p< 0.05 versus control non-transduced islets.
Fig. (3)
Fig. (3)
A Mild Trypsin-EDTA treatment increases transduction efficiency in murine islets. Freshly isolated murine islets were treated or not with two concentrations of trypsin-EDTA prior transduction or not with pHRSIN DUAL-GFP. (A) Representative images of live islets exhibiting GFP fluorescence subsequent to treatment: Top; GFP expression was assessed by fluorescence acquisition using an ImageXpress Microsystem. Low; Bright field images. Images were captured at 4 days post-infection. Arrows indicate necrotic areas. Scale-bars 100 µm. n=4 experiments per condition. (B) Transduction efficiency in trypsin-EDTA treated islets was determined by flow cytometry in disaggregated islets at 4 days post-infection. n=3-8 per condition. (C) Determination of islet metabolic activity using the MTT assay 4 days post-infection. n=4 per condition. (D) Representative confocal immunofluorescence images of Affi-Gel bead-embedded pancreatic islets 4 days post-infection with or without 0.5X trypsin-EDTA treatment. Antibodies against GFP (green), insulin (red) and glucagon (cyan) were employed. Of note, in some instances the Affi-Gel beads, emitted a non specific fluorescent signal along with GFP (green). Scale-bars, 50 µm. n=3 per condition. 0 X: Untreated; 0.5 X: 0.5 X trypsin-EDTA treatment (250 mg/l trypsin; 0.48 mM EDTA); 1 X: 1 X trypsin-EDTA treatment (500 mg/l; 0.96 mM EDTA). Data are represented as the mean ± SEM. * p < 0.05 versus control non-transduced trypsin-EDTA untreated islets.
Fig. (4)
Fig. (4)
Mild trypsinization combined with 20 PFU/cell represents the optimal infection protocol for murine islets. Freshly isolated murine islets were treated with 0.5 X trypsin-EDTA (250 mg/l; 0.48 mM EDTA) and subsequently exposed to increasing PFU/cell of pHRSIN DUAL-GFP. (A) Representative images of GFP fluorescence emitted from live islets: Top; GFP expression was assessed by fluorescence acquisition using an ImageXpress Microsystem. Low; Bright field images. Images were captured at 4 days post-infection. Scale-bars 100 µm. n=4 experiments per condition. (B) Transduction efficiency in 0.5 X trypsin-EDTA treated islets at different days after transduction was determined by flow cytometry in dispersed islets. n=4 per condition. (C) Representative images of live islets exhibiting GFP fluorescence 4 and 10 days post-treatment: Top; GFP expression was assessed by fluorescence acquisition using an ImageXpress Microsystem. Low; Bright field images. Scale-bars 100 µm. n=4 experiments per condition. (D-E) Representative immunofluorescence images of Affi-Gel bead-embedded pancreatic islets trypsin-treated and transduced or not with pHRSIN DUAL-GFP. Antibodies against GFP (green), insulin (red) and glucagon (cyan) were employed. Images were captured in samples fixed at 4 days post-infection using either wide-field fluorescence microscopy (D) or confocal microscopy (E). Of note, in some instances the Affi-Gel beads, emitted a non specific fluorescent signal along with GFP (green) and insulin (red). Filled arrows indicate transduced cells expressing insulin; Non-filled arrows indicate transduced cells expressing glucagon. Scale-bars 50 µm. n=3 per condition. (F) Determination of islet metabolic activity subsequent to a 0.5 X trypsin-EDTA treatment followed by transduction with 20 PFU/cell. A MTT assay was performed 4 days post-infection. n=3-4 per condition. (G) Glucose-stimulated insulin secretion was assessed in islet treated with 0.5 X trypsin-EDTA followed by transduction with increasing amount of pHRSIN DUAL-GFP. (H) Representative immunofluorescence images of Affi-Gel bead-embedded pancreatic islets 0.5X trypsin-treated and transduced or not with pHRSIN DUAL-GFP. Antibodies against GFP (green) and cleaved Caspase 3 (magenta). Images were captured in samples fixed at 4 days post-infection using confocal fluorescence microscopy. n=3 per condition. (I) Determination of apoptosis rate by quantification of cleaved caspase 3 positive cells in islets 0.5X trypsin-EDTA-treated and transduced or not with pHRSIN DUAL-GFP. n=3 per condition. Data are represented as the mean ± SEM of n=3. * p < 0.05 versus control non-transduced 0.5 X trypsin-EDTA treated islets.
Fig. (5)
Fig. (5)
Human islets are efficiently transduced using the optimized protocol. Human islets obtained from cadaveric donors were initially treated with 0.5 X trypsin-EDTA (250 mg/l trypsin; 0.48 mM EDTA) and then transduced with pHRSIN DUAL-GFP at 20 PFU/cell. (A) Live imaging reveals GFP expression in human islets 4 days post-infection: Top; GFP expression, assessed by fluorescence acquisition using an ImageXpress Microsystem, Bottom; Bright field images. Scale-bars 100 µm. n=3 per condition. (B) Transduction efficiency in 0.5 X trypsin-EDTA treated islets was determined by flow cytometry of dispersed islets at 4 days post-transduction with 20 PFU/cell. n=3 per condition. (C) Islet metabolic activity was assessed using the MTT assay. n=3 per condition. (D) Glucose-stimulated insulin secretion was assessed in either control islets or islet treated with 0.5 X trypsin-EDTA followed by transduction with 20 PFU/cell of pHRSIN DUAL-GFP. n=3 per condition. (E-F) Co-immunostaining of GFP (green), insulin (red) and glucagon (cyan) was performed on sections from Affi-Gel bead-embedded human pancreatic islets subsequent to treatment. Images were captured in samples fixed at 4 days post-infection using wide-field fluorescence microscopy (E) or confocal microscopy (F). Scale-bars 50µm. n=3 per condition. Data are represented as the mean ± SEM. * p < 0.05 versus control non-transduced 0.5 X trypsin-EDTA treated islets.

References

    1. Atlas I. IDF Atlas. vol. March12th 2014: http://www.idf.org/diabetesatlas. 2014.
    1. Lipman T.H., Levitt Katz L.E., Ratcliffe S.J., Murphy K.M., Aguilar A., Rezvani I., Howe C.J., Fadia S., Suarez E. Increasing incidence of type 1 diabetes in youth: twenty years of the Philadelphia Pediatric Diabetes Registry. Diabetes Care. 2013;36(6):1597–1603. doi: 10.2337/dc12-0767. - DOI - PMC - PubMed
    1. Tisch R., Wang B. Dysrulation of T cell peripheral tolerance in type 1 diabetes. Adv. Immunol. 2008;100:125–149. doi: 10.1016/S0065-2776(08)00805-5. - DOI - PubMed
    1. Redondo M.J., Eisenbarth G.S. Genetic control of autoimmunity in Type I diabetes and associated disorders. Diabetologia. 2002;45(5):605–622. doi: 10.1007/s00125-002-0781-1. - DOI - PubMed
    1. Roglic G., Unwin N. Mortality attributable to diabetes: estimates for the year 2010. Diabetes Res. Clin. Pract. 2010;87(1):15–19. doi: 10.1016/j.diabres.2009.10.006. - DOI - PubMed

Publication types