. 2015 Sep;1852(9):2000-12.
doi: 10.1016/j.bbadis.2015.06.020. Epub 2015 Jun 27.

Osteogenic changes in kidneys of hyperoxaluric rats

Affiliations

Osteogenic changes in kidneys of hyperoxaluric rats

Sunil Joshi et al. Biochim Biophys Acta. 2015 Sep.

Abstract

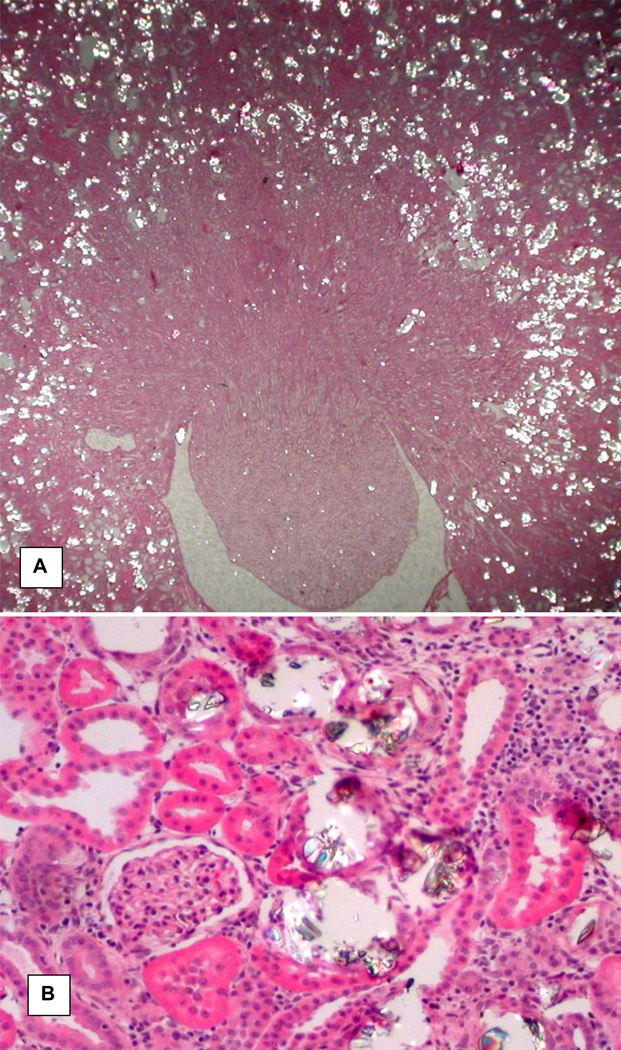
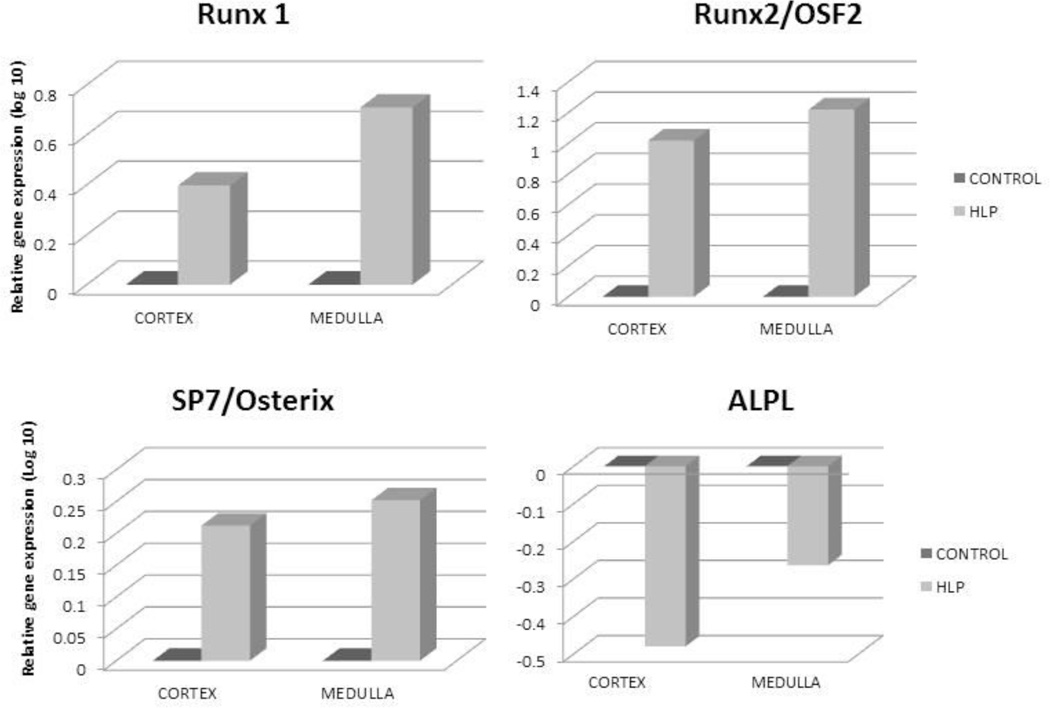
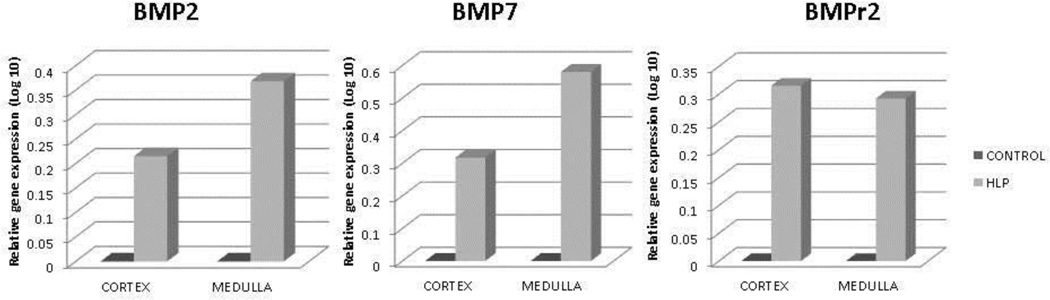
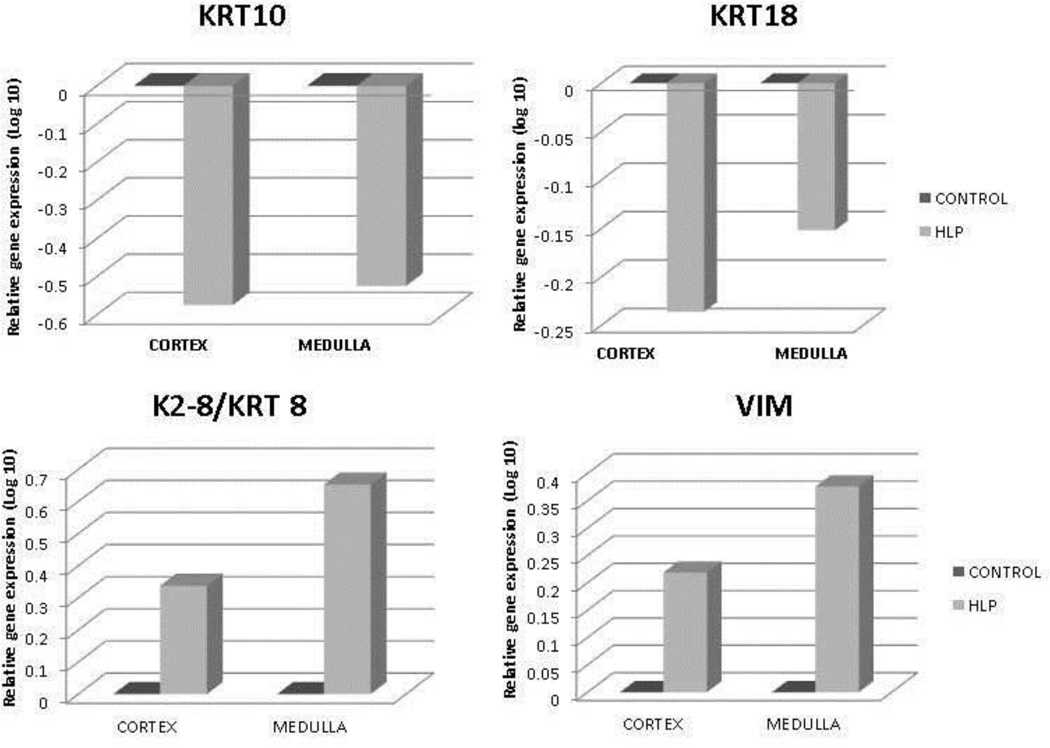
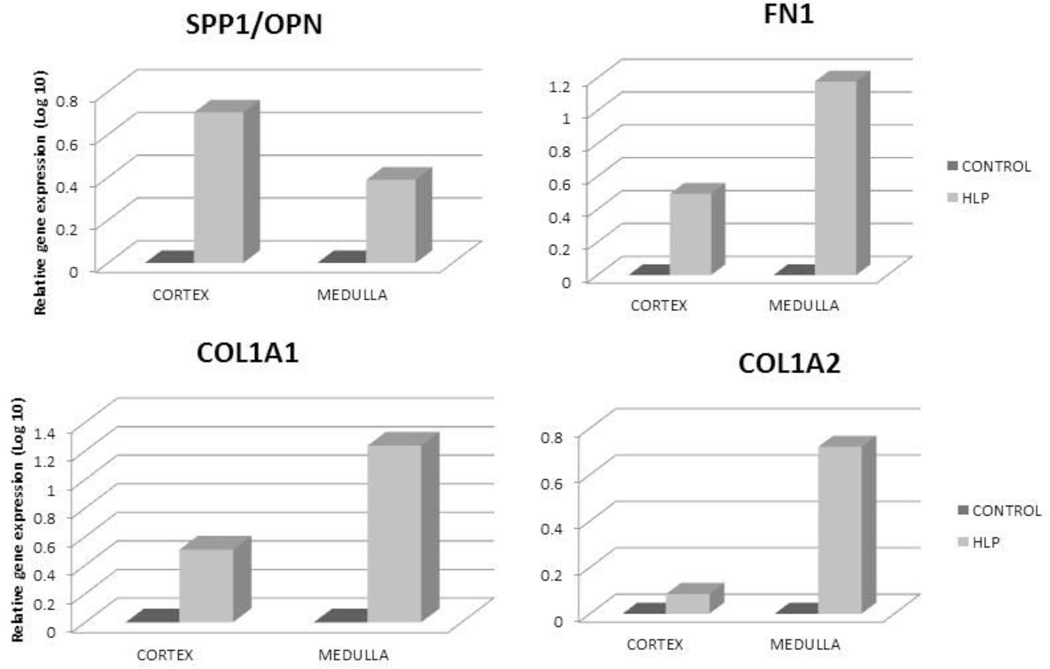
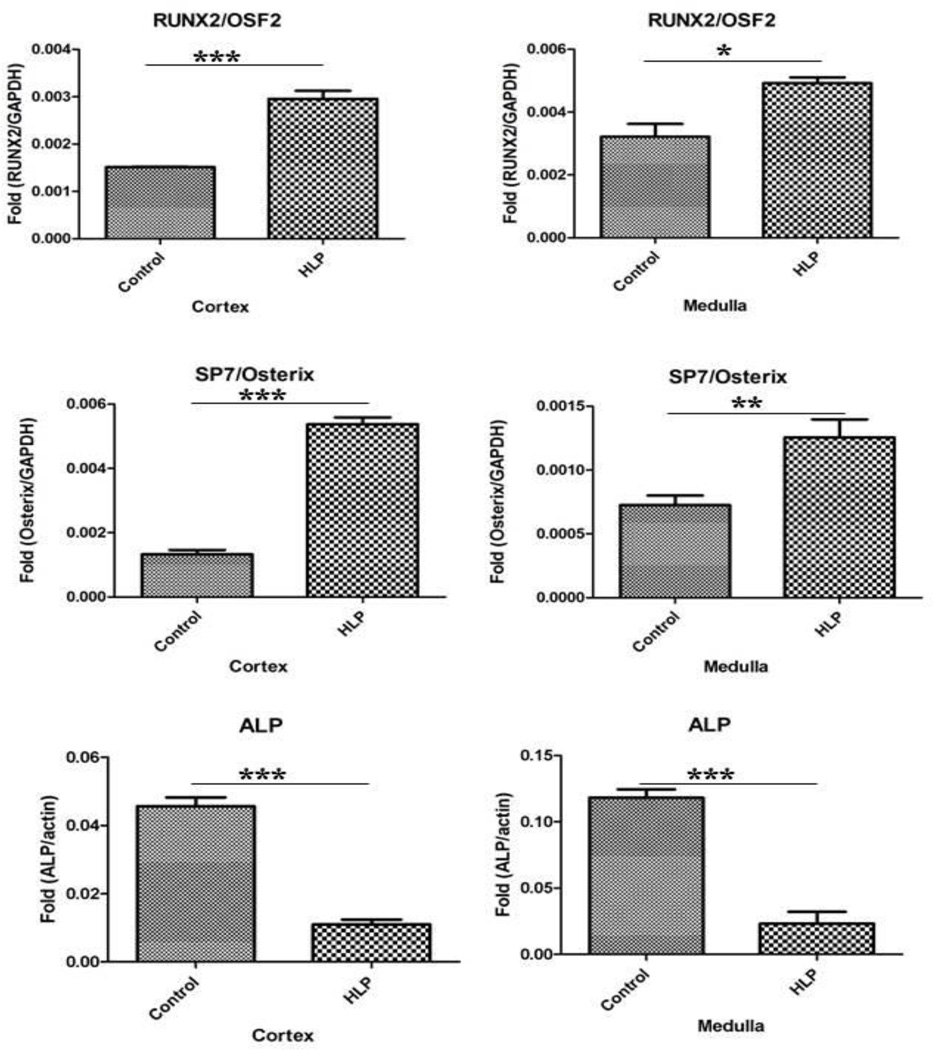
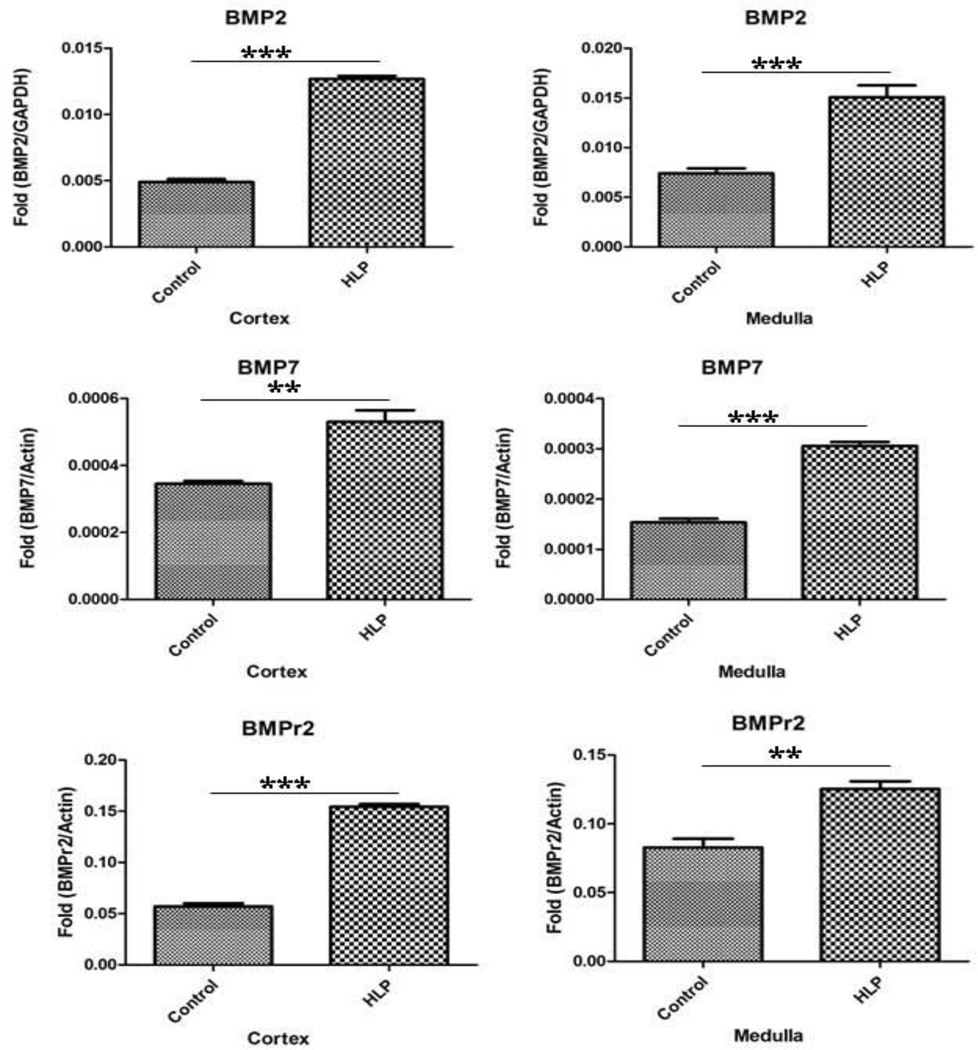
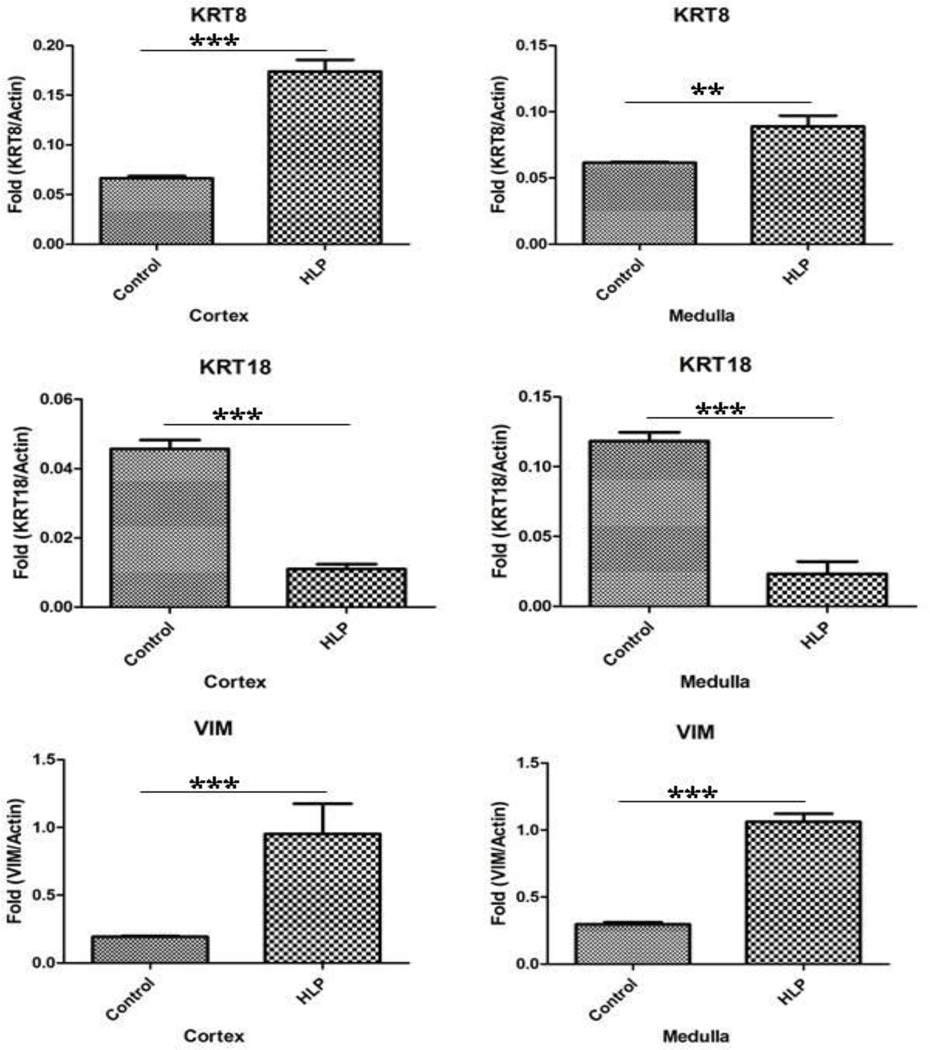
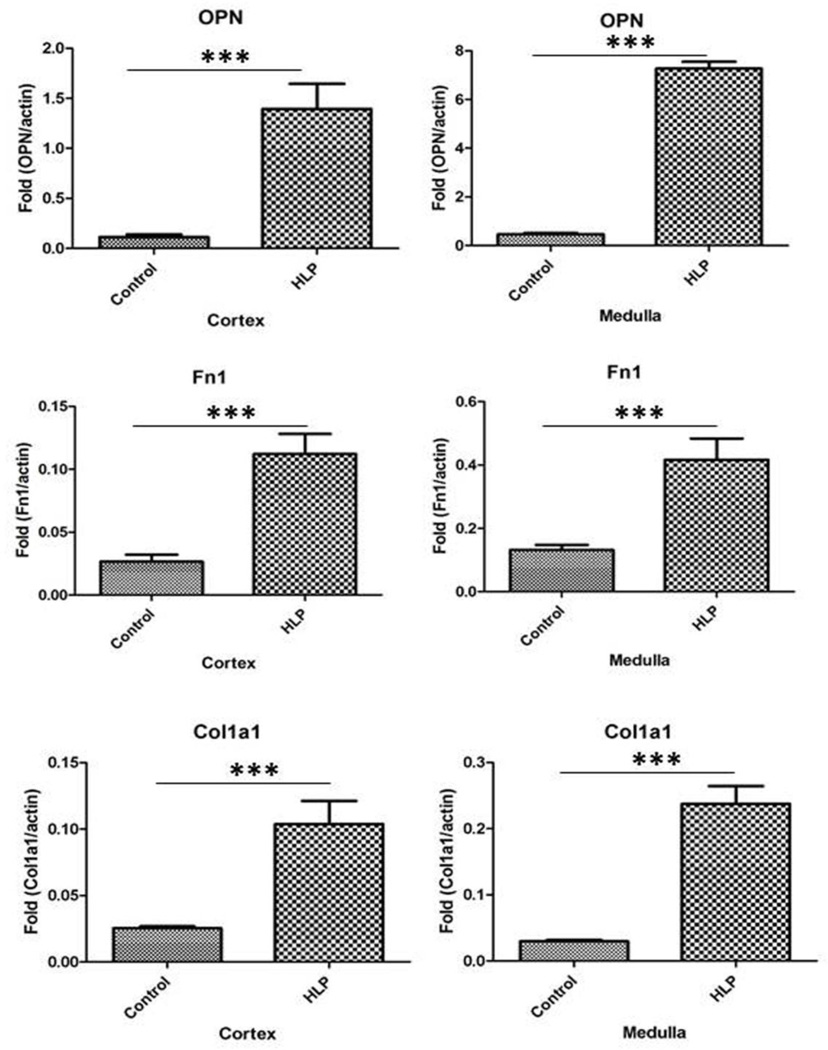
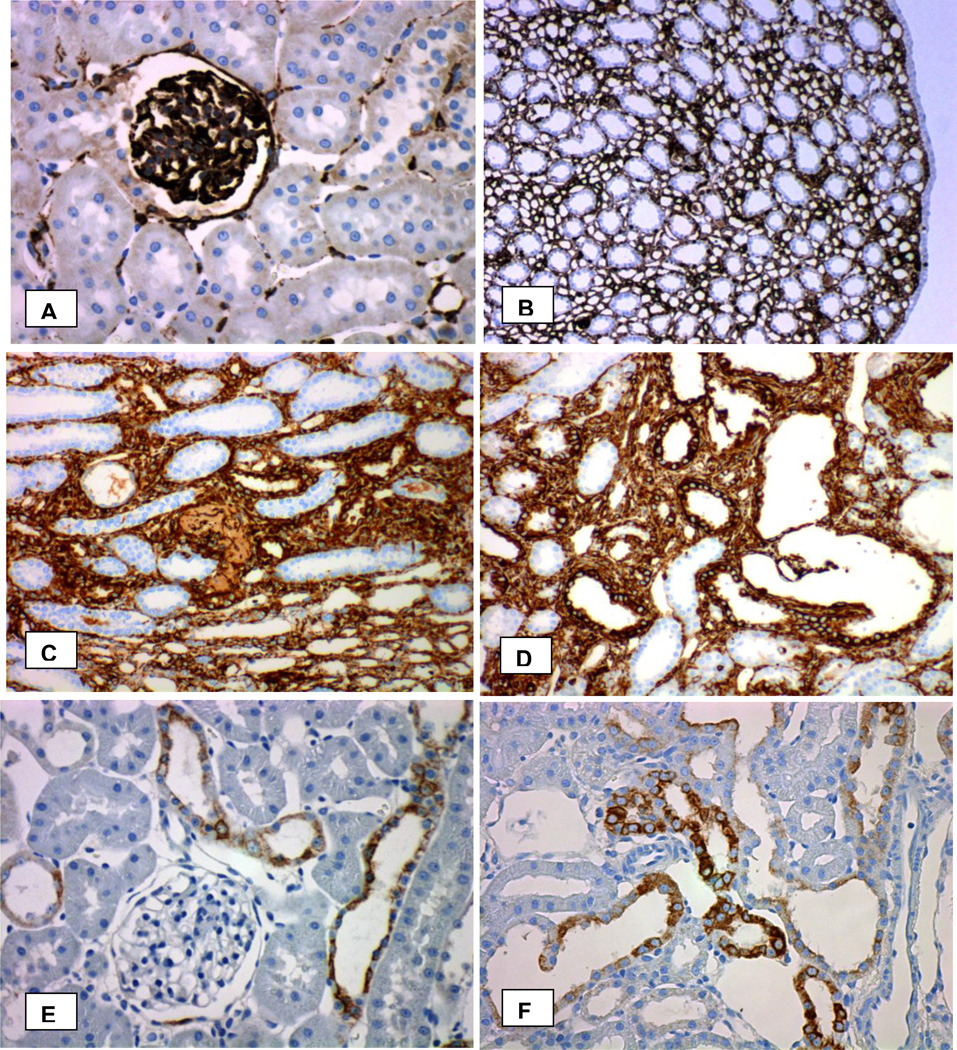
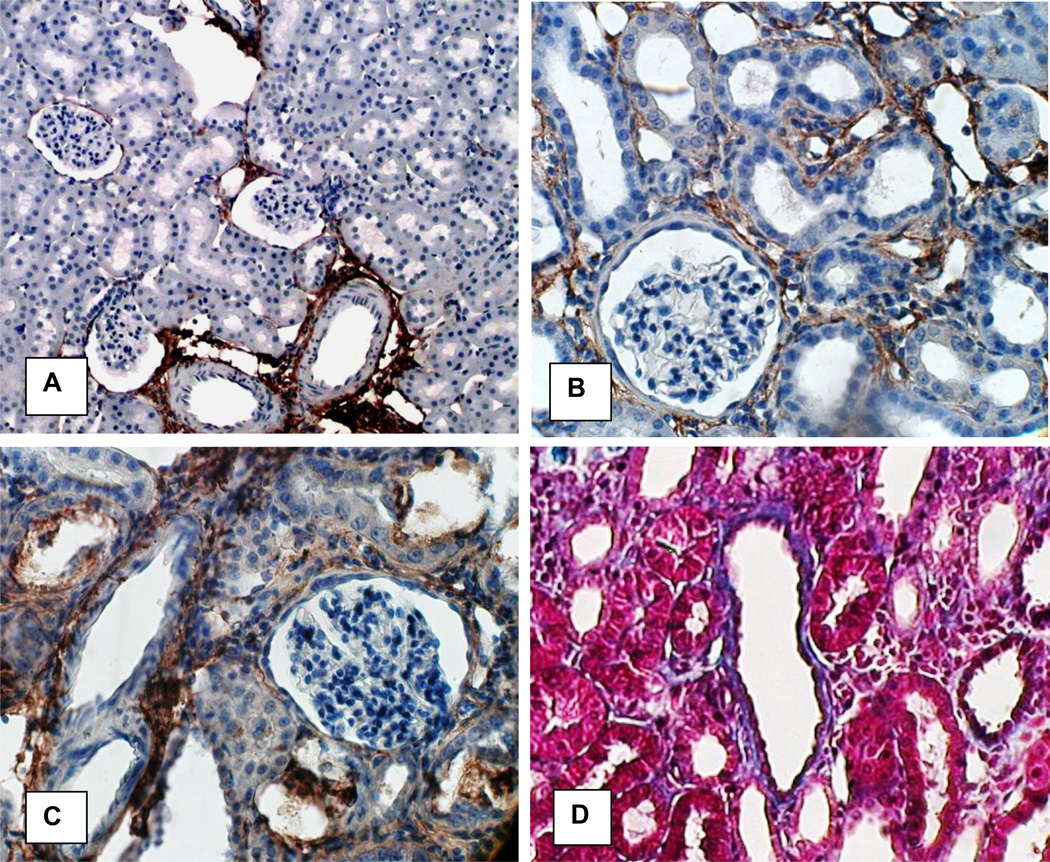
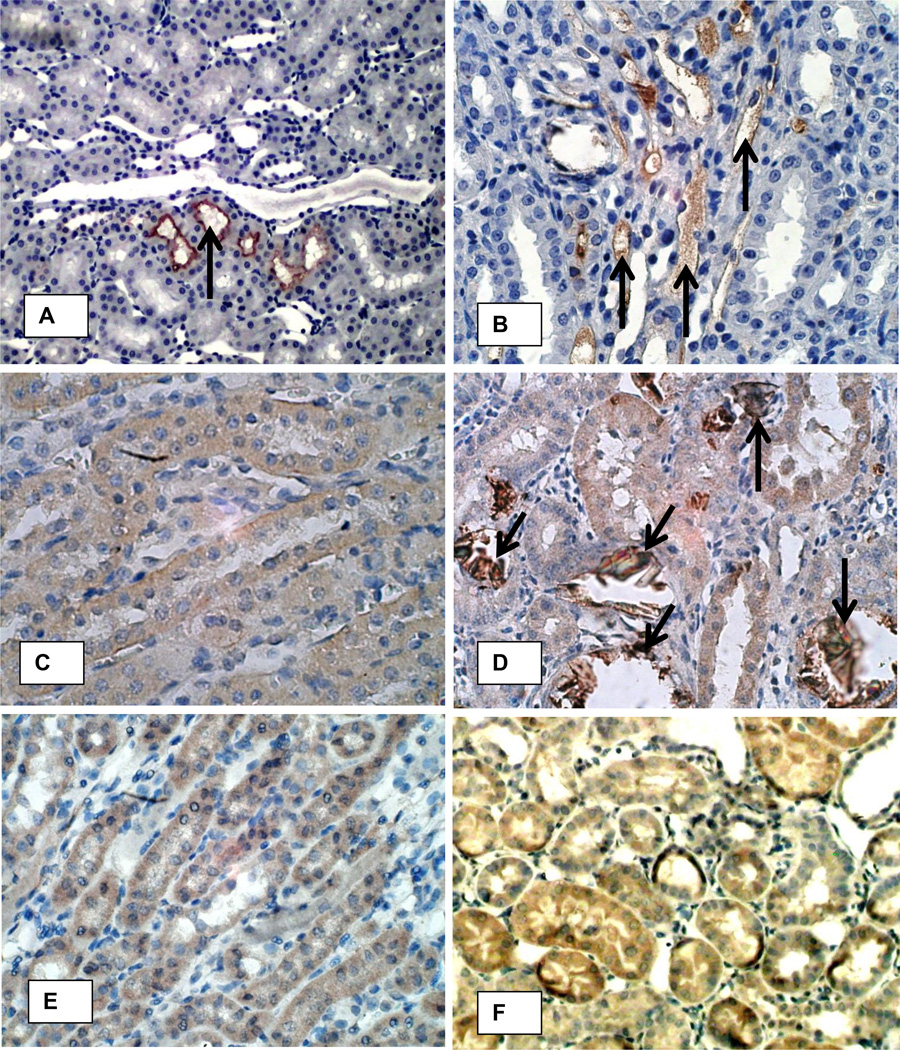
Many calcium oxalate (CaOx) kidney stones develop attached to renal papillary sub-epithelial deposits of calcium phosphate (CaP), called Randall's plaque (RP). Pathogenesis of the plaques is not fully understood. We hypothesize that abnormal urinary environment in stone forming kidneys leads to epithelial cells losing their identity and becoming osteogenic. To test our hypothesis male rats were made hyperoxaluric by administration of hydroxy-l-proline (HLP). After 28days, rat kidneys were extracted. We performed genome wide analyses of differentially expressed genes and determined changes consistent with dedifferentiation of epithelial cells into osteogenic phenotype. Selected molecules were further analyzed using quantitative-PCR and immunohistochemistry. Genes for runt related transcription factors (RUNX1 and 2), zinc finger protein Osterix, bone morphogenetic proteins (BMP2 and 7), bone morphogenetic protein receptor (BMPR2), collagen, osteocalcin, osteonectin, osteopontin (OPN), matrix-gla-protein (MGP), osteoprotegrin (OPG), cadherins, fibronectin (FN) and vimentin (VIM) were upregulated while those for alkaline phosphatase (ALP) and cytokeratins 10 and 18 were downregulated. In conclusion, epithelial cells of hyperoxaluric kidneys acquire a number of osteoblastic features but without CaP deposition, perhaps a result of downregulation of ALP and upregulation of OPN and MGP. Plaque formation may additionally require localized increases in calcium and phosphate and decrease in mineralization inhibitory potential.

Keywords: Bone morphogenetic protein; Hyperoxaluria; Matrix-gla-protein; Randall's plaque; Runt related transcription factor; Vimentin.


Conflict of interest statement

Conflict of Interest

The authors have declared that there is no conflict of interest.

Figures

Figure 1
Figure 1
H&A stained section of a kidney from hyperoxaluric rat on 28th day of feeding on hydroxyl-L-proline (HLP). A. Low mag image showing both cortical and medullary segments of the kidney. Calcium oxalate (CaOx) crystal deposits appear as bright spots and most of them are located in the cortical renal tubules. Original ×2.5. B. High magnification image showing a glomerulus and tubules with and without CaOx crystals. Glomerulus and tubules without the crystals appear normal. Tubules with crystals are dilated with many fold increase in their luminal diameter and compressed lining epithelia. Renal interstitium shows signs of inflammation. Original ×45.
Figure 2
Figure 2
Relative gene expression in the cortex and medulla of kidneys of control and HLP-fed rats. Gene expression of runt related transcription factor-1 and 2 (RUNX1 and RUNX2), and zinc finger protein Osterix/SP7was up regulated in the HLP-fed rats. Genes for alkaline phosphatase were downregulated in both cortex and medulla of the HLP-fed rats.
Figure 3
Figure 3
Relative gene expression in the cortex and medulla of kidneys of control and HLP-fed rats. Gene expression of bone morphogenetic proteins 2 and 7 (BMP2 and BMP7), and bone morphogenetic protein receptor, Type 2 (BMPR2) were up regulated in the HLP- fed rats.
Figure 4
Figure 4
Relative gene expression of cytokeratin 10 (KRT 10), cytokeratin 18 (KRT 18), cytokeratin 8 (KRT 8) and Vimentin (VIM) in the cortex and medulla of HLP treated rats. KRT10 and KRT18 gene expression was down regulated whereas KRT 8 and VIM were up regulated.
Figure 5
Figure 5
Relative gene expression of OPN, Fibronectin (FN1), COL1A1 and COL1A2 in the cortex and medulla of HLP treated rats. Gene expressions were up regulated.
Figure 6
Figure 6
Real Time PCR of runt related transcription factor-2 (RUNX2), zinc finger protein Osterix/SP7 and ALP in the cortex and medulla of the control and HLP fed rats. The statistical analyses were performed using GraphPad Prism version 5 for windows (GraphPad software, La Jolla, CA). P-values were calculated using unpaired T-test. P < 0.05 was considered statistically significant. *Control vs. HLP group (P < 0.05), **Control vs. HLP group (P < 0.005), ***Control vs. HLP group (P < 0.0001).
Figure 7
Figure 7
Real Time PCR of bone morphogenetic proteins 2 (BMP2), bone morphogenetic proteins 7 (BMP7), and bone morphogenetic protein receptor, Type 2 (BMPR2) in the cortex and medulla of the control and HLP fed rats. The statistical analyses were performed using GraphPad Prism version 5 for windows (GraphPad software, La Jolla, CA). P-values were calculated using unpaired T-test. P < 0.05 was considered statistically significant. *Control vs. HLP group (P < 0.05), **Control vs. HLP group (P < 0.005), ***Control vs. HLP group (P < 0.0001).
Figure 8
Figure 8
Real Time PCR of cytokeratin 8 (KRT8), cytokeratin 18 (KRT18), and Vimentin (VIM) in the cortex and medulla of the control and HLP fed rats. The statistical analyses were performed using GraphPad Prism version 5 for windows (GraphPad software, La Jolla, CA). P-values were calculated using unpaired T-test. P < 0.05 was considered statistically significant. *Control vs. HLP group (P < 0.05), **Control vs. HLP group (P < 0.005), ***Control vs. HLP group (P < 0.0001).
Figure 9
Figure 9
Real time PCR of OPN, Fn1, Col 1a1 and Col 1a2 showing increase in their expressions.
Figure 10
Figure 10
Immunohistochemical analyses of the kidneys for vimentin and cytokeratin. A. Normal kidney cortex showing vimentin staining in the glomerulus and peritubular capillaries. B. Normal kidney papilla showing vimentin staining in the peritubular capillaries. C, D. Strong staining is seen for vimentin in the epithelial cells of the tubules with CaOx crystal deposits as well as the surrounding renal interstitium. E. Stainining with pancytokeratin antibody in normal kidney cortex. F. Stainining with pancytokeratin antibody in cortex of a kidney from HLP-fed rats. Original Mag ×45.
Figure 11
Figure 11
Immunohistochemical analyses of the kidneys of control and HLP-fed rats for collagen. A In normal Collagen 1 expression is mostly limited to areas around large and small blood vessels. Original Mag ×10. B. C. In hyperoxaluric kidneys Collagen 1 expression is interstitial and more intense around tubules with CaOx crysral deposits. Crystals have been lost during the processing. D. Collagen stained blue with Mason’s trichrome. There is strong staining around the tubules with CaOx crystal deposits. Epithelial cells of the tubules without crystals stained red. Original Mag ×45.
Figure 12
Figure 12
Immunohistochemical analyses of the kidneys of control (A, C, E) and HLP-fed rats (B, D, F) for MGP, OPN and fibronectin. A. Only nonspecific staining for MGP was seen (arrow) in normal rat kidneys. B. MGP staining was markedly increased in the peritubular vessels (arrows) of the kidneys of hyperoxaluric rats (atrrows). C. OPN staining was not seen in the normal kidneys except on the papillary urothelial surface (not shown). D. Staining of epithelial cells for osteopontin was mostly associated with crystal deposits (arrows). E. Diffuse light staining for fibronectin is seen in renal epithelial cells as well interstitium of the normal kidneys. F. Intense fibronectin staining is seen in both the tubular epithelial cells as well as interstitium of the kidneys with hyperoxaluria. Original Mag ×45.

References

    1. Stamatelou KK, Francis ME, Jones CA, Nyberg LM, Curhan GC. Time trends in reported prevalence of kidney stones in the United States: 1976–1994. Kidney Int. 2003;63:1817–1823. - PubMed
    1. Scales CD, Jr, Smith AC, Hanley JM, Saigal CS. Prevalence of kidney stones in the United States. Eur Urol. 2012;62:160–165. - PMC - PubMed
    1. Kartha G, Calle JC, Marchini GS, Monga M. Impact of stone disease: chronic kidney disease and quality of life. Urol Clin North Am. 2013;40:135–147. - PubMed
    1. Rule AD, Roger VL, Melton LJ, 3rd, Bergstralh EJ, Li X, Peyser PA, Krambeck AE, Lieske JC. Kidney stones associate with increased risk for myocardial infarction. J Am Soc Nephrol. 2010;21:1641–1644. - PMC - PubMed
    1. Khan SR. Is oxidative stress, a link between nephrolithiasis and obesity, hypertension, diabetes, chronic kidney disease, metabolic syndrome? Urol Res. 2012;40:95–112. - PMC - PubMed