. 2015 Jun 30:5:11737.
doi: 10.1038/srep11737.

Enzymatic measurement of phosphatidylglycerol and cardiolipin in cultured cells and mitochondria

Affiliations

Enzymatic measurement of phosphatidylglycerol and cardiolipin in cultured cells and mitochondria

Shin-Ya Morita et al. Sci Rep. .

Abstract

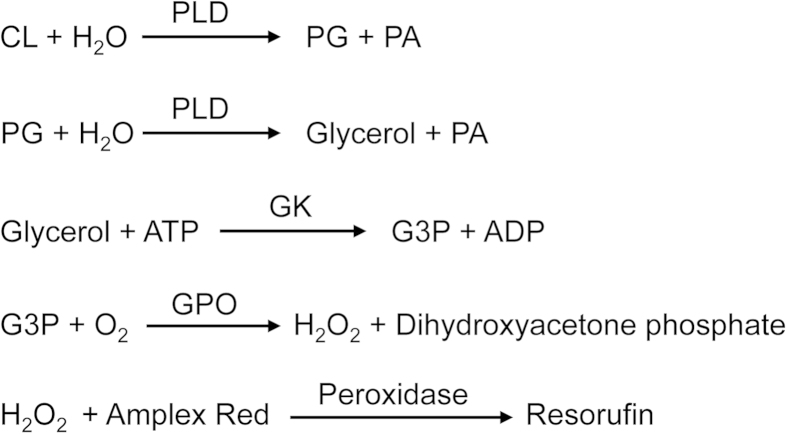
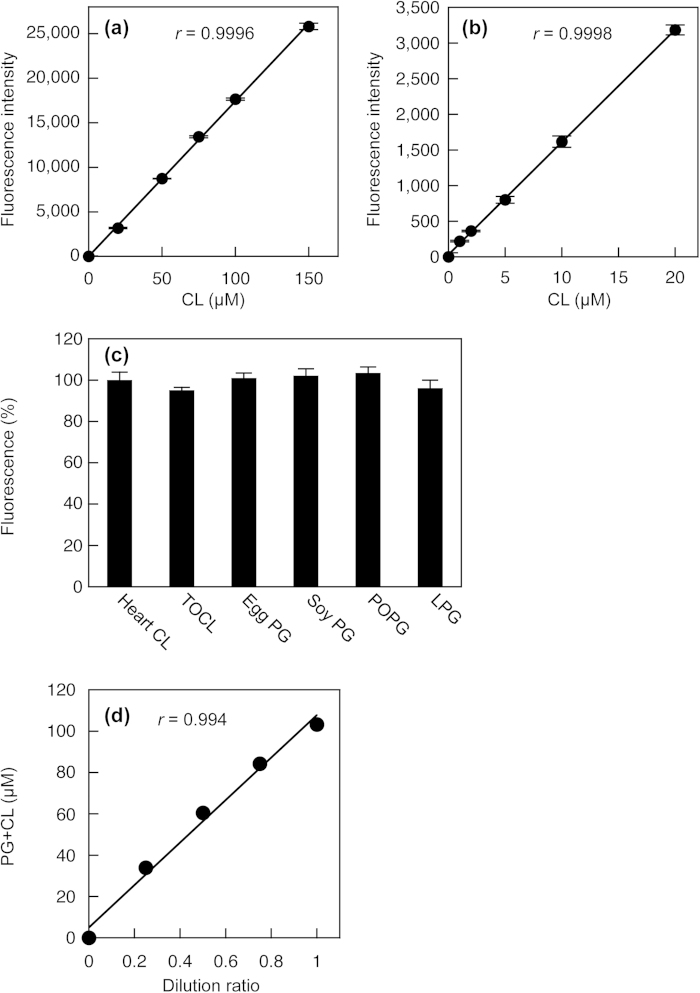
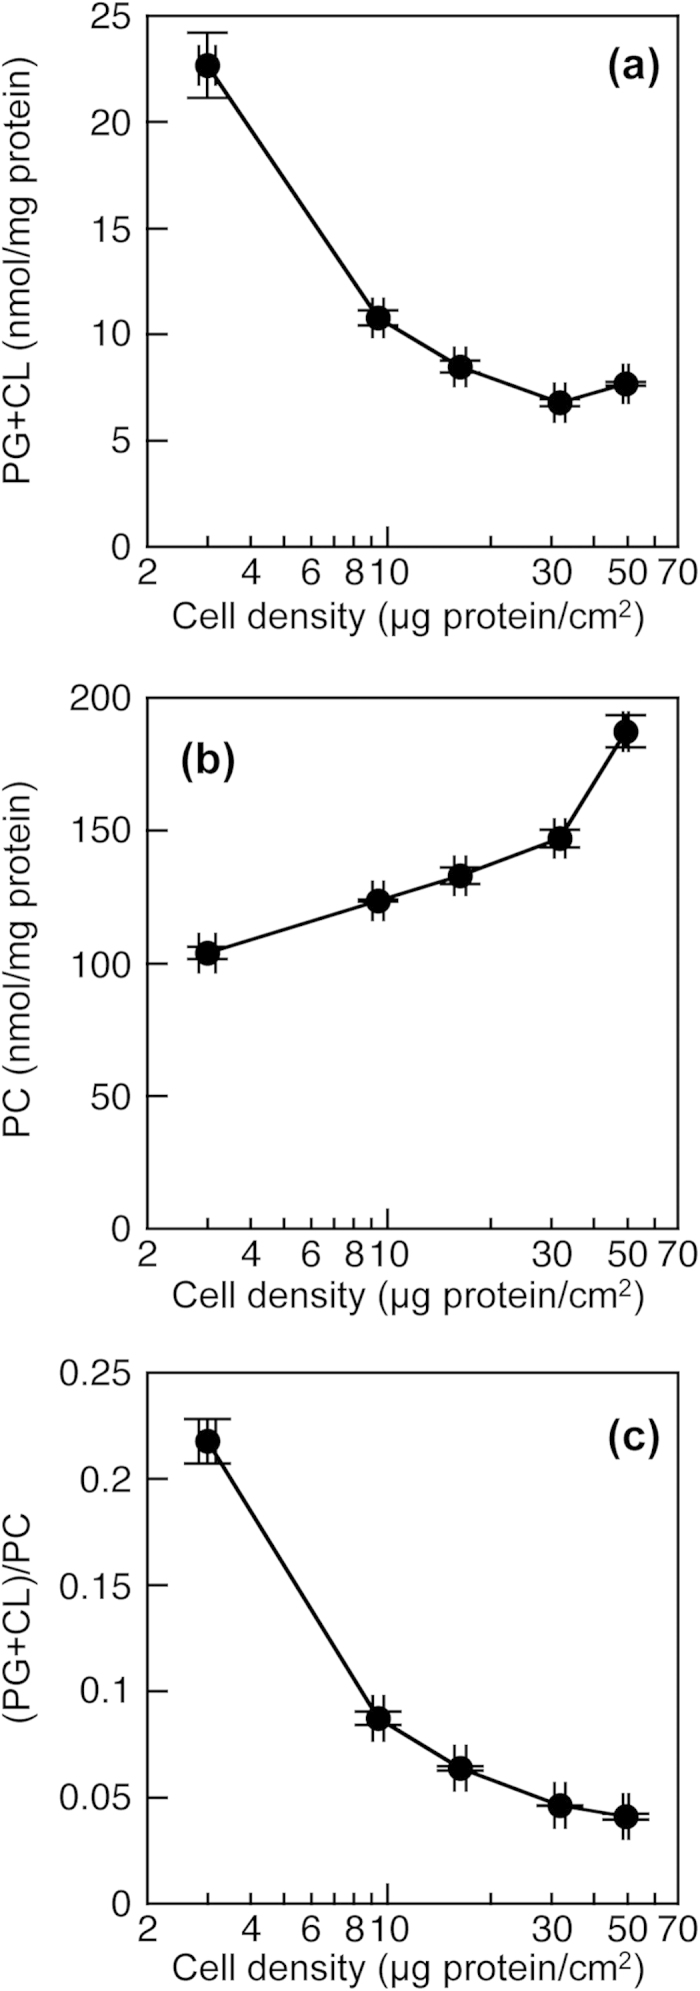
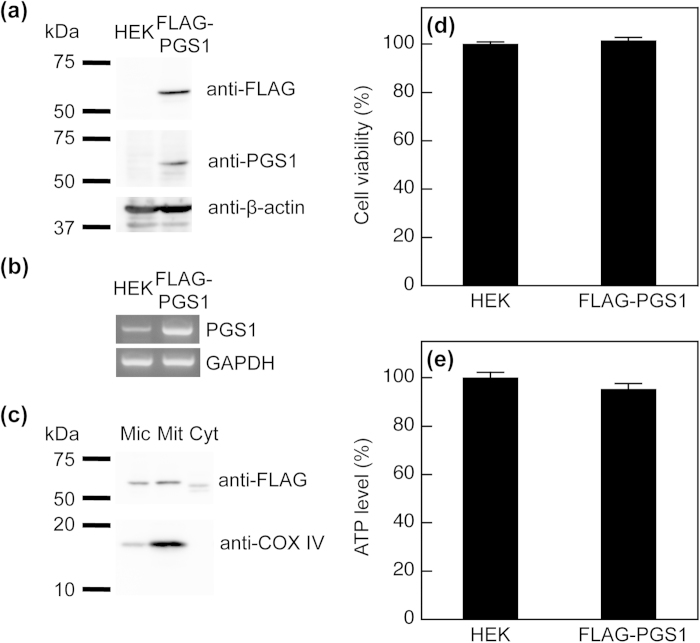
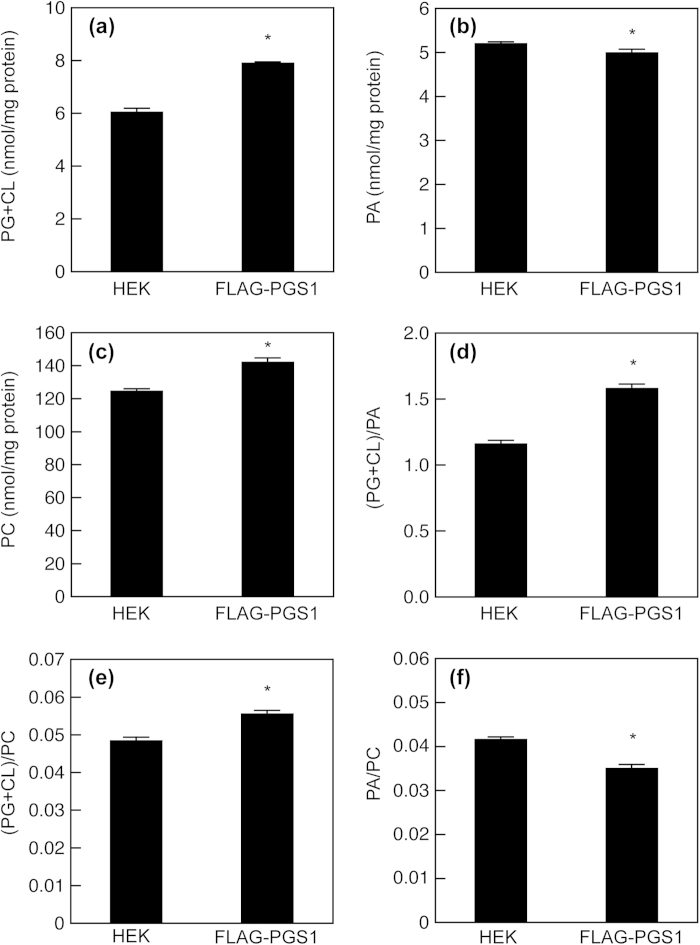
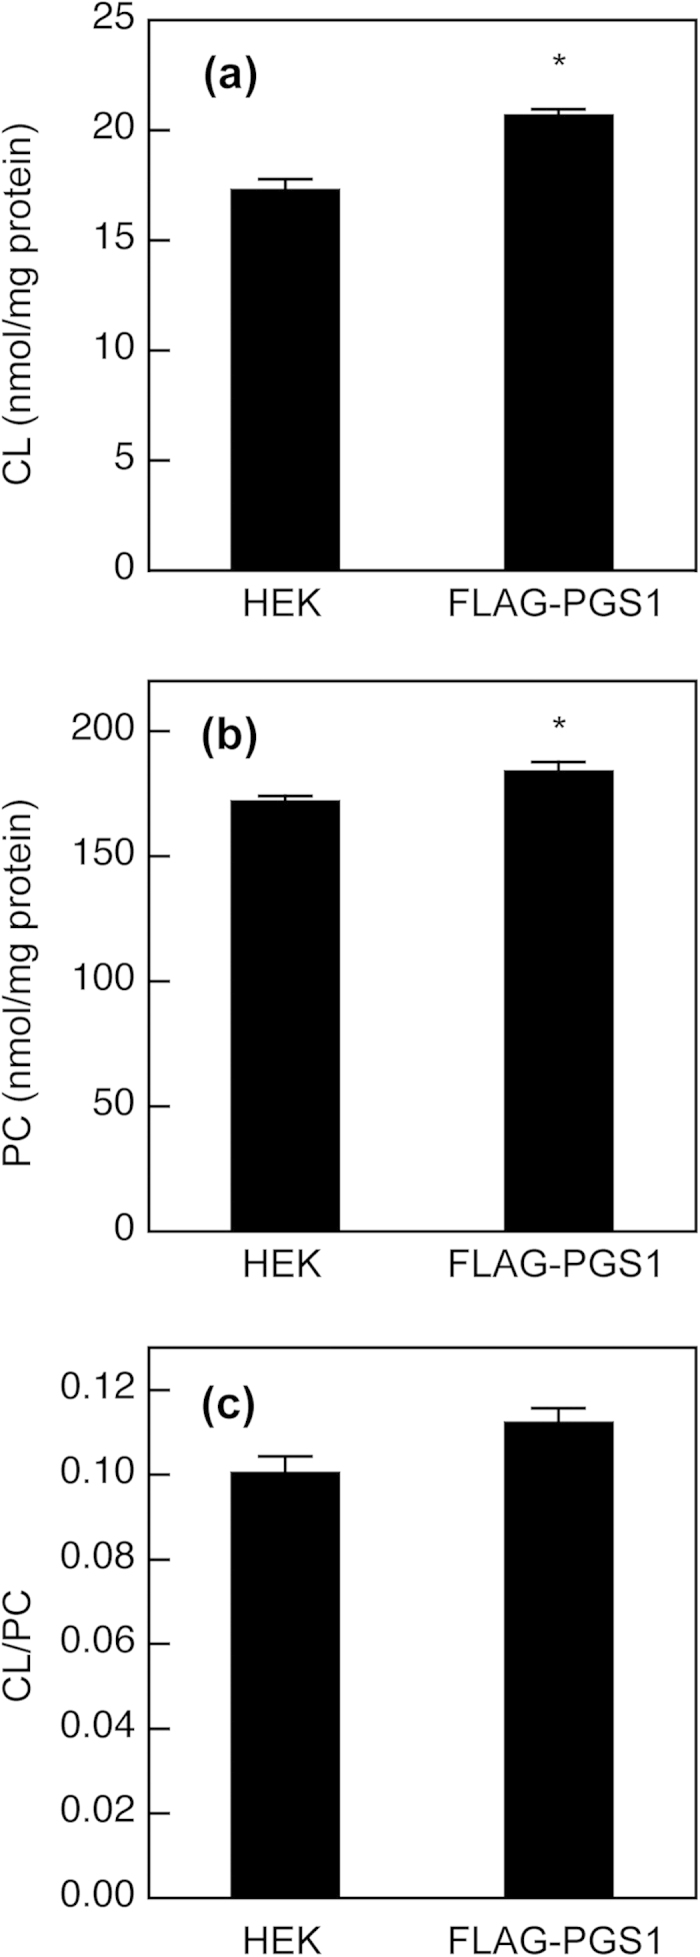
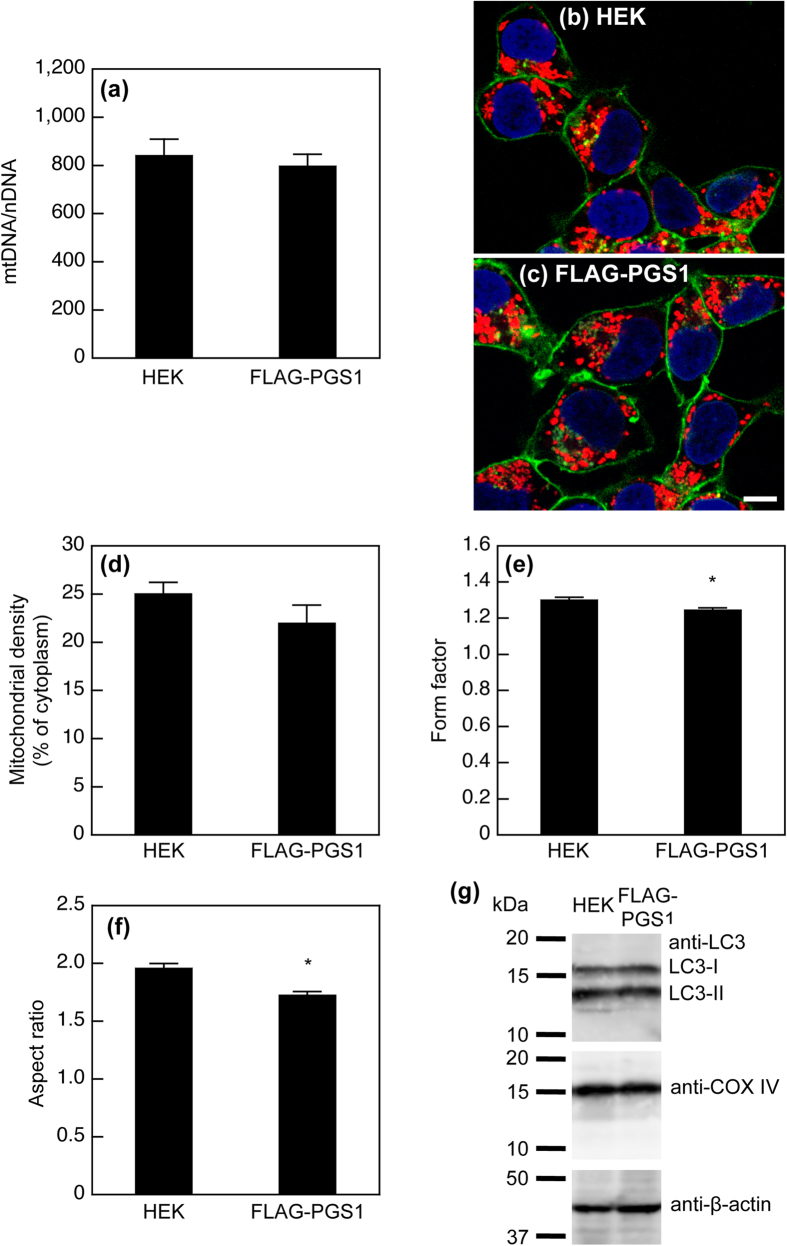
Phosphatidylglycerol (PG) and cardiolipin (CL) are synthesized in mitochondria and regulate numerous biological functions. In this study, a novel fluorometric method was developed for measuring PG and CL using combinations of specific enzymes and Amplex Red. This assay quantified the sum of PG and CL (PG + CL) regardless of the species of fatty acyl chain. The calibration curve for PG + CL measurement was linear, and the detection limit was 1 μM (10 pmol in the reaction mixture). This new method was applied to the determinations of PG + CL content in HEK293 cells and CL content in purified mitochondria, because the mitochondrial content of PG is negligible compared with that of CL. We demonstrated that the PG+CL content was greater at low cell density than at high cell density. The overexpression of phosphatidylglycerophosphate synthase 1 (PGS1) increased the cellular contents of PG + CL and phosphatidylcholine (PC), and reduced that of phosphatidic acid. PGS1 overexpression also elevated the mitochondrial contents of CL and PC, but had no effect on the number of mitochondria per cell. In addition to the enzymatic measurements of other phospholipids, this simple, sensitive and high-throughput assay for measuring PG + CL can be used to understand cellular, physiological and pathological processes.


Conflict of interest statement

The authors declare no competing financial interests.

Figures

Figure 1
Figure 1. Strategy for PG + CL measurement.
PLD catalyzes the hydrolysis of CL to PG and PA and the subsequent hydrolysis of PG to glycerol and PA. Glycerol is phosphorylated by glycerol kinase to G3P. Oxidation of G3P is catalyzed by GPO, which produces hydrogen peroxide. In the presence of peroxidase, Amplex Red reacts with hydrogen peroxide to produce highly fluorescent resorufin, which can be measured.
Figure 2
Figure 2. Enzymatic measurement of PG + CL.
(a) and (b) Standard curves for PG + CL measurement. The heart CL standard solution was added to Reagent L1 and incubated at 37 °C for 30 min. Then, Reagent L2 was added. After 30 min of incubation at room temperature, Stop Reagent was added. The fluorescence intensity was measured using a microplate reader. Background fluorescence was 3973 ± 57, which was subtracted from each value. Each point represents the mean ± S.D. of triplicate measurement. The lines were obtained by linear regression analysis. The correlation coefficients were r = 0.9996 (a) and r = 0.9998 (b). (c) Fluorescence changes in response to heart CL, TOCL, egg PG, soy PG, POPG and LPG in PG + CL measurement. Each bar represents the mean ± S.D. of triplicate measurement. There were no statistically significant differences between heart CL, TOCL, egg PG, soy PG, POPG and LPG. (d) Linearity of PG + CL measurement. The lipid extract from HEK293 cells was sequentially diluted with 1% Triton X-100. The correlation coefficient was r = 0.994.
Figure 3
Figure 3. Effect of cell density on PG + CL content in HEK293 cells.
HEK293 cells on 10 cm dishes were incubated in MEM containing 0.02% BSA for 18 h at 37 °C. PG + CL content (a), PC content (b) and (PG + CL)/PC ratio (c) of HEK293 cells were determined by the enzymatic measurements and protein assay. Each point represents the mean ± S.E. of three measurements.
Figure 4
Figure 4. Expression of FLAG-PGS1 in HEK293 cells.
(a) Immunoblot analysis of FLAG-PGS1. Sonically disrupted cell lysates (19.1 μg of protein) from HEK293 and HEK/FLAG-PGS1 cells were separated by 10% SDS-PAGE. The N-terminus of PGS1 was fused to the FLAG-tag, and FLAG-PGS1 was detected with an anti-FLAG antibody or with a polyclonal anti-PGS1 antibody (immunogen aa 110-556). (b) Expression of PGS1 mRNA in HEK293 and HEK/FLAG-PGS1 cells was assessed by RT-PCR. (c) Microsomal (Mic), purified mitochondrial (Mit) and cytosolic (Cyt) fractions were isolated from HEK/FLAG-PGS1 cells. Proteins (39.5 μg) were separated by 10% SDS-PAGE and then immunoblotted with an anti-FLAG antibody. COX IV (mitochondrial marker) was detected with a specific antibody. (d) and (e) Cell viability and intracellular ATP level were assessed by the resazurin assay and the bioluminescence-based assay, respectively. Data were reported as the percentages of controls. Each bar represents the mean ± S.E. of four measurements. There were no significant differences in cell viability and ATP levels between HEK293 and HEK/FLAG-PGS1 cells.
Figure 5
Figure 5. Effect of PGS1 overexpression on membrane phospholipid composition.
HEK293 and HEK/FLAG-PGS1 cells on 10 cm dishes were incubated in MEM containing 0.02% BSA for 18 h at 37 °C. There was no difference in the densities of HEK293 and HEK/FLAG-PGS1 cells (39.8 ± 0.5 and 42.2 ± 0.9 μg protein/cm2, respectively). PG + CL content (a), PA content (b), PC content (c), (PG + CL)/PA ratio (d), (PG + CL)/PC ratio (e) and PA/PC ratio (f) of the cells were determined by enzymatic measurements of PG + CL, PA and PC, and protein assay. Each bar represents the mean ± S.E. of four measurements. *P < 0.05, significantly different from HEK293 cells.
Figure 6
Figure 6. Effect of PGS1 overexpression on mitochondrial phospholipid composition.
HEK293 and HEK/FLAG-PGS1 cells were seeded in 10-cm dishes at a density of 1.5 × 107 cells and incubated with MEM supplemented with 10% FBS for 48 h at 37 °C. Then, the cells were incubated in MEM containing 0.02% BSA for 18 h at 37 °C. After incubation, purified mitochondrial fractions were isolated from the cells. CL content (a), PC content (b) and CL/PC ratio (c) of the purified mitochondrial fractions were determined by enzymatic measurements of CL and PC, and protein assay. Each bar represents the mean ± S.E. of three measurements. *P < 0.05, significantly different from HEK293 cells.
Figure 7
Figure 7. Effect of PGS1 overexpression on mitochondrial content and morphology.
(a) Total DNA was extracted from the cells, and the nuclear gene ASPOLG and the mitochondrial gene CCOI were quantified by real-time PCR. The results are expressed as the ratio of the mitochondrial DNA copy number to the nuclear DNA copy number (mtDNA/nDNA). Each bar represents the mean ± S.E. of six measurements. There was no statistically significant difference between HEK293 and HEK/FLAG-PGS1 cells. (b) and (c) Confocal fluorescence microscopy of HEK293 and HEK/FLAG-PGS1 cells. Mitochondria, nuclei, and cell surfaces were visualized with MitoTracker Red CMXRos (red), DAPI (blue), and FITC-concanavalin A (green), respectively. The bar represents 20 μm. Confocal images were used to determine mitochondrial densities, form factors and aspect ratios. (d) Mitochondrial density is expressed as the percentage of cytoplasmic area occupied by mitochondria. Each bar represents the mean ± S.E. from 18 cells. (e) and (f) The form factor (perimeter2/4π·area) and the aspect ratio (major axis/minor axis) were calculated for each mitochondrial object (n = 427, HEK293; n = 410, HEK/FLAG-PGS1) in 18 cells per group. Both parameters have a minimal value of 1, which represents a perfect circle, and the values increase as the shape becomes elongate. Each bar represents the mean ± S.E. *P < 0.05, significantly different from HEK293 cells. (g) Immunoblot analysis of LC3. Sonically disrupted cell lysates (37.0 μg of protein) from HEK293 and HEK/FLAG-PGS1 cells were separated by 15% SDS-PAGE. LC3, COX IV, and β-actin were detected with specific antibodies.

References

    1. Daum G. & Vance J. E. Import of lipids into mitochondria. Prog. Lipid Res. 36, 103–130 (1997). - PubMed
    1. Horvath S. E. & Daum G. Lipids of mitochondria. Prog. Lipid Res. 52, 590–614 (2013). - PubMed
    1. Touchstone J. C., Alvarez J. G., Levin S. S. & Storey B. T. Evidence for diplasmalogen as the major component of rabbit sperm phosphatidylethanolamine. Lipids 20, 869–875 (1985). - PubMed
    1. Wada H. & Murata N. The essential role of phosphatidylglycerol in photosynthesis. Photosynth Res 92, 205–215 (2007). - PubMed
    1. de Kroon A. I., Dolis D., Mayer A., Lill R. & de Kruijff B. Phospholipid composition of highly purified mitochondrial outer membranes of rat liver and Neurospora crassa. Is cardiolipin present in the mitochondrial outer membrane? Biochim. Biophys. Acta 1325, 108–116 (1997). - PubMed

Publication types

LinkOut - more resources