. 2015 Jul 30;523(7562):612-6.
doi: 10.1038/nature14468. Epub 2015 Jun 29.

T-cell exhaustion, co-stimulation and clinical outcome in autoimmunity and infection

Affiliations

T-cell exhaustion, co-stimulation and clinical outcome in autoimmunity and infection

Eoin F McKinney et al. Nature. .

Abstract

The clinical course of autoimmune and infectious disease varies greatly, even between individuals with the same condition. An understanding of the molecular basis for this heterogeneity could lead to significant improvements in both monitoring and treatment. During chronic infection the process of T-cell exhaustion inhibits the immune response, facilitating viral persistence. Here we show that a transcriptional signature reflecting CD8 T-cell exhaustion is associated with poor clearance of chronic viral infection, but conversely predicts better prognosis in multiple autoimmune diseases. The development of CD8 T-cell exhaustion during chronic infection is driven both by persistence of antigen and by a lack of accessory 'help' signals. In autoimmunity, we find that where evidence of CD4 T-cell co-stimulation is pronounced, that of CD8 T-cell exhaustion is reduced. We can reproduce the exhaustion signature by modifying the balance of persistent stimulation of T-cell antigen receptors and specific CD2-induced co-stimulation provided to human CD8 T cells in vitro, suggesting that each process plays a role in dictating outcome in autoimmune disease. The 'non-exhausted' T-cell state driven by CD2-induced co-stimulation is reduced by signals through the exhaustion-associated inhibitory receptor PD-1, suggesting that induction of exhaustion may be a therapeutic strategy in autoimmune and inflammatory disease. Using expression of optimal surrogate markers of co-stimulation/exhaustion signatures in independent data sets, we confirm an association with good clinical outcome or response to therapy in infection (hepatitis C virus) and vaccination (yellow fever, malaria, influenza), but poor outcome in autoimmune and inflammatory disease (type 1 diabetes, anti-neutrophil cytoplasmic antibody-associated vasculitis, systemic lupus erythematosus, idiopathic pulmonary fibrosis and dengue haemorrhagic fever). Thus, T-cell exhaustion plays a central role in determining outcome in autoimmune disease and targeted manipulation of this process could lead to new therapeutic opportunities.


Figures

Extended Data Figure 1
Extended Data Figure 1. Overview of weighted gene coexpression analysis
(A) mRNA derived from purified leucocyte subsets sampled during active, untreated autoimmune disease is labeled and hybridized to a microarray platform (both HsMediante 25k and Affymetrix Gene ST1.0 used here). Genes are then combined into modules (B, colored blocks) based on the similarity of their expression profile in all samples. (C) Detail for the ‘black’ module. Each horizontal black line represents expression of a single gene within the given module. y-axis = gene expression, x-axis = patient samples, red-bar = eigengene profile which effectively summarizes the expression of all genes comprising the black module. (D) Each modular profile is related to all others in a hierarchy that can itself be visualized by plotting correlation of all module eigengenes, such as in the heatmap shown here. Colored blocks represent individual modules, defined as in (A). Modules are aligned in identical order on x and y-axes with heatmap color representing the correlation between each. Note that the diagonal (top left to bottom right) therefore represents correlation of each eigengene profile with itself, and is always 1. Distance metric = Euclidean distance. (E) As each module is summarized by a representative eigengene profile, each may then be correlated against a range of clinical variables allowing visualization of how the transcriptome relates to clinical variables, again in the form of a correlation heatmap. Correlation = Pearson, r. (F) Heatmap showing gene expression modules (y-axis) correlated against clinical variables (x-axis) for the CD4 transcriptome in AAV, correlation = Pearson, r. (G) Heatmap illustrating significance of correlations identified in (F). P-value threshold at Bonferroni-corrected P<0.05. Color-bar indicates actual P-value of correlations deemed significant, grey shading = corrected P >0.05. Significance for costimulation (black) module from Figure 1 is also shown (P = 0.0005).
Extended Data Figure 2
Extended Data Figure 2. Weighted gene coexpression network analysis of the T cell transcriptome and its correlation with clinical phenotype in SLE
(A, E) Heatmaps illustrating the correlation of coexpression modules (colored blocks, y-axis) derived from the CD8 (A) and CD4 (E) transcriptomes of 23 SLE patients with clinical traits (x-axis). Overlap of the previously described prognostic signature with coexpression modules, along with the distribution of a random signature of equivalent size, shown to the right of (A) (overlap = signature genes / module genes %). Overlap of the CD4 T cell costimulation ‘black’ module (defined in Fig.1) shown to the right of (E) along with a randomly derived module and a type 1 interferon response signature previously shown to associate with active SLE. Overlap shown as % representation of the signature within each module. (B, D) Linear plots illustrating the ‘charcoal’ (B) and ‘grey’ (D) modules in detail. y-axis = gene expression, x-axis = individual patients, colored lines (red, blue) = module eigengenes. (C) Correlation of SLE CD4 T cell costimulation module eigengene (x-axis, blue) against SLE CD8 T cell prognostic signature (y, red). Pearson correlation, r, with P = 2-tailed significance. (F) Expanded detail from (E) illustrating that modules corresponding to type 1 IFN response and costimulation signatures correlate with disease activity and outcome respectively but not vice versa.
Extended Data Figure 3
Extended Data Figure 3. Identification and validation of genes involved in CD4 costimulation that correlate with clinical outcome, and how that relationship changes after treatment
(A) A knowledge-based network analysis of 336 probes comprising the ‘black’ expression module (Fig.1E) identifies a network of costimulation signaling (Supplementary Table 3). Individual genes are shown in circles with the ‘strength’ of their connections indicated by the weight of the black bar linking them. Pathways of TCR signaling, ICOS-ICOSL signaling and CD28 signaling all significantly enriched in this module (FDR p < 0.05). (B-E) Scatterplots showing the outcome of multiple linear regression models testing the association of 4 signatures (red symbols) as indicated, directly compared to clinical markers of disease activity (black symbols). x-axis = magnitude of association (regression coefficient, change in normalized flare rate (flares/days follow-up) per unit change in each variable tested). y-axis = significance of association in multiple regression model, P. significance threshold (dashed red line, P = 0.05). (B) CD8 turquoise module eigengene in AAV, (C) CD4 costimulation (black) module eigengene in AAV, (D, E) CD8 exhaustion signature (Supplementary Table 6) in AAV/SLE (D) and IBD (E). Clinical variables incorporated vary due to differing relevance in each case but include some of: disease activity score (BVAS/BILAG/CDAI/Harvey-Bradshaw score), CRP, autoantibody titer (PR3/MPO, dsDNA), Lymphocyte count, neutrophil count, platelet count, IgG, IgA, IgM, ESR, age. (F) Line plot showing mean expression of a CD8 T cell exhaustion signature in 38 AAV patients measured at presentation during active, untreated disease (t0) and again 12 months later when disease activity was quiescent and patients were on maintenance immunosuppressive therapy (t12). Patients are grouped into those falling above (red) and below (blue) median expression of the exhaustion signature eigengene at entry. P = Mann-Whitney test comparing t12 and t0 values. The difference between the groups that is easily apparent at enrolment with active, untreated disease (t0) is no longer apparent when disease is treated and quiescent twelve months later (t12). (G-I) Scatterplots showing inverse correlation between individual eigenvalues of the CD4 costimulation signature (x-axis, red) and the CD8 exhaustion signature (y-axis, blue) defined as in Fig. 2, for AAV (G), SLE (H) and IBD (I) cohorts. Correlation = Pearson, r2, 2-tailed significance.
Extended Data Figure 4
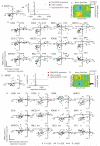
Extended Data Figure 4. Windrose plots showing relative GSEA enrichment of immune signatures in autoimmune disease and melanoma
Windrose plots showing relative enrichment (GSEA FDR q value) of distinct immune signatures between patient subgroups (as defined as in Fig2). (A, B) AAV, (C, D) SLE and (E, F) IBD. (A, C, E) enrichment of immune signatures from selected CD8 T cell phenotypes and (B, D, F) enrichment of signatures specifically up/down regulated by CD8 T cell subsets derived from the LCMV model of T cell exhaustion (acute LCMV-Armstrong v chronic LCMV-Cl13). Detailed information on genes included in each signature is provided in Supplementary Table 6. (G, H) Windrose plots showing relative enrichment (GSEA FDR q value) of distinct immune signatures between CD8 T cells from melanoma patients, comparing CD8 from tumor-infiltrated lymph node with circulating CD8 T cells. (G) Enrichment of immune signatures from selected CD8 T cell phenotypes and (H) enrichment of signatures specifically up/down regulated by CD8 T cell subsets derived from the LCMV model of T cell exhaustion (acute LCMV-Armstrong v chronic LCMV-Cl13). Specific enrichment is seen for genes downregulated by exhausted cells but not for all genes upregulated by exhausted cells. (C) Heatmap showing differential expression of selected canonical coinhibitory receptors (as for Fig2C) in the LCMV exhaustion model, between prognostic subgroups identified in D, G, J (reproduced from Fig.2C) and also between exhausted CD8 from melanoma-infiltrated lymph node compared to circulating tumor-specific CD8 T cells. Blue = up in exhausted, Red = up in non-exhausted, grey = no significant change (FDR p<0.05).
Extended Data Figure 5
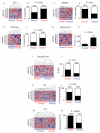
Extended Data Figure 5. T cell costimulation with CD2, but not type 1 interferon or anti-CD40, prevents development of an exhausted IL7RloPD1hi phenotype during prolonged anti-CD3/28 T cell stimulation
(A-D) Representative scatterplots showing IL7R expression (y-axis) by cell division (CFSE dilution, x-axis) in (A) unstimulated cells and following each of three different costimulation cultures: (B) anti-CD3/CD28 alone, (C) anti-CD2/3/28 and (D) anti-CD40/3/28. IL7Rhi expressing subset indicated in black gate with % live cells shown. (E- G) Line and scatterplots showing absolute number of IL7Rhi cells (E), PD-1 expression (F) and cell death (G, death = AquaFluorescent dye+) during CD8 T cell differentiation (x-axis, number of divisions undergone by day 6 of culture measured by CFSE dilution) following anti- CD3/28 (blue) or anti-CD2/3/28 stimulation (red). P= paired t-test, n = 5 paired samples. (L, M) Line and scatterplots showing absolute number of IL7Rhi cells (y-axis) by number of divisions undergone at day 6 (x-axis) following polyclonal stimulation with anti-CD3/28 (blue) or anti-CD3/28 plus anti-CD40 (L, green) or interferon alpha (IFNα, green, M) costimulation. (N) Line and scatterplot showing extent of proliferation occurring (% of live cells on day 6 having undergone each of 0-4 divisions) following polyclonal stimulation of primary human CD8 T cells with CD3/28 alone (blue) or with additional anti-CD2 costimulation (red), confirming no difference in the extent of live cell proliferation between groups. (O) Absolute live (AquaFluorescent Dye) cell counts (y- axis) by the number of divisions undertaken (x-axis) by day 6 following polyclonal stimulation of primary human CD8 T cells with CD3/28 alone (blue) or with additional anti-CD2 costimulation (red), illustrating increased cell survival with CD2 costimulation despite equivalent proliferation. P values = 2-way ANOVA of 4 paired stimulations. (H, I) Hierarchical clustering of 44 AAV (left panels) and 23 SLE (right panels) patients using 336 genes comprising a CD4 T cell costimulation module (black module, Fig 1) identifies 2 patient subgroups (high costimulation, red, and low costimulation, blue) in CD4 T cell expression data defined by the first major division in the patient dendrogram. (J, K) Scatterplots illustrating selected costimulatory and coinhibitory receptors for the subgroups identified in (H) and (I). Selected receptors were chosen based on their inclusion in networks derived from the costimulation and exhaustion signatures as illustrated in Extended Data Figure 3A.
Extended Data Figure 6
Extended Data Figure 6. CD2-costimulation results in functionally distinct subpopulations showing enhanced survival following in vitro restimulation but no preferential expansion of CD8 memory subsets
(A) Representative flow cytometry density plots of CD8 T cells showing BCL2 expression on day 7 after stimulation with anti-CD3/28 (blue) or anti-CD2/3/28 (red). Figures are % of total CD8 T cells. (B) Quantification of BCL2 expression in CD8 T cells stimulated as in (A). P = Mann-Whitney, n = 5 paired biological replicates per group. (C) Scatterplots showing cytokine levels (y-axis, pg/ml) measured in supernatants of CD8 T cells on day 7 after in vitro stimulation with either anti-CD3/28 (left column, blue) or CD2/3/28 (right column, red). Samples represent paired stimulations of primary CD8 T cells from the same individual using either stimulation protocol, n = 6 biological replicates per group. (D) Scatterplots illustrating populations sorted following polyclonal anti-CD3/28 (left panel) and anti-CD2/3/28 (right panel) stimulation of primary CD8 T cells. (E) % live cells (AquaFluorescent dye) remaining 7 days after restimulation of each sorted subpopulation of CD8 cells. Cells were rested for 6 days in complete RPMI1640 medium without IL2 before being restimulated with anti-CD2/3/28 for a further 7 days. P = Mann-Whitney, Error bars = Mean +/− SEM. (F) Representative scatterplot illustrating CD8 T cell memory populations isolated by flow cytometric sorting and stimulated in (G, H). (G) Scatterplot showing absolute number of IL7Rhi cells (y-axis) on day 6 following anti-CD3/28 (blue) or anti-CD2/3/28 (red) stimulation of purified CD8 T cell memory populations (x-axis). * = P<0.05, Mann-Whitney test. n = 5 paired biological replicates per group. (H) Scatterplots showing % CD8 T cell memory subsets (y-axis) resulting from stimulation of purified central memory (Tcm), naïve (Tn), effector memory (Tem) and effector memory-RA (Temra) populations with anti-CD3/28 (blue) or anti-CD2/3/28 (red) for 6 days, n = 4 paired biological replicates per group.
Extended Data Fig. 7
Extended Data Fig. 7. Top PBMC surrogate markers reflect expression of CD4 costimulation/CD8 exhaustion modules within CD4 and CD8 data respectively
Top PBMC-level predictors (n=13) were selected as indicated in Fig4A and data is shown comparing expression of the optimal predictor (KAT2B, A, E) and of each other top predictor gene (D, H) in PBMC data compared to expression of the CD4 costimulation module eigengene in CD4 data (A-D) and the CD8 exhaustion signature eigengene in CD8 data (E-H) for n=44 patients with AAV. Significance of correlation, *P<0.05, **P<0.01, ***P<0.001. (B, F) Scatterplots showing the outcome of multiple linear regression models testing the association of KAT2B expression in CD4 (B) and CD8 (F) data (red symbols) directly compared to clinical markers of disease activity (black symbols). x-axis = magnitude of association (regression coefficient, change in normalized flare rate (flares/days follow-up) per unit change in each variable tested). y-axis = significance of association in multiple regression model, P. significance threshold (dashed red line, P = 0.05). Clinical variables incorporated = disease activity score (BVAS), CRP, Lymphocyte count, neutrophil count, IgG. (C, G) Heatmaps reproduced from Fig1A and I respectively, showing overlap of top PBMC-level predictors with the modular analysis presented for CD4 (C) and CD8 (G) data in Figure 1. As expected, surrogate markers showed stronger correlation with the CD4 than the CD8 signature as the algorithm was trained to detect the CD4 costimulation module.
Extended Data Fig. 8
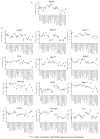
Extended Data Fig. 8. Immune cell subset expression pattern of top PBMC-level surrogate markers of CD4 costimulation/CD8 exhaustion signatures
Dot plots showing expression (median +/− SEM) of KAT2B (A) and for each of 12 other top PBMC-level surrogate predictors of CD4 costimulation/CD8 exhaustion signatures (from Fig.4A) in a range of 22 immune cell subsets. Genes showing significant correlation of expression with KAT2B across all cell types are indicated (**P<0.001).
Extended Data Fig. 9
Extended Data Fig. 9. Hierarchical clustering of multiple datasets using 13 top PBMC-level surrogate markers of CD4 costimulation/CD8 exhaustion modules identifies patient subgroups with distinct clinical outcomes
Replication of association between surrogate markers of CD4costimulation/CD8 exhaustion signatures and clinical outcome (as shown in Fig4C-K) but using all top 13 PBMC-level surrogates rather than KAT2B alone. (A, C, E, G, I, K, M) Heatmaps showing hierarchical clustering of gene expression data of 13 top PBMC-level surrogate predictors of CD4 costimulation/CD8 exhaustion signatures (from Fig.4A) in patients with chronic HCV (A), during malaria vaccination (C), influenza vaccination (E), yellow fever vaccination (G), dengue fever infection (I), idiopathic pulmonary fibrosis (IPF, K) and pre-T1D (M). Subgroups were defined using a major division of the cluster dendrogram and Group1 allocated based on KAT2B expression (highest in Group 1). Clinical outcome associated with each subgroup identified is shown in B (HCV, % responders to IFNα/ribavirin therapy), D (% showing protection v no protection from malaria vaccine), F (% response to influenza vaccination), H (yellow fever antibody-titer post-vaccination), J (% progression to dengue hemhorrhagic fever, DHF), L (% patients progressing to need for transplantation or death) and N (% samples from patients with prior or subsequent progression to islet-cell antibody seroconversion or to a diagnosis of T1D).
Extended Data Fig. 10
Extended Data Fig. 10. Kinetics of KAT2B expression during treatment of chronic HCV, malaria and influenza vaccination, during T1D development in the NOD mouse and in PBMC data from IBD and RA patients
(A) Expression of a type 1 interferon response signature (average eigenvalue of type 1 IFN response signature plotted for each response group at each timepoint, A, signature as defined in) in a cohort of 54 patients during treatment of chronic HCV infection with pegylated interferon-α and ribavirin (as described in and Figure 4C), including 28 showing a marked response (red line, HCV titer decrease > 3.5 log10iu/ml by day 28) and 26 a poor response (HCV titer decrease <1.5 log10iu/ml by day 28), P = 2-way ANOVA. (B) Schematic representation of the vaccination (black) and transcriptome profiling (red) schedule for the adjuvanted RTS,S Malaria Vaccine Trial (as shown in Fig4D). (B-D) Heatmap (B) and line plot (C, D) illustrating temporal changes in expression of 404 genes representing the GO ‘inflammatory response’ module (C) or KAT2B expression (D) at each time-point during vaccination in patients with above (red) and below (blue) median KAT2B expression throughout the vaccination schedule outlined in (B). Subgroups defined at T2, immediately following booster vaccination as this equates to the period of most ‘active’ immune response. Plots = Mean +/− SEM. (E) Schematic representation of the vaccination (black arrows) and transcriptome profiling (red arrows) schedule for 28 vaccinees receiving the 2008 seasonal influenza vaccination (combined trivalent inactivated influenza vaccine as shown in Fig 4E) with response assessed at d28 by HAI titer (green arrow). (F) Linear plot illustrating temporal changes in expression of 404 genes representing the GO ‘inflammatory response’ module at each time-point during vaccination (d0-d7 corresponding to microarray bleed points in E) for patients showing above (red) or below (blue) median expression of KAT2B at day 3 following vaccination. y = expression, log2, x = time-point, days post-vaccination, P = 2way ANOVA. (G) Linear plot showing ratio of Kat2b expression in peripheral blood of NOD mice (y-axis, n=37 mice in total across 6 timepoints) prior to and during the induction and onset of insulitis and the development of overt diabetes (illustrated by black bars below). x-axis = age (days), y-axis = Kat2b expression log2 ratio v B10 controls. (H) Kaplan-Meier censored survival curve showing flare-free survival (y-axis) during follow-up (x-axis) of n=58 IBD patients stratified by KAT2B expression (red, above median, blue, below median). P = log-rank test. (I, J) Boxplots showing clinical response (% responders) 3 months post-treatment with anti-TNF therapy in two independent cohorts (I and J) of rheumatoid arthritis (RA) patients. P = Fisher’s exact test. Linear plots show mean+/− SEM throughout.
Figure 1
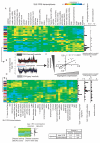
Figure 1. Weighted gene co-expression network analysis of the T cell transcriptome and its correlation with clinical phenotype in AAV
(A, I) Heatmaps illustrating the correlation of CD8 (A) and CD4 (I) co-expression modules (colored blocks, y-axis) with clinical traits in AAV (n=44). Prognostic and random signature overlap with modules shown (A, right) (overlap = signature genes / module genes %). (B, F) Linear plots illustrating turquoise (B) and black (F) modules and summary eigengenes, y = expression (log2 ratio), x = samples. (C, D, G, H) Scatterplots showing normalized flare-rate (C, G) and disease activity (D, H, Birmingham Vasculitis Activity Score (BVAS), y-axis) against turquoise (C, D) or black (G, H) module eigengene expression (x-axis). (E) Scatterplot showing correlation between CD4 T cell black (x-axis) and CD8 T cell turquoise module eigengenes (y-axis). Pearson correlation, r, with P = 2-tailed significance.
Figure 2
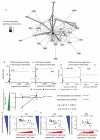
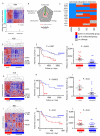
Figure 2. A gene expression signature of CD8 T cell exhaustion predicts contrasting outcomes in infection and autoimmune disease
(A) Heatmap showing hierarchical clustering of AAV patients (n=44) by expression of the turquoise module (Fig.1B) with corresponding flare rates (flares/days follow-up, y-axis). (B) Windrose plot showing GSEA significance (increasing from center, −log10FDRq value) of CD8 T cell signatures tested between prognostic subgroups defined in (A). (C) Heatmap showing differential expression of exhaustion-associated coinhibitory receptors between prognostic subgroups identified in D, G, J. Blue = up, red = down in exhausted, grey = no change (FDR p <0.05). (D, G, J) Heatmaps showing hierarchical clustering of CD8 T cell expression data isolated from patients with AAV (D, n=58), SLE (G, n=23) and IBD (J, n=58) using a murine CD8 exhaustion signature. ‘Exhausted’ (blue) and ‘non-exhausted’ (red) patient subgroups defined from the primary division of the cluster dendrogram. (E, H, K) Kaplan-Meier curves showing censored flare-free survival and (F, I, L) scatterplots showing normalized flare-rate against duration of follow-up for patient subgroups defined in (D, G, J) for AAV (E, F), SLE (H, I) and IBD (K, L) cohorts. (E, H, K) P = log-rank test. (A, F, I, L) P = Mann-Whitney test.
Figure 3
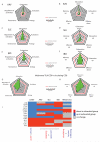
Figure 3. T cell costimulation with CD2 prevents development of an exhausted IL7RloPD1hi phenotype
(A) Schematic of the magnetic bead system providing variable TCR signal duration/costimulation during in vitro culture. (B-F) Scatterplots illustrating IL7R expression by cell division in unstimulated CD8 T cells (B) and following each of three different costimulation cultures (C-F), as indicated. (G-I) Linear plots showing IL7Rhi population resulting from (G) 36h (black line) v 6d (blue line) anti-CD3/28 stimulation, (H) 6d anti-CD2/3/28 (red line) v 6d anti-CD3/28 (blue line) and from 6d anti-CD2/3/28 with (green line) and without (I, red line) Fc-PDL1. (J) Heatmap showing unsupervized hierarchical clustering of murine CD8 T cell gene expression data before (naïve, grey), 8 days (effector, green) or 30 days (memory, red) after acute or >30 days (exhausted, blue) after chronic LCMV infection clustered by a CD2 response signature. (K, L) Scatterplots showing GSEA enrichment for genes up (red) and downregulated (blue) by CD2 in (K) memory v exhausted and (L) effector v exhausted CD8 T cells. (M-O) Heatmap showing unsupervized hierarchical clustering of AAV (M, n=58), SLE (N, n=23) and IBD (O, n=58) CD8 T cell expression data using the CD2 response signature. ‘Exhausted’ (blue) and ‘non-exhausted’ (red) subgroups were defined from the major division of the cluster dendrogram. Upper bar indicates comparison with patient subgroups produced using the murine LCMV exhaustion signature (as shown in Fig.2D, G, J). Enrichment by GSEA of CD2 signature in autoimmune subgroups < FDR q 0.1.
Figure 4
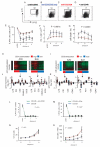
Figure 4. A surrogate marker of CD4 costimulation in PBMC gene expression data correlates with clinical outcome in chronic viral infection, vaccination, infection and autoimmunity
(A) Scatterplot showing the top 100 genes ranked by ability to identify CD4 T cell costimulation subgroups in PBMC data. x-axis = variable importance. (B) Kaplan-Meier plots showing censored flare-free survival stratified by expression of KAT2B (red = above median, blue = below median) in AAV and SLE patients (n=37, training set) replicated on Affymetrix GeneST1.0 and in an independent cohort (test set, n=47), P = log-rank test. (D) Line and scatterplots showing serial KAT2B expression (n=54) following therapy of chronic HCV infection giving a marked (red, n=28) or poor response (blue, n=26). P = 2-way ANOVA. (E) Boxplot showing post-vaccine malaria protection in a clinical trial (n=43) stratified by KAT2B expression (red = above, blue = below median), P = Fisher’s exact test. (F) Boxplot showing % protection (black) in vaccinees (n=28) following seasonal influenza vaccine stratified by KAT2B expression, P = Fisher’s exact test (G) Scatterplot showing neutralizing antibody titer following YF-17D vaccination, stratified by KAT2B expression (F, G red = above, blue = below median KAT2B). P = Mann-Whitney test. (H) Line and scatterplot showing serial KAT2B expression throughout dengue infection (n=78) stratified by progression to hemorrhagic fever (DHF, n=24) or uncomplicated course (UD, n=54). x-axis = time (days) relative to defervescence. (H) Boxplot showing % IPF patients (n=75) progressing to transplantation/death (black) stratified by KAT2B expression (red = above median, blue = below median). P = Fisher’s exact test. (I-K) Scatterplots showing serial KAT2B expression in healthy age, sex and HLA-matched controls (I, blue) and in pre-T1D cases (n=5, red), 2 of which seroconvert to islet-cell antibodies (J, black line) and 3 of which develop T1D (K, black line).

Comment in

References

    1. Wherry EJ. T cell exhaustion. Nature immunology. 2011;12:492–499. - PubMed
    1. McKinney EF, et al. A CD8+ T cell transcription signature predicts prognosis in autoimmune disease. Nature medicine. 2010;16:586–591. - PMC - PubMed
    1. Lee JC, et al. Gene expression profiling of CD8+ T cells predicts prognosis in patients with Crohn disease and ulcerative colitis. The Journal of clinical investigation. 2011;121:4170–4179. - PMC - PubMed
    1. Baechler EC, et al. Interferon-inducible gene expression signature in peripheral blood cells of patients with severe lupus. Proceedings of the National Academy of Sciences of the United States of America. 2003;100:2610–2615. - PMC - PubMed
    1. West EE, et al. Tight regulation of memory CD8(+) T cells limits their effectiveness during sustained high viral load. Immunity. 2011;35:285–298. - PMC - PubMed

METHODS REFERENCES

    1. Stone JH, et al. A disease-specific activity index for Wegener’s granulomatosis: modification of the Birmingham Vasculitis Activity Score. International Network for the Study of the Systemic Vasculitides (INSSYS) Arthritis and rheumatism. 2001;44:912–920. - PubMed
    1. Tan EM, et al. The 1982 revised criteria for the classification of systemic lupus erythematosus. Arthritis and rheumatism. 1982;25:1271–1277. - PubMed
    1. Isenberg DA, et al. BILAG 2004. Development and initial validation of an updated version of the British Isles Lupus Assessment Group’s disease activity index for patients with systemic lupus erythematosus. Rheumatology. 2005;44:902–906. - PubMed
    1. Silverberg MS, et al. Toward an integrated clinical, molecular and serological classification of inflammatory bowel disease: report of a Working Party of the 2005 Montreal World Congress of Gastroenterology. Can J Gastroenterol. 2005;19(Suppl A):5A–36A. - PubMed
    1. Harvey RF, Bradshaw MJ. Measuring Crohn’s disease activity. Lancet. 1980;1:1134–1135. - PubMed

Publication types

MeSH terms