. 2015 Jul;146(1):51-63.
doi: 10.1085/jgp.201411339.

Regulation of the transient receptor potential channel TRPM3 by phosphoinositides

Affiliations

Regulation of the transient receptor potential channel TRPM3 by phosphoinositides

Balázs I Tóth et al. J Gen Physiol. 2015 Jul.

Abstract

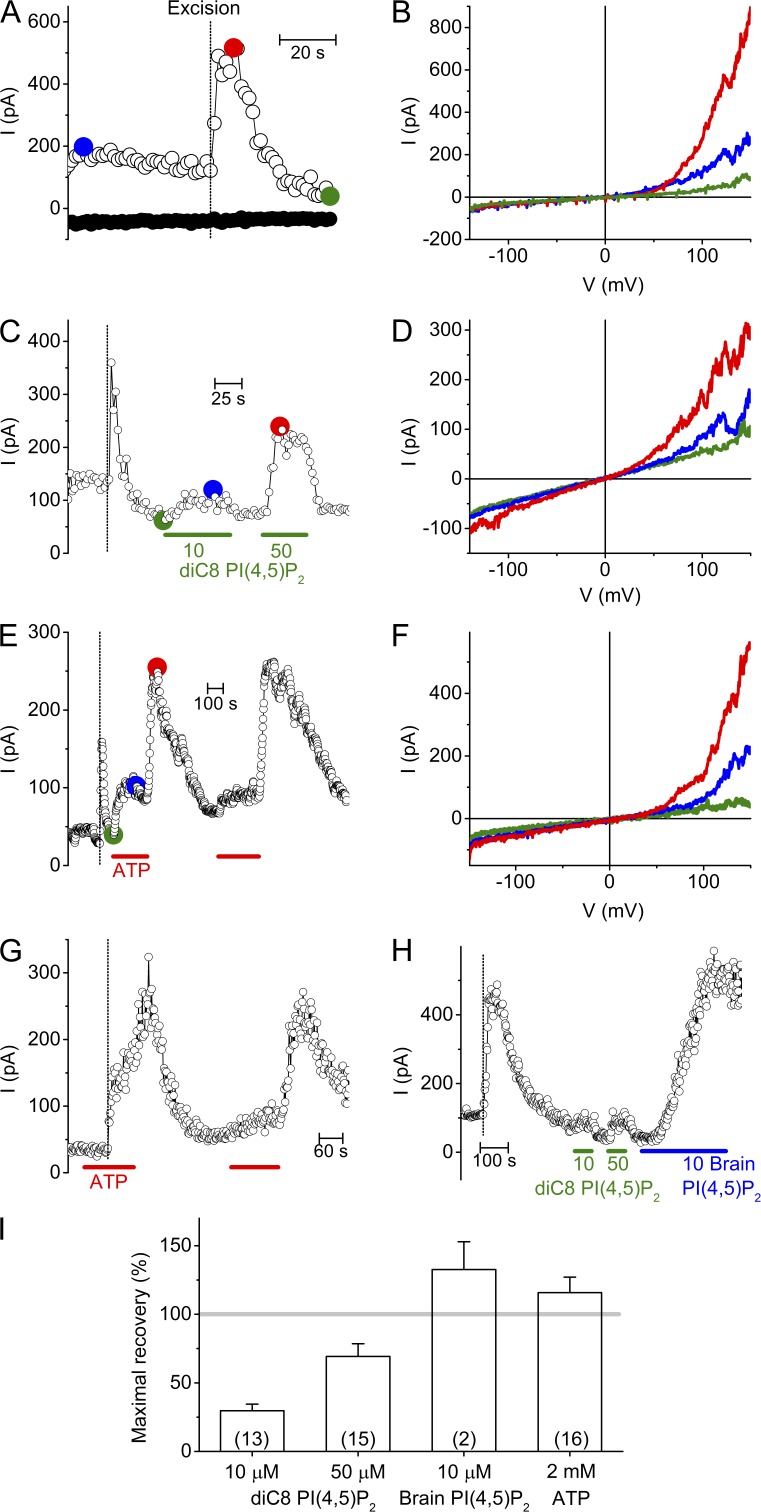
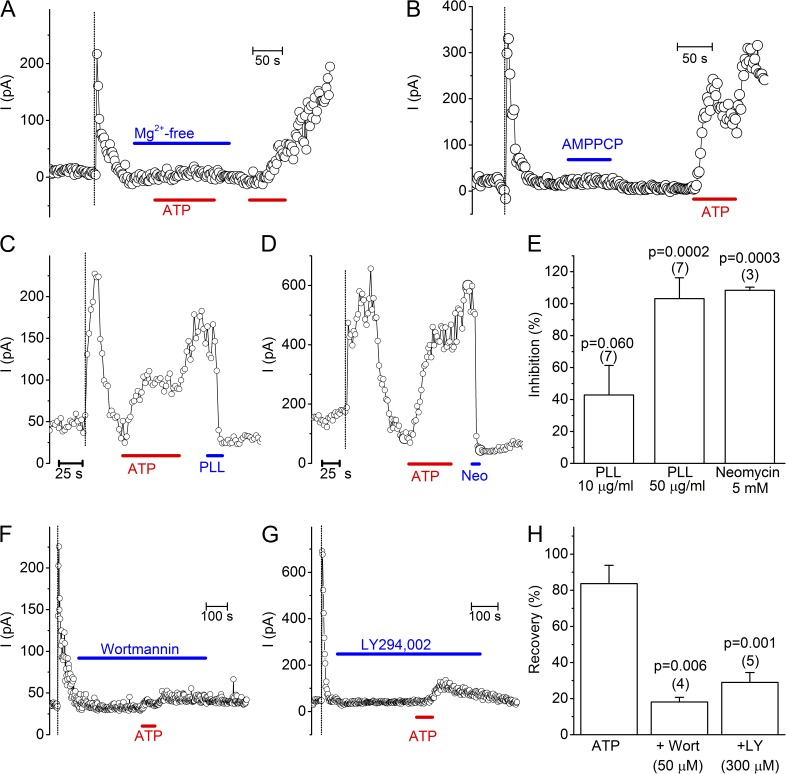
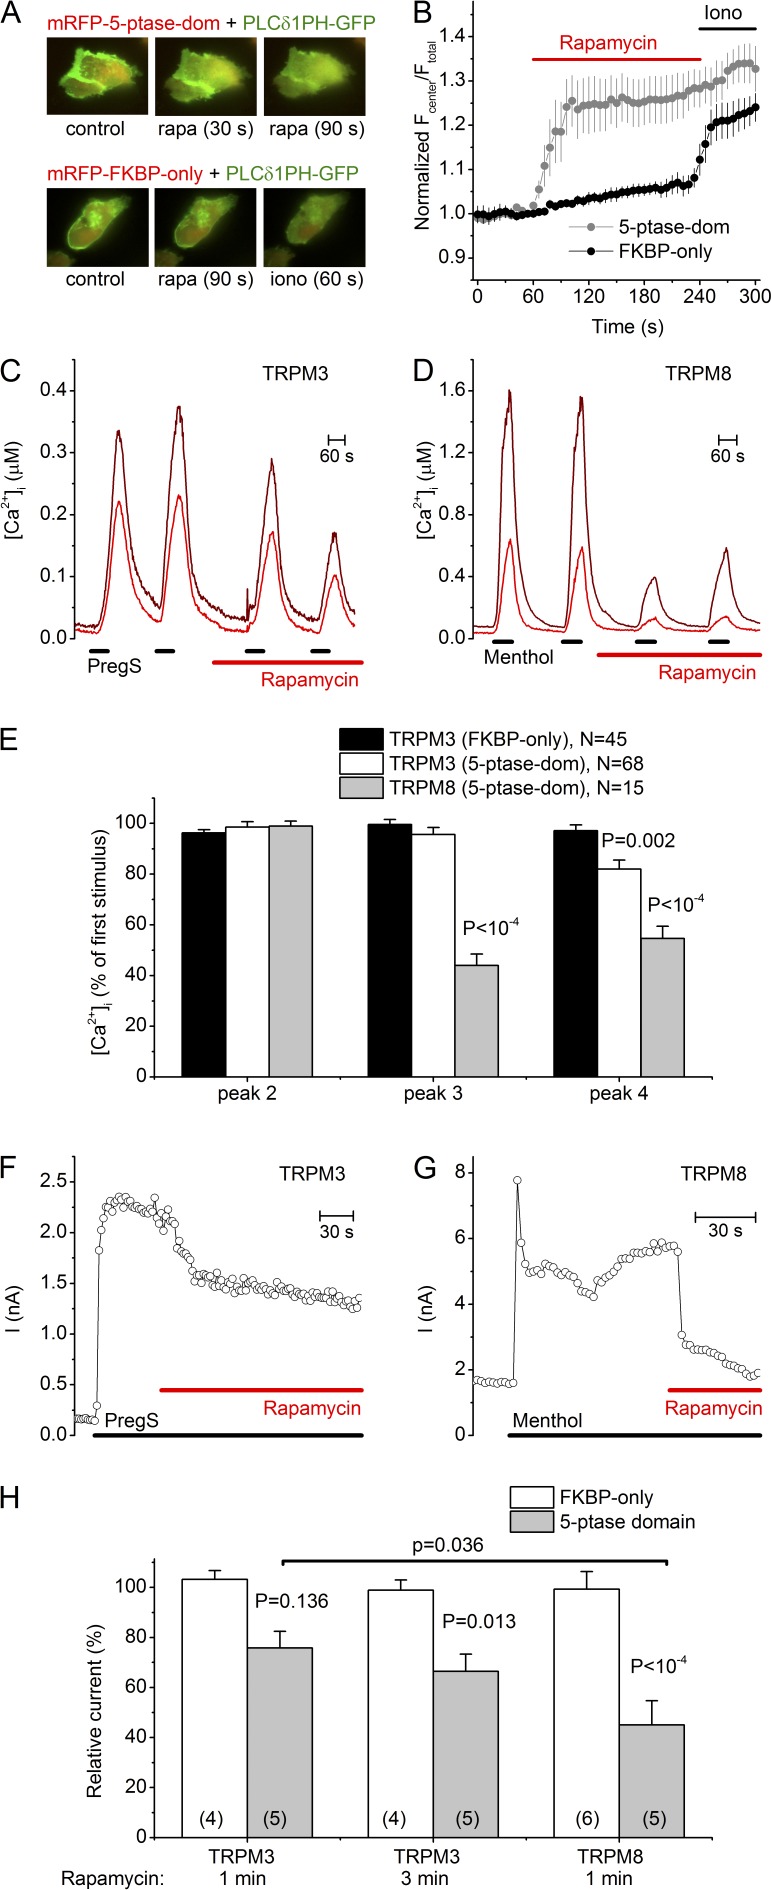
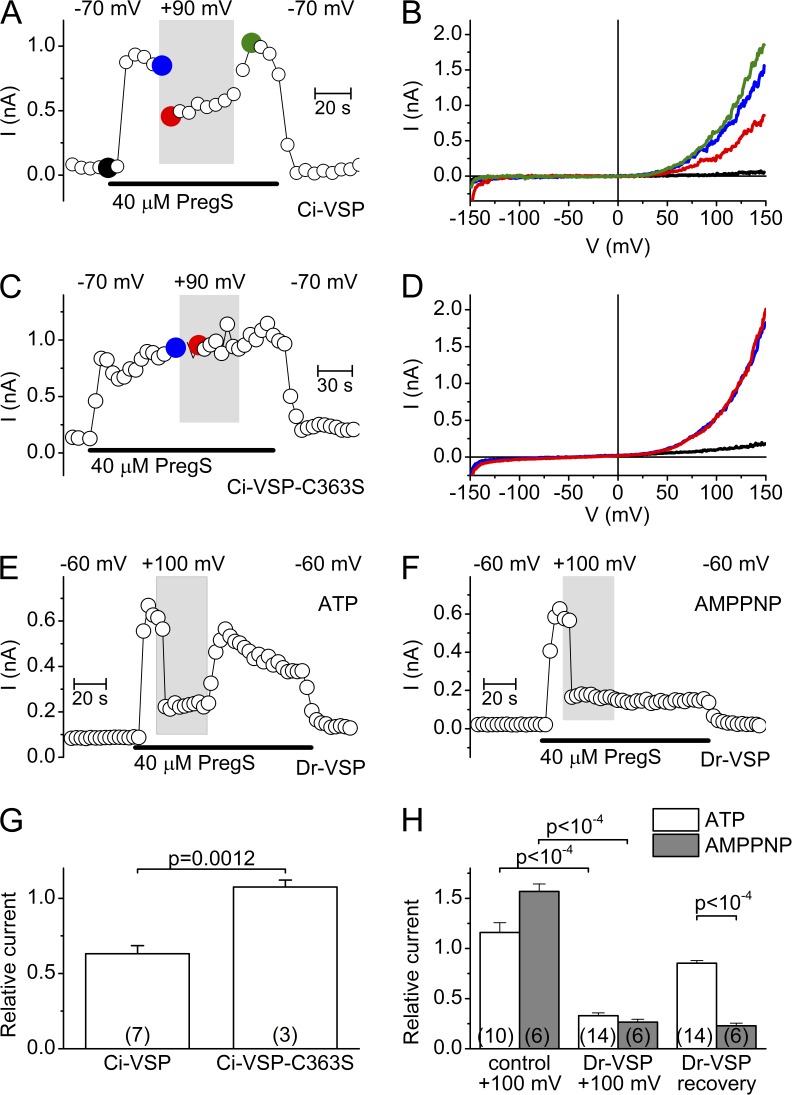
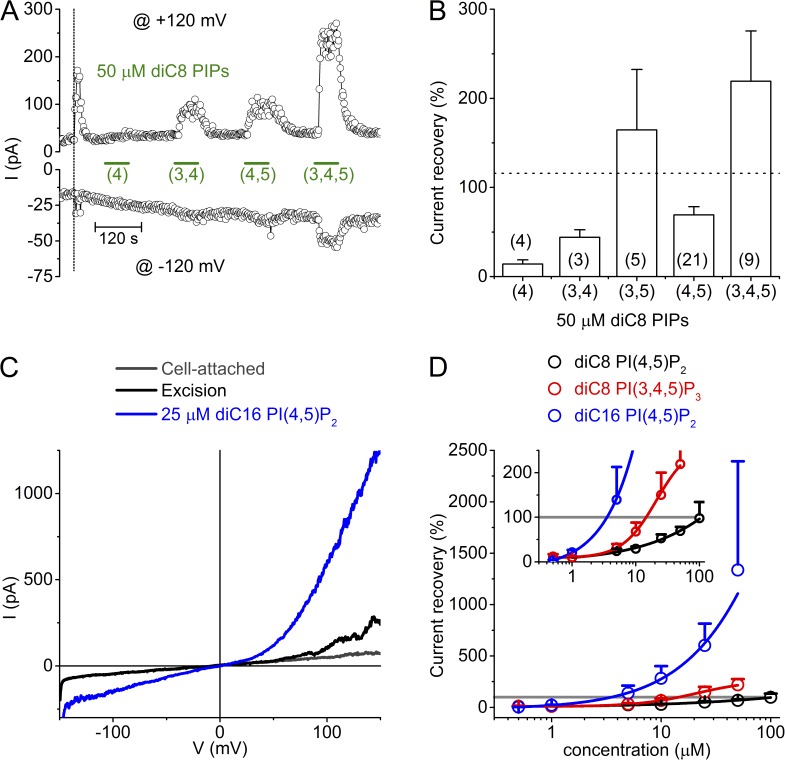
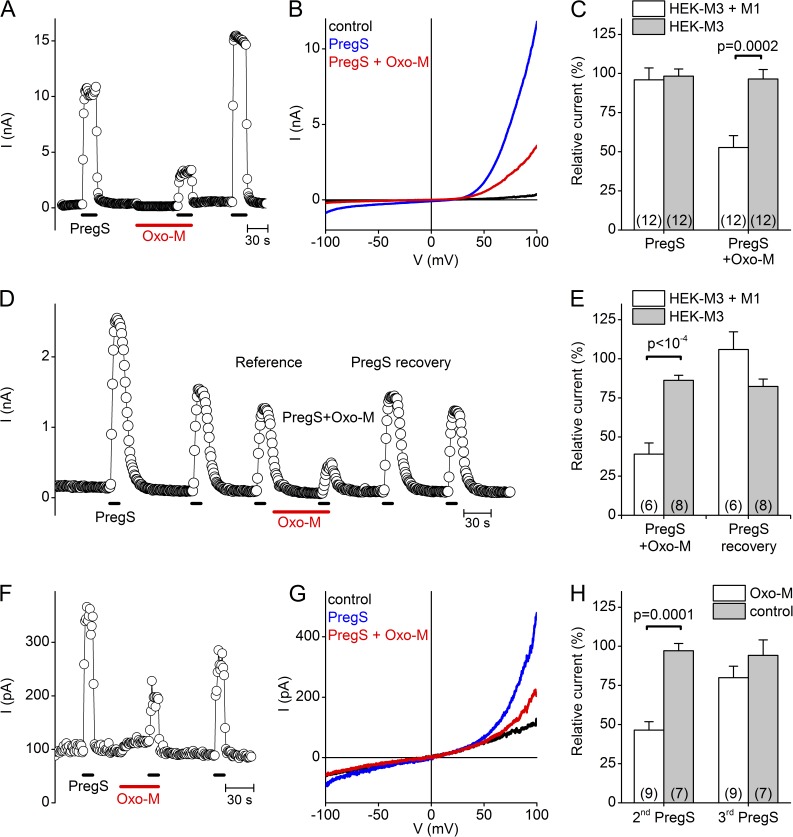
The transient receptor potential (TRP) channel TRPM3 is a calcium-permeable cation channel activated by heat and by the neurosteroid pregnenolone sulfate (PregS). TRPM3 is highly expressed in sensory neurons, where it plays a key role in heat sensing and inflammatory hyperalgesia, and in pancreatic β cells, where its activation enhances glucose-induced insulin release. However, despite its functional importance, little is known about the cellular mechanisms that regulate TRPM3 activity. Here, we provide evidence for a dynamic regulation of TRPM3 by membrane phosphatidylinositol phosphates (PIPs). Phosphatidylinositol 4,5-bisphosphate (PI[4,5]P2) and ATP applied to the intracellular side of excised membrane patches promote recovery of TRPM3 from desensitization. The stimulatory effect of cytosolic ATP on TRPM3 reflects activation of phosphatidylinositol kinases (PI-Ks), leading to resynthesis of PIPs in the plasma membrane. Various PIPs directly enhance TRPM3 activity in cell-free inside-out patches, with a potency order PI(3,4,5)P3 > PI(3,5)P2 > PI(4,5)P2 ≈ PI(3,4)P2 >> PI(4)P. Conversely, TRPM3 activity is rapidly and reversibly inhibited by activation of phosphatases that remove the 5-phosphate from PIPs. Finally, we show that recombinant TRPM3, as well as the endogenous TRPM3 in insuloma cells, is rapidly and reversibly inhibited by activation of phospholipase C-coupled muscarinic acetylcholine receptors. Our results reveal basic cellular mechanisms whereby membrane receptors can regulate TRPM3 activity.


Figures

Figure 1.
Figure 1.
Decay and recovery of TRPM3 activity in inside-out membrane patches. (A) Time course of TRPM3 currents at −120 and +120 mV in cell-attached mode and, after patch-excision, in cell-free inside-out patch from a HEK-M3 cell. TRPM3 was activated by inclusion of 100 µM PregS in the extracellular (pipette) solution. The vertical dotted line in this and subsequent panels indicates the time point of patch excision. Membrane patches were always excised into intracellular solution. (B) I-V traces at different time points as indicated in A. (C) Representative time course showing the effect of diC8 PI(4,5)P2 on TRPM3 currents measured in inside-out configuration. (D) I-V traces at different time points as indicated in C. (E) Representative time course showing the effect of 2 mM ATP on TRPM3 currents measured in inside-out configuration. (F) I-V traces at different time points as indicated in E. (G) Representative time course showing the effect of 2 mM ATP on TRPM3 current upon excision. (H) Representative time course comparing the effects of diC8 and brain derived natural PI(4,5)P2 applied to the cytoplasmic side of an inside-out excised membrane patch. (I) Maximal current recovery evoked by PI(4,5)P2 and ATP. Currents were normalized to the peak current upon excision. Numbers of individual membrane patches are indicated in parentheses.
Figure 2.
Figure 2.
ATP-induced recovery of TRPM3 requires PI-kinase activity. (A) Representative time course showing the lack of current recovery (<5%) upon ATP application in Mg2+-free solution. (B) Representative time course showing the lack of current recovery (<5%) upon application of AMPPCP (2 mM). (C and D) Representative time courses showing the rapid inhibition of TRPM3 activity by the PIP scavengers PLL (50 µg/ml) and Neomycin (5 mM) applied to the cytoplasmic side of inside-out membrane patches. (E) Statistical analysis of current inhibition at +120 mV by the various PIP scavenging agents. Values are given as percentage of the ATP-induced current recovery just before the application of the compound. P-values were determined by using one sample Student’s t test. (F and G) Representative time courses showing the impaired ATP-induced recovery of TRPM3 activity in the presence of the PI-kinase inhibitors wortmannin and LY294,002. (H) Comparison of the ATP-induced current recovery in the absence and presence of PI-kinase inhibitors. P-values were obtained by one-way ANOVA, with Bonferroni post-hoc test to compare with the inhibitor-free condition.
Figure 3.
Figure 3.
Effect of a translocatable PI 5-phosphatase on TRPM3 activity in HEK-M3 cells. (A) Fluorescence images showing the translocation of the PI(4,5)P2 sensor PLCδ1 PH-GFP (green) in HEK-M3 cells. These cells further expressed an FRB coupled plasma membrane linker (PM-FRB-CFP; not depicted) together with either mRFP-FKBP-5-ptase-dom (top; red) or mRFP-FKBP-only (bottom; red), before and after application of 1 µM rapamycin or 10 µM ionomycin. (B) Mean time course (n = 5 for each condition) of the normalized ratio between the GFP fluorescence in the cell center and the entire cell, as a measure of PLCδ1 PH-GFP translocation from plasma membrane to cytosol. (C) Two representative intracellular Ca2+ traces upon repetitive stimulation with PregS (10 µM) in HEK-M3 cells overexpressing PM-FRB-mRFP and mRFP-FKBP-5-ptase-dom, before and after rapamycin-induced PI(4,5)P2 breakdown. (D) Same as C, but in HEK cells expressing human TRPM8 instead of TRPM3, repetitively stimulated with menthol (50 µM). (E) Amplitude of the second-fourth calcium transients, normalized to the first calcium transient, for the indicated conditions. P values were obtained by unpaired Student’s t test, comparing with the mRFP-FKBP-only condition. (F) Representative time course of PregS-induced (40 µM) current inhibition upon rapamycin-induced PI(4,5)P2 breakdown in HEK-M3 cells. (G) Same as F, but in HEK cells expressing human TRPM8 instead of TRPM3, stimulated with menthol (50 µM). (H) Analysis of the effect of rapamycin-induced PI(4,5)P2 breakdown in HEK cells expressing either TRPM3 or TRPM8. PregS- and menthol-induced currents measured in the presence of rapamycin were normalized to the current measured just before the application of rapamycin. P values were obtained by one-way ANOVA and Bonferroni post-hoc test, comparing with the mRFP-FKBP-only condition or as indicated.
Figure 4.
Figure 4.
Effect of voltage-sensitive 5-phosphatases on TRPM3 whole-cell currents. (A) Representative time course of whole-cell currents measured at +120 mV in a cell coexpressing TRPM3 and Ci-VSP, illustrating the effect of changing holding potential from −70 to +90 mV (white and gray background, respectively). (B) I-V traces at different time points indicated in A. (C and D) Same as in A and B, except for a cell transfected with inactive mutant Ci-VSP-C363S. (E) Representative time course of whole-cell currents measured at +40 mV in a cell coexpressing TRPM3 and Dr-VSP, illustrating the effect of changing holding potential from −60 to +100 mV (white and gray background, respectively) using an intracellular solution containing 4 mM ATP. (F) Same as E, but using an intracellular solution containing 4 mM AMPPNP. (G) Comparison of relative currents measured at +120 mV and with a depolarizing holding potential (+90 mV) in cells expressing Ci-VSP and Ci-VSP-C363S. Currents were normalized to the currents measured at a −70-mV holding potential. P-values were obtained by unpaired Student’s t test. (H) Comparison of relative currents measured at +40 mV and with a depolarizing holding potential (+100 mV) in cells expressing TRPM3 without (control) or with Dr-VSP, for the conditions described in E and F. Current were normalized to the currents measured at a −60-mV holding potential. P-values were obtained by one-way ANOVA, with Bonferroni post-hoc.
Figure 5.
Figure 5.
Comparison of TRPM3 recovery by different PIPs. (A) Representative time course showing variable recovery of TRPM3 activity in an inside-out patch upon application of the indicated diC8 PIPs at a concentration of 50 µM. (B) Statistical analysis of the current recovery at +120 mV by 50 µM of the indicated diC8 PIPs. The dotted line indicates the mean recovery obtained with 2 mM ATP. Numbers of individual membrane patches are in parentheses. (C) Representative I-V curves showing the current response to 25 µM diC16 PI(4,5)P2. (D) Dose dependence of the effect of diC8 PI(4,5)P2, diC8 PI(3,4,5)P3 and diC16 PI(4,5)P2. Currents were normalized to the peak current upon excision (indicated by the gray line). n = 2–21/data point. Solid lines represent a logistic function fitted to the data. Since saturation could not be obtained at the highest testable concentrations, reliable EC50 values could not be obtained. The inset shows a magnification of the lower part of the dose–response graph, allowing estimation of the concentrations required to obtain 100% current recovery.
Figure 6.
Figure 6.
Reversible inhibition of whole-cell TRPM3 currents by muscarinic receptor stimulation. (A) Representative time course of whole-cell currents in a HEK-M3 cell heterologously expressing the M1 mAChR, illustrating the reversible effect of M1 stimulation by 20 µM Oxo-M in the presence of 10 mM BAPTA in the intracellular solution. (B) Representative I-V traces for the experiment in A. (C) Relative amplitude of the current response to the second PregS application, normalized to the mean of the first and third responses, comparing the effect of vehicle or Oxo-M in HEK-M3 cells with or without expression of the M1 mAChR. (D) Same as A, but in the presence of 5 mM EGTA instead of BAPTA in the intracellular solution. (E) Relative amplitude of the current response to PregS in the presence of Oxo-M and after the Oxo-M wash out, normalized to the PregS response before the Oxo-M application, showing the effect of Oxo-M on HEK-M3 cells with or without expressing the M1 mAChR. (F and G) Same as in A and B, except in an Ins1 cell, which endogenously expressed TRPM3 and mAChR. (H) Comparison of the relative current amplitude of the second and third (recovery) response to the initial PregS application, in cells stimulated with Oxo-M or vehicle. P-values in C, E, and H were obtained by unpaired Student’s t tests.

References

    1. Balla T. 2001. Pharmacology of phosphoinositides, regulators of multiple cellular functions. Curr. Pharm. Des. 7:475–507. 10.2174/1381612013397906 - DOI - PubMed
    1. Chen L., Chen W., Qian X., Fang Y., and Zhu N.. 2014. Liquiritigenin alleviates mechanical and cold hyperalgesia in a rat neuropathic pain model. Sci Rep. 4:5676. - PMC - PubMed
    1. Chuang H.H., Prescott E.D., Kong H., Shields S., Jordt S.E., Basbaum A.I., Chao M.V., and Julius D.. 2001. Bradykinin and nerve growth factor release the capsaicin receptor from PtdIns(4,5)P2-mediated inhibition. Nature. 411:957–962. 10.1038/35082088 - DOI - PubMed
    1. Collins M.D., and Gordon S.E.. 2013. Short-chain phosphoinositide partitioning into plasma membrane models. Biophys. J. 105:2485–2494. 10.1016/j.bpj.2013.09.035 - DOI - PMC - PubMed
    1. Czech M.P. 2000. PIP2 and PIP3: complex roles at the cell surface. Cell. 100:603–606. 10.1016/S0092-8674(00)80696-0 - DOI - PubMed

Publication types

MeSH terms