. 2015 Jun 30:6:7486.
doi: 10.1038/ncomms8486.

Metabolic and metagenomic outcomes from early-life pulsed antibiotic treatment

Affiliations

Metabolic and metagenomic outcomes from early-life pulsed antibiotic treatment

Yael R Nobel et al. Nat Commun. .

Abstract

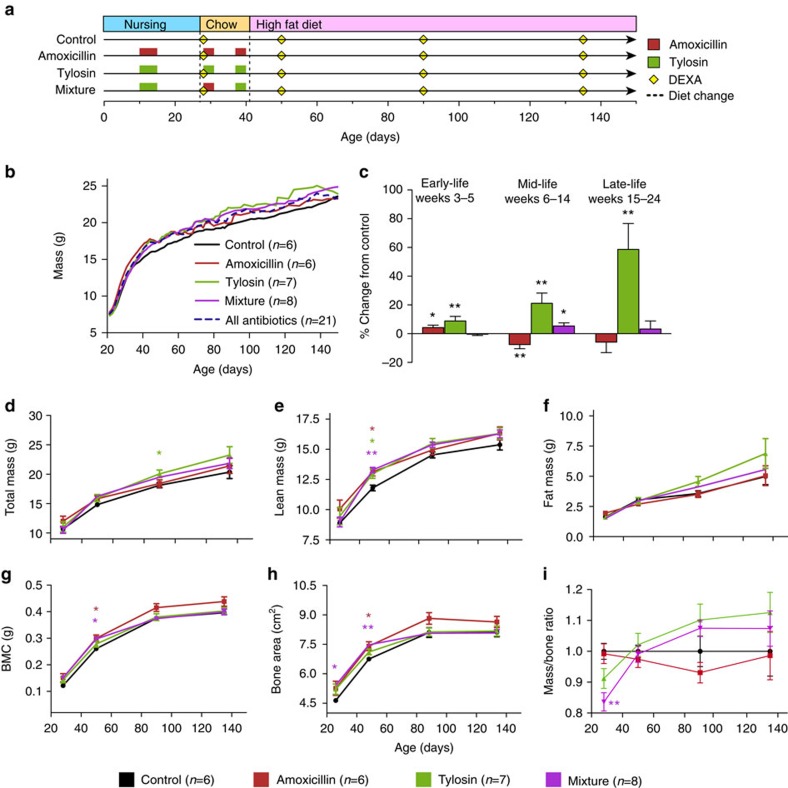
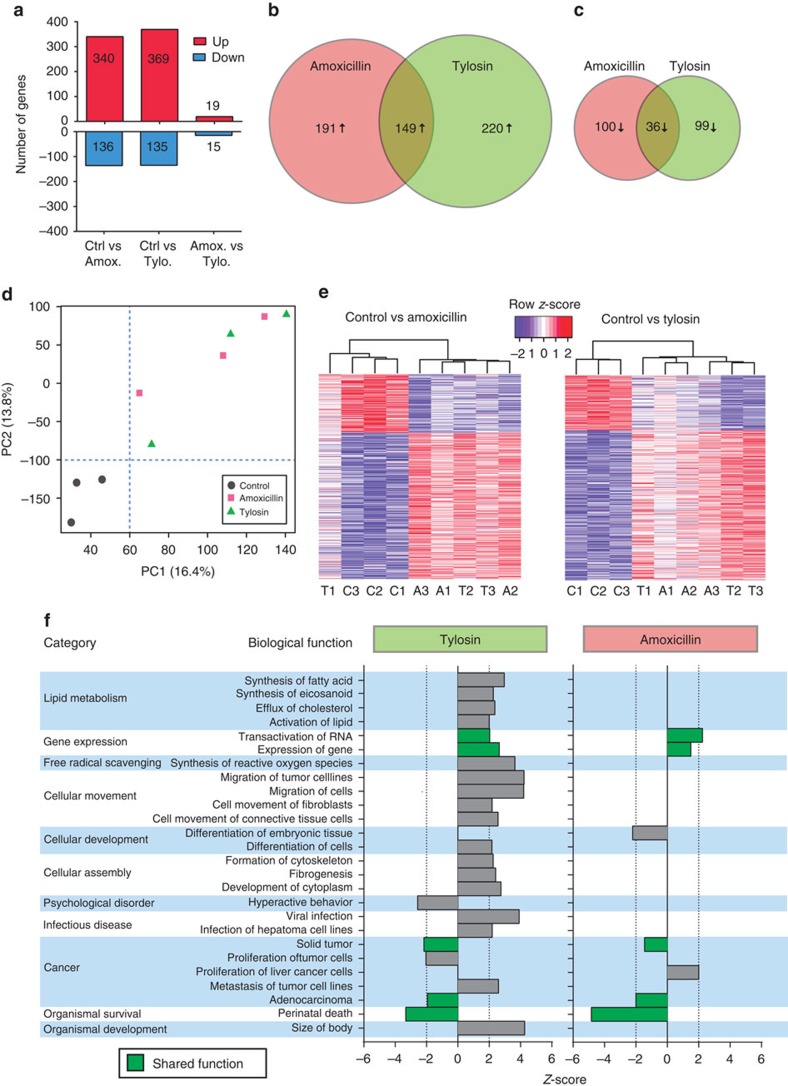
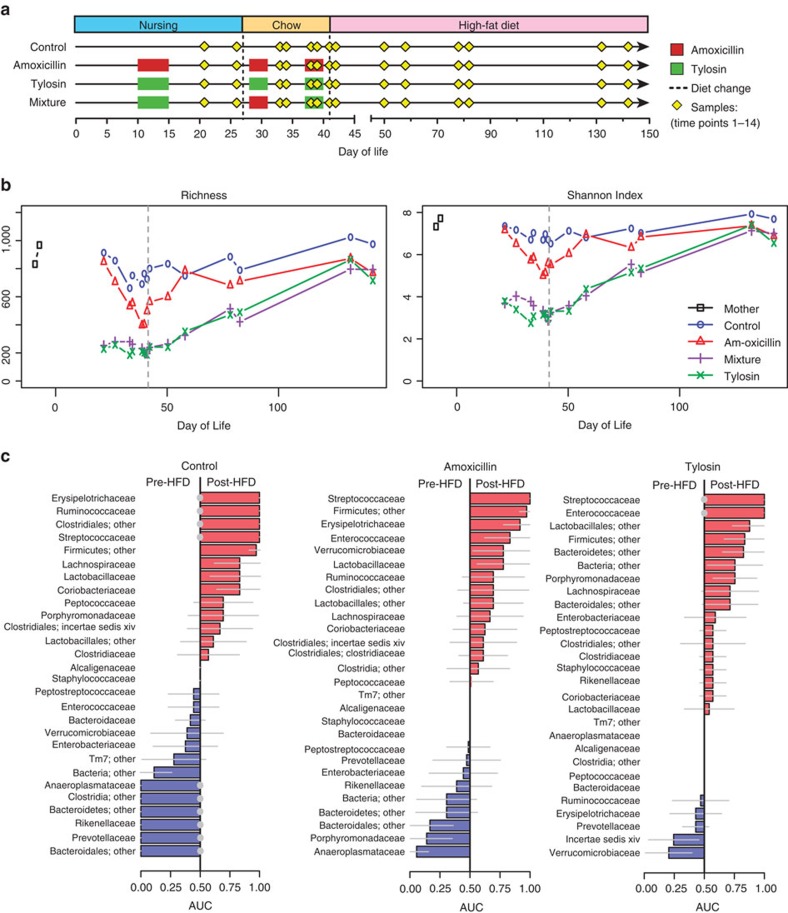
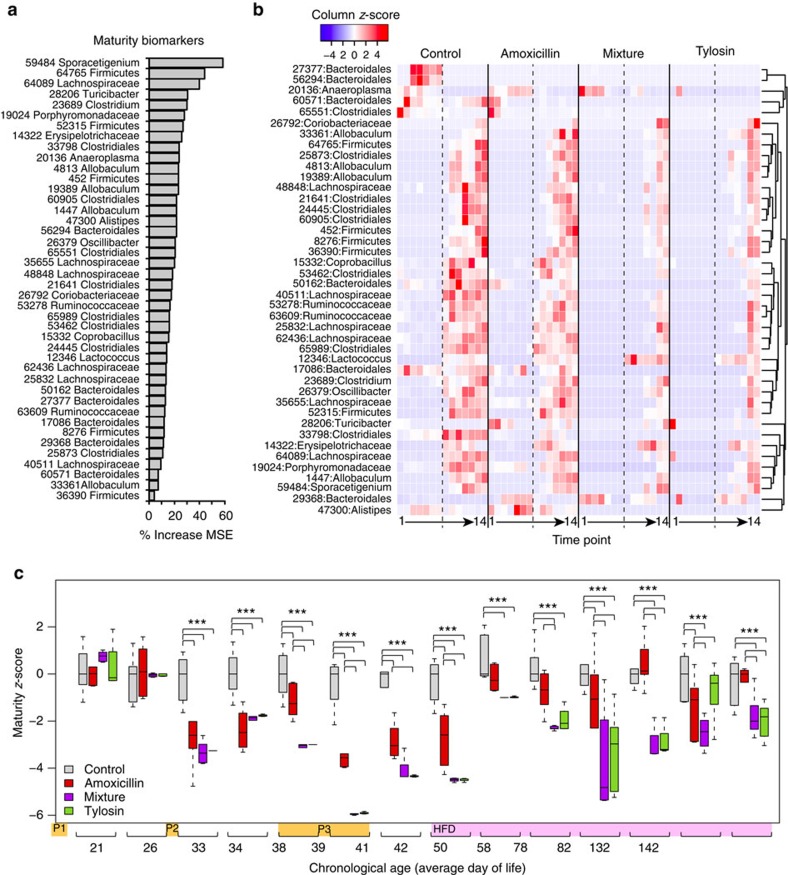
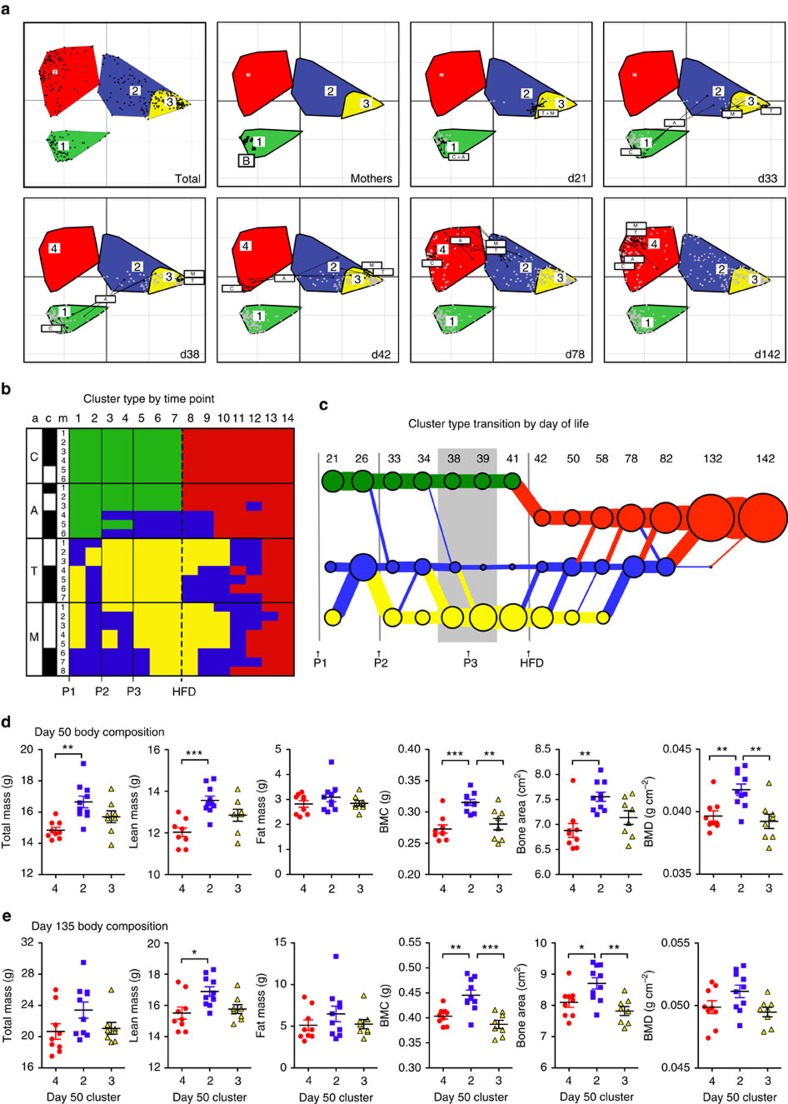
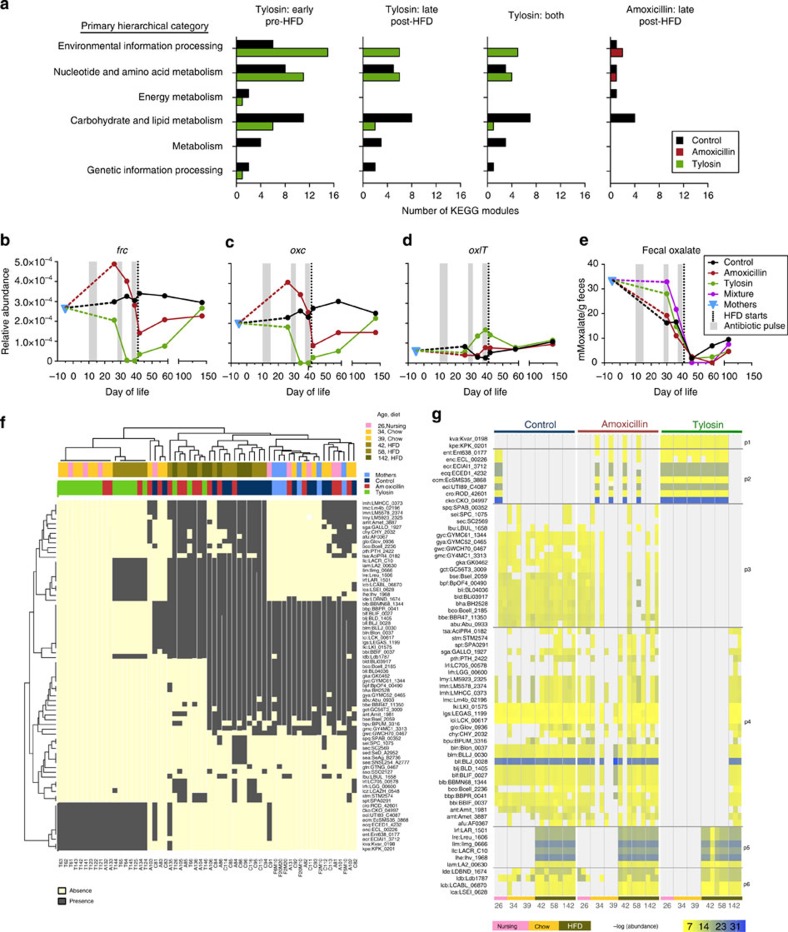
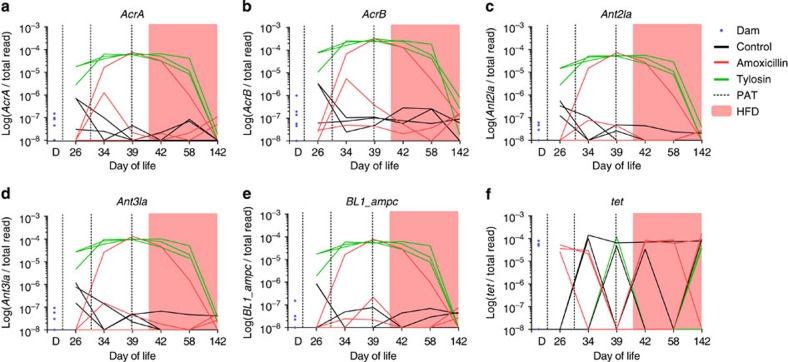
Mammalian species have co-evolved with intestinal microbial communities that can shape development and adapt to environmental changes, including antibiotic perturbation or nutrient flux. In humans, especially children, microbiota disruption is common, yet the dynamic microbiome recovery from early-life antibiotics is still uncharacterized. Here we use a mouse model mimicking paediatric antibiotic use and find that therapeutic-dose pulsed antibiotic treatment (PAT) with a beta-lactam or macrolide alters both host and microbiota development. Early-life PAT accelerates total mass and bone growth, and causes progressive changes in gut microbiome diversity, population structure and metagenomic content, with microbiome effects dependent on the number of courses and class of antibiotic. Whereas control microbiota rapidly adapts to a change in diet, PAT slows the ecological progression, with delays lasting several months with previous macrolide exposure. This study identifies key markers of disturbance and recovery, which may help provide therapeutic targets for microbiota restoration following antibiotic treatment.


Figures

Figure 1
Figure 1. Effect of PAT on growth.
(a) Timeline of antibiotic pulses and dietary changes. (b) Scale weight of mice. (c) Growth rates in early-, mid-, and late-life expressed as percent difference from control. (d–h) Dual energy X-ray absorptiometry measurements. (d–f) Total, lean and fat mass; (g) bone mineral content (BMC) and (h) bone area. (i) Calculated total body mass-to-bone area ratio is represented as a fraction of control. *P<0.05, **P<0.01, ANOVA with Dunnett's post test. (c–h) Bars represent standard error of the mean. Number of mice: control, n=6; amoxicillin, n=6; tylosin, n=7 and mixture, n=8.
Figure 2
Figure 2. PAT alters hepatic gene expression.
(a) Number of differentially expressed genes (P<0.01 and |log2fold change|>0.5) that are up- or down-regulated in the underlined group with respect to the comparator group. (b,c) Venn diagrams showing numbers of upregulated or downregulated genes, respectively, that are shared or unique. (d) Principal component analysis plot of hepatic gene expression data, representing 30.2% of total variation. (e) Expression of hepatic genes significantly altered by amoxicillin or tylosin with respect to control. (f) Predicted biological functions that are differentially represented (P<0.05, z-score |2|) based on Ingenuity Pathway Analysis of hepatic expression. Amox., amoxicillin; Ctrl, control; Tylo., tylosin.
Figure 3
Figure 3. Ecological outcomes from early-life PAT and response to dietary intervention.
(a) Experimental design and timing of microbiota samples. (b) α-diversity measured at a coverage depth of 3,000 sequences per sample. (c) Differentiating bacterial families immediately before and after introduction of HFD. Area-under-curve (AUC) with 95% confidence intervals (grey lines) for differentiating pre-HFD and post-HFD mice is plotted by treatment group in major families (>1% relative abundance in at least one mouse). Significantly predictive results (Mann–Whitney test) after false-discovery rate correction (q<0.05) are indicated by grey-filled circles.
Figure 4
Figure 4. The effect of early-life PAT on microbiota maturity and dietary responses.
(a) The OTUs that predict maturity and explained the greatest degree of variation in the model, ranked by contribution to reduction of mean square error (MSE). (b) Abundance of predictive OTUs over time. Dashed lines indicate introduction of HFD, time points 1–14 correspond to sequential samples (correlating with increasing day of life). (c) Average MAZ over time; z-score=0 indicates appropriate maturation; higher or lower z-scores indicate accelerated or delayed microbiota development, respectively. *** P<0.001 one-way ANOVA with Fisher's least significant difference adjusted for false-discovery rate.
Figure 5
Figure 5. Dynamics of disruption, recovery and response to HFD.
(a) Community structure over time within the four clusters identified by Calinski analysis shown for mothers and for pups at selected representative time points: after the first, second and third antibiotic pulses and after starting HFD. (b) Cluster assignment by mouse and time point. a, antibiotic group; c, cage (bars indicate mice in the same cage); m, mouse. Time points 1–14 correspond to sequential samples (correlating with increasing day of life). (c) Microbiota transition map, circles and lines are scaled to represent number of mice in each cluster (circle) or transitioning (line) between clusters. (d,e), Body composition grouped by day 50 cluster type at ∼50 days of life (d) and at ∼135 days of life (e). *P<0.05, **P<0.01, ***P<0.001, ANOVA with Tukey-post test. C, control; A, amoxicillin; T, tylosin; M, mother.
Figure 6
Figure 6. Metagenomic alterations from early-life PAT.
(a) Number of KEGG modules significantly upregulated in PAT and control mice (P<0.05, LEfSe). No modules were significantly different between control and amoxicillin in early life. (b–d) Median relative abundance of oxalate metabolism genes over time. (b) frc, formyl-CoA transferase, (c) oxc, oxalyl-CoA decarboxylase and (d) oxlT, oxalate/formate exchanger. (e) Faecal oxalate levels. (f) Hierarchical clustering of 73 host-associated microbial oxlT orthologs (rows) and the associated 60 shotgun sequencing samples (columns). NC, normal chow. (g) Relative abundance of 67 oxlt orthologs; each cluster group shows a unique presence pattern by condition, diet and time.
Figure 7
Figure 7. Selection for antibiotic resistance genes in the intestinal metagenome.
Frequency of specified antibiotic resistance genes (a–f) that were detected in dams, controls, amoxicillin and tylosin mice, shown in relation to the total number of sequence reads for that sample is shown. Dotted lines, antibiotic pulses; pink, HFD.

References

    1. Hicks L. A. et al. US outpatient antibiotic prescribing variation according to geography, patient population, and provider specialty in 2011. Clin. Infect. Dis. 60, 1308–1316 (2015). - PubMed
    1. Hersh A. L., Shapiro D. J., Pavia A. T. & Shah S. S. Antibiotic prescribing in ambulatory pediatrics in the United States. Pediatrics 128, 1053–1061 (2011). - PubMed
    1. Gerber J. S. et al. Variation in antibiotic prescribing across a pediatric primary care network. J. Pediatr. Infect. Dis. Soc. piu086 (2014). - PMC - PubMed
    1. Ternhag A. & Hellman J. More on U.S. outpatient antibiotic prescribing, 2010. N. Engl. J. Med. 369, 1175–1176 (2013). - PubMed
    1. Dellit T. H. et al. Infectious Diseases Society of America and the Society for Healthcare Epidemiology of America guidelines for developing an institutional program to enhance antimicrobial stewardship. Clin. Infect. Dis. 44, 159–177 (2007). - PubMed

Publication types

MeSH terms