. 2015 Jul 14;112(28):8732-7.
doi: 10.1073/pnas.1505374112. Epub 2015 Jun 29.

Drug-eluting microarrays to identify effective chemotherapeutic combinations targeting patient-derived cancer stem cells

Affiliations

Drug-eluting microarrays to identify effective chemotherapeutic combinations targeting patient-derived cancer stem cells

Matthew R Carstens et al. Proc Natl Acad Sci U S A. .

Abstract

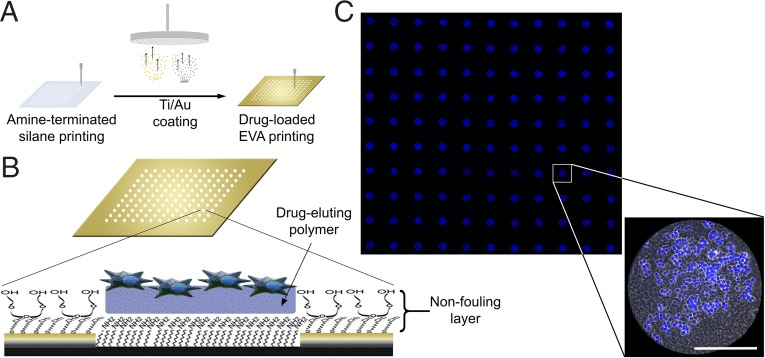
A new paradigm in oncology establishes a spectrum of tumorigenic potential across the heterogeneous phenotypes within a tumor. The cancer stem cell hypothesis postulates that a minute fraction of cells within a tumor, termed cancer stem cells (CSCs), have a tumor-initiating capacity that propels tumor growth. An application of this discovery is to target this critical cell population using chemotherapy; however, the process of isolating these cells is arduous, and the rarity of CSCs makes it difficult to test potential drug candidates in a robust fashion, particularly for individual patients. To address the challenge of screening drug libraries on patient-derived populations of rare cells, such as CSCs, we have developed a drug-eluting microarray, a miniaturized platform onto which a minimal quantity of cells can adhere and be exposed to unique treatment conditions. Hundreds of drug-loaded polymer islands acting as drug depots colocalized with adherent cells are surrounded by a nonfouling background, creating isolated culture environments on a solid substrate. Significant results can be obtained by testing <6% of the cells required for a typical 96-well plate. Reliability was demonstrated by an average coefficient of variation of 14% between all of the microarrays and 13% between identical conditions within a single microarray. Using the drug-eluting array, colorectal CSCs isolated from two patients exhibited unique responses to drug combinations when cultured on the drug-eluting microarray, highlighting the potential as a prognostic tool to identify personalized chemotherapeutic regimens targeting CSCs.

Keywords: cancer stem cell; chemopredictive; combination therapy; microarray; personalized medicine.


Conflict of interest statement

The authors declare no conflict of interest.

Figures

Fig. 1.
Fig. 1.
Drug-eluting cellular microarrays. (A) Fabrication. Glass coverslips are robotically printed with amine-terminated silane in isolated spots and then coated with titanium and gold. Processing exposes silane-grafted islands, whereas the gold region is passivated by the addition of a nonfouling PEG background (32). Drug-loaded EVA is then printed over the exposed silane islands, and amine groups promote polymer adhesion. Finally, poly-d-lysine is overspotted on the EVA films to promote cell adhesion before seeding. (B) Schematic of a single spot highlighting the substrate architecture, the chemistry of the nonfouling PEG coating, and the drug-eluting polymer with cells adherent (not to scale). (C) Fluorescence microscopy mosaic image of a 10 × 11 microarray seeded with HCT116 colon carcinoma cells, illustrating the fidelity of cell adhesion to isolated islands of drug-eluting polymer films. Shown is a detail of a single drug-eluting island demonstrating adherent cells (phase- contrast image overlay with nuclear staining in blue). The EVA film is fabricated using a water-oil emulsion to promote uniform film thickness during drying, and has a mottled appearance. (Scale bar: 200 μm.)
Fig. 2.
Fig. 2.
Cumulative drug release and HCT116 cell responses to drug-loaded microarrays. (A) Nutlin-3a release profile from microarray revealed a burst release of ∼8 h, followed by a steady release rate over 5 d. Release profiles show mean ± SD of three replicates, and data are fitted using an exponential decay model. (B) Percent of nonproliferative HCT116 cells on nutlin-3a–loaded microarray increases with increasing drug loading concentration. Proliferation was quantified via BrdU incorporation, and data are normalized to an unloaded control. Significant differences were determined by ANOVA [F(4,138) = 19.068; P < 0.05], followed by Tukey’s post hoc analysis. (C) Representative fluorescence micrographs of nonproliferating cells on a 25 μΜ nutlin-3a–loaded polymer island (evidenced by low BrdU staining). (D) Representative fluorescence micrographs of an unloaded control island with highly proliferative cells (demonstrating high BrdU staining). (E) Camptothecin release profile from microarray revealing a burst release of ∼24 h, followed by a steady release rate over 5 d. Release profiles show mean ± SD of three replicates, and data are modeled using exponential decay. (F) Percent of apoptotic cells on camptothecin-loaded microarray increases with increasing drug loading concentrations. Apoptosis was quantified by annexin V staining, and significant differences were determined by ANOVA [F(4,479) = 52.778; P < 0.05], followed by Tukey’s post hoc analysis. (G) Representative fluorescence micrographs displaying high levels of cells undergoing apoptosis on a 10 μΜ camptothecin-loaded polymer island (demonstrating high annexin V staining). (H) Representative fluorescence micrographs of an unloaded control island with low levels of apoptotic cells (showing low annexin V staining). (I) Schematic of a single factor dosing array layout with increasing drug loading concentrations. (J) Schematic of a randomized single factor array with loading concentrations configured in randomized fashion. (K) Statistical comparison of cell apoptosis between randomized and nonrandomized single drug array configurations demonstrating the results are independent of array configuration (n = 3). This indicates that there is negligible cellular cross-talk and drug interaction between neighboring islands. (L) Schematic of a randomized two-factor dosing array used in combinatorial microarrays. Patterns represent the 16 different combinations of two drugs (four concentrations per drug). *P < 0.05 compared with all other conditions; #P < 0.05 compared with control. (Scale bar: 200 μM.)
Fig. 3.
Fig. 3.
Patient-derived CA1 colorectal cancer stem-like cell proliferation and dose–response curves from combinatorially loaded drug-eluting microarrays. (A) Proliferation of CA1 cells on drug-eluting cellular microarrays. Loading concentrations of nutlin-3a [F(3,233) = 5.762; P < 0.05] and camptothecin [F(3,233) = 16.884; P < 0.05] affected antiproliferative activity, as determined by ANOVA. Subadditive effects were observed from combination treatments, as evidenced by the greater decrease in proliferation from higher concentration combinations compared with the highest concentrations of either nutlin-3a or camptothecin alone. Error bars represent SEM. (B–E) Dose–response curves for fixed camptothecin concentrations of 0, 1, 10, and 50 μM over a range of nutin-3a concentrations. There was no significant change in Emax values of the nutlin-3a response with the added presence of camptothecin; however, there was a significant increase (by 75%) in the sensitivity to nutlin-3a when combined with 10 μΜ camptothecin compared with nutlin-3a alone (28.6 vs. 50.0; SI Appendix, Fig. S15), indicative of an increase in antiproliferative activity. (F–I) Dose–response curves for fixed nutlin-3a concentrations of 0, 1, 25, and 125 μM, with a range of camptothecin concentrations. Although Emax values generally increased with added nutlin-3a, the values were not significantly different. Similarly, differences in sensitivity to camptothecin owing to the addition of nutlin-3a were not observed. Proliferation data were transformed to nonproliferation data by subtracting the former from 100%. *P < 0.05 compared with 0 μM drug.
Fig. 4.
Fig. 4.
Patient-derived CA2 CCSC proliferation and dose–response curves from combinatorially loaded drug-eluting microarrays. (A) Proliferation of CA2 cells on drug-eluting cellular microarrays. Antiproliferative activity was increased from exposure to camptothecin [F(3,81) = 5.987; P < 0.05] and nutlin-3a [F(3,82) = 7.525; P < 0.05] as revealed by ANOVA, with a significant interaction effect between drugs [F(9,329) = 2.382; P < 0.05]. Combination treatments did not improve antiproliferative activity. In fact, an antagonistic effect was observed from combination treatments, in which increasing the concentrations of both drugs reversed drug-induced nonproliferation compared with high doses of individual drugs. Error bars represent SEM. (B–E) Dose–response curves for fixed camptothecin concentrations of 0, 1, 10, and 50 μM over a range of nutin-3a concentrations. There was a 90% decrease in the Emax values of the response to nutlin-3a in the presence of 10 μM camptothecin compared with 0 μM camptothecin (5.7 vs. 59.0; SI Appendix, Fig. S17), and a decrease of 114% in the Emax values with the addition of 50 μM (−8.3 vs. 59.0; SI Appendix, Fig. S17), indicating a decrease in antiproliferative activity. (E) The negative slope of the response curve for 50 μM camptothecin is indicative of an antagonistic drug interaction. (F–I) Dose–response curves for fixed nutlin-3a concentrations of 0, 1, 25, and 125 μM with a range of camptothecin concentrations. The response curves to ranges of camptothecin in the presence of fixed amounts of nutlin-3a reveal decreased Emax values, but the values were not significantly different (SI Appendix, Fig. S17). (H) Notably, the sensitivity of CA2 CCSCs to camptothecin decreased by 100-fold with the addition of just 1 μM nutlin-3a (133 for 0 µM nutlin compared with 1.6 for 1 µM nutlin; SI Appendix, Fig. S17). (I) The negative slope of the response curve for 50 μM camptothecin is indicative of an antagonistic drug interaction. Proliferation data were transformed to nonproliferation data by subtracting the former from 100%. *P < 0.05 compared with 0 μM drug.

References

    1. Reya T, Morrison SJ, Clarke MF, Weissman IL. Stem cells, cancer, and cancer stem cells. Nature. 2001;414(6859):105–111. - PubMed
    1. Huang EH, Heidt DG, Li CW, Simeone DM. Cancer stem cells: A new paradigm for understanding tumor progression and therapeutic resistance. Surgery. 2007;141(4):415–419. - PubMed
    1. Soen Y, Chen DS, Kraft DL, Davis MM, Brown PO. Detection and characterization of cellular immune responses using peptide-MHC microarrays. PLoS Biol. 2003;1(3):E65. - PMC - PubMed
    1. Soen Y, Mori A, Palmer TD, Brown PO. Exploring the regulation of human neural precursor cell differentiation using arrays of signaling microenvironments. Mol Syst Biol. 2006;2:37. - PMC - PubMed
    1. Flaim CJ, Chien S, Bhatia SN. An extracellular matrix microarray for probing cellular differentiation. Nat Methods. 2005;2(2):119–125. - PubMed

Publication types

MeSH terms

LinkOut - more resources