. 2015 Jul 21;112(29):8987-92.
doi: 10.1073/pnas.1414495112. Epub 2015 Jun 29.

Statistical universals reveal the structures and functions of human music

Affiliations

Statistical universals reveal the structures and functions of human music

Patrick E Savage et al. Proc Natl Acad Sci U S A. .

Abstract

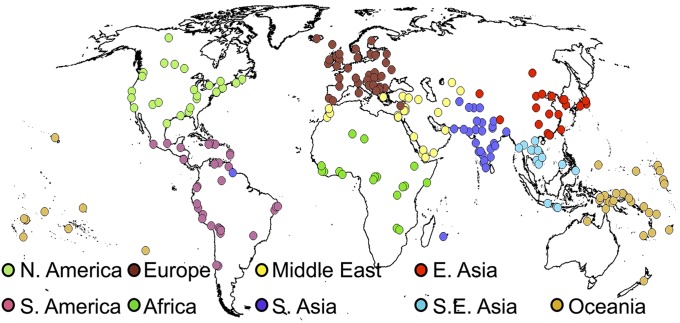
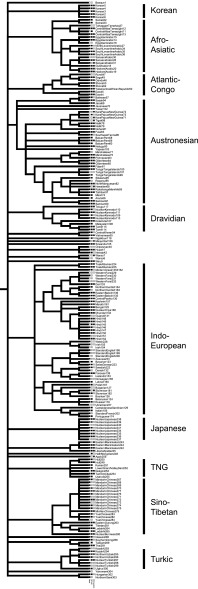
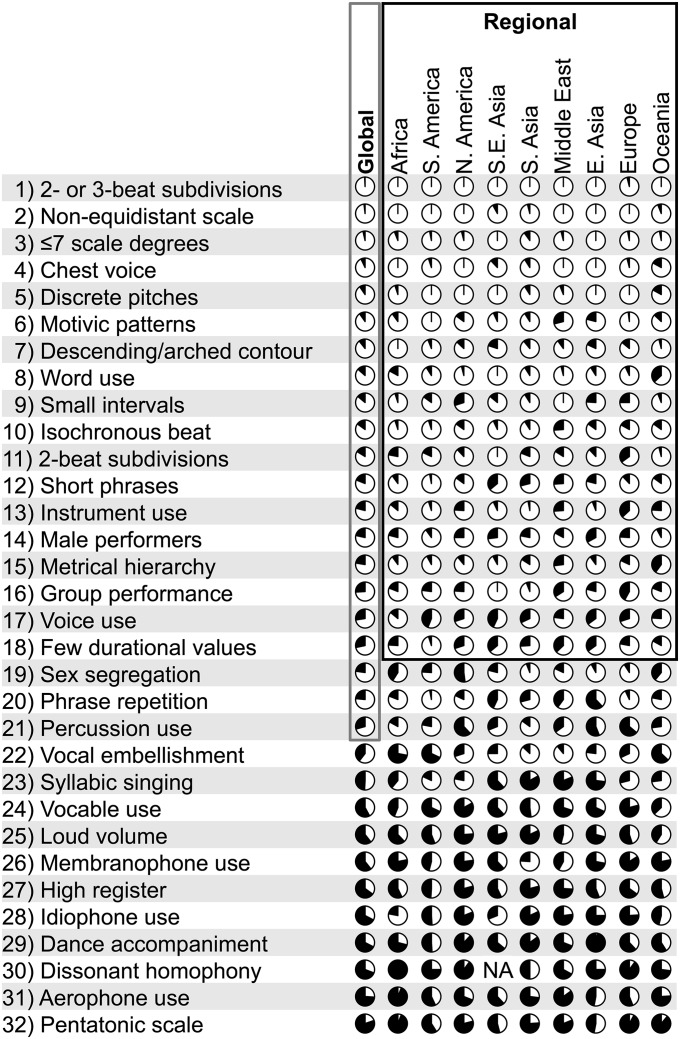
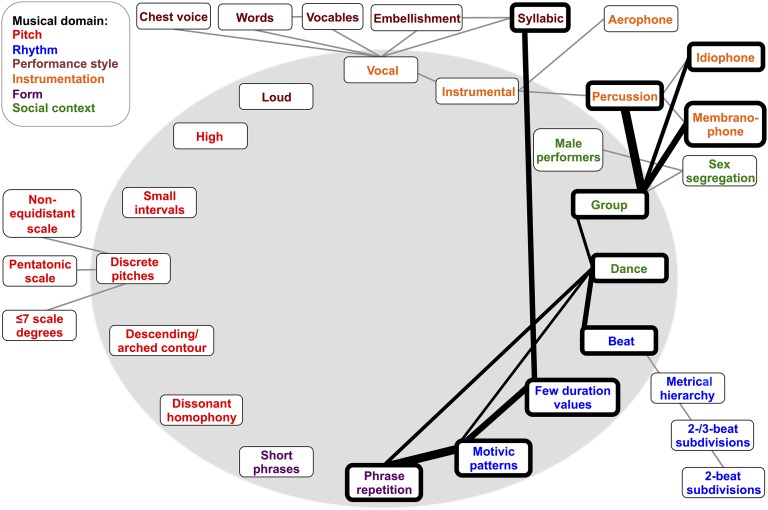
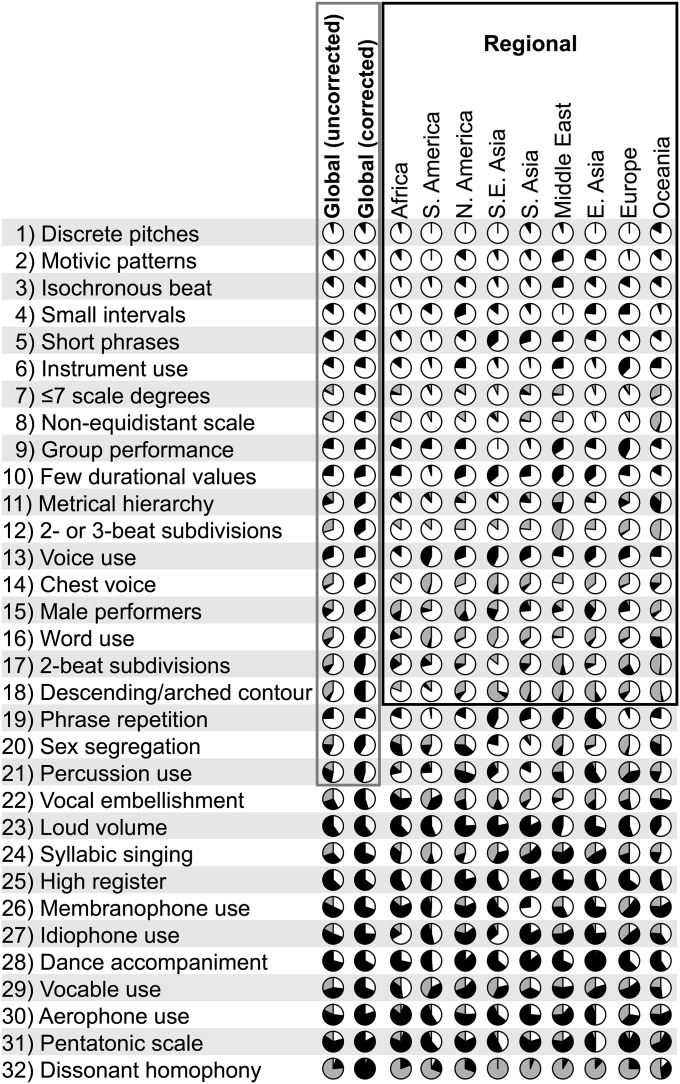
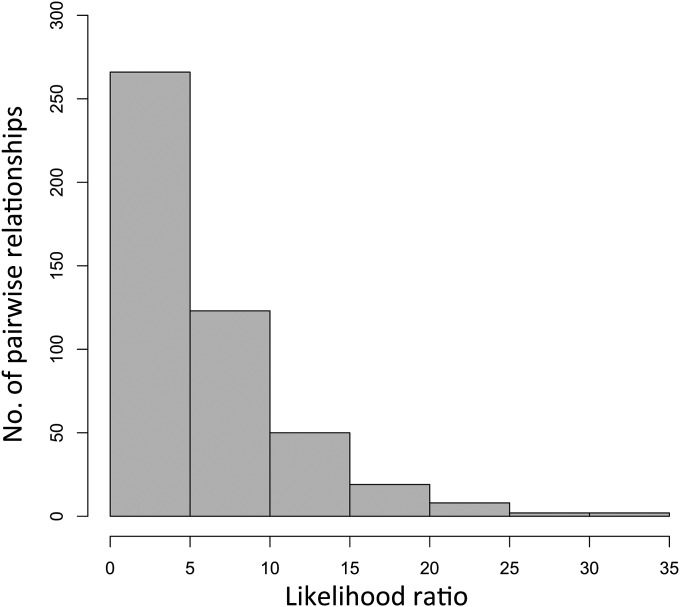
Music has been called "the universal language of mankind." Although contemporary theories of music evolution often invoke various musical universals, the existence of such universals has been disputed for decades and has never been empirically demonstrated. Here we combine a music-classification scheme with statistical analyses, including phylogenetic comparative methods, to examine a well-sampled global set of 304 music recordings. Our analyses reveal no absolute universals but strong support for many statistical universals that are consistent across all nine geographic regions sampled. These universals include 18 musical features that are common individually as well as a network of 10 features that are commonly associated with one another. They span not only features related to pitch and rhythm that are often cited as putative universals but also rarely cited domains including performance style and social context. These cross-cultural structural regularities of human music may relate to roles in facilitating group coordination and cohesion, as exemplified by the universal tendency to sing, play percussion instruments, and dance to simple, repetitive music in groups. Our findings highlight the need for scientists studying music evolution to expand the range of musical cultures and musical features under consideration. The statistical universals we identified represent important candidates for future investigation.

Keywords: cross-cultural universals; cultural phylogenetics; ethnomusicology; evolution; group coordination.


Conflict of interest statement

The authors declare no conflict of interest.

Figures

Fig. 1.
Fig. 1.
The 304 recordings from the Garland Encyclopedia of World Music show a widespread geographic distribution. They are grouped into nine regions specified a priori by the Encyclopedia’s editors, as color-coded in the legend at bottom: North America (n = 33 recordings), Central/South America (39), Europe (40), Africa (21), the Middle East (35), South Asia (34), East Asia (34), Southeast Asia (14), and Oceania (54).
Fig. S1.
Fig. S1.
Historical relationships, based on Glottolog classifications of the languages spoken by the performers, for the 201 recordings in the indigenous subsample used for the phylogenetic analyses (i.e., excluding 103 recordings showing evidence of horizontal transmission). In this figure, the branch lengths are arbitrary (i.e., they do not represent information about degree of evolutionary change). The tree reveals important sources of statistical nonindependence in the sample that need to be controlled for in our assessment of statistical universals. As an example, the joint distribution of isochronous beat, group performance, and use of percussion instruments is mapped onto the tree. Black squares represent presence of each feature, white squares represent absence, and no square represents a coding of NA.
Fig. S2.
Fig. S2.
Phylogeny of languages relating to the indigenous subsample of recordings under the differing assumptions of (A) equal branch lengths, (B) Nee’s, (C) Grafen’s and (D) Pagel’s methods of assigning branch lengths.
Fig. 2.
Fig. 2.
Pie charts for the 32 musical features organized according to their frequencies. White slices indicate presence, and black slices indicate absence. [NA (not applicable) codings do not contribute to these analyses; see Fig. S3 for an alternate visualization that includes NAs.] Features whose phylogenetically controlled global frequencies were significantly greater than 0.5 are highlighted using a gray box, and features with frequencies greater than 0.5 in each of the nine regions are highlighted using a black box. Note that vocal embellishment and syllabic singing have global frequencies whose values are slightly greater than 0.5, but not significantly so (SI Methods). The pie chart for dissonant homophony in Southeast Asia is not included because all 14 recordings from this region were coded as NA.
Fig. 3.
Fig. 3.
Universal relationships between the 32 musical features. Features are color-coded by musical domain (see legend at top left). The 16 nonnested features are distributed around the shaded oval, and the remaining 16 nested features outside the oval require one of the former features by definition. Dependent relationships implied by definition are highlighted using gray lines and were excluded from the analyses. Black lines indicate universal relationships that were significant after controlling for phylogenetic relationships and whose directions were consistent across all nine regions, with the width of each line proportional to the strength of the LR statistic from the phylogenetic coevolutionary analysis (see Table S1 for all pairwise LR values). Ten features (highlighted using bold boxes) formed a single interconnected network joined by one or more universal relationships.
Fig. S3.
Fig. S3.
Alternate version of Fig. 2 that also visualizes the frequency of NA codings using gray slices. Because of complications involved in modeling NA values (SI Methods), NA values were treated as 0s for the phylogenetically corrected column. For comparison, the global distribution of presence, absence, and NA values without correcting for phylogeny is also shown. Note that features 15–18 have one or more regions where presence does not outnumber absence and NA codings combined, but presence still outnumbers absence in all regions. Presence also still outnumbers both absence and NA codings combined on a global level.
Fig. S4.
Fig. S4.
A histogram showing LR values from the phylogenetic comparative analysis of all possible pairwise relationships between the 32 candidate musical features. Of the 496 possible pairwise relationships, 25 are not shown because they were dependent by definition. LR values greater than 9.49 are significant (SI Methods).

Comment in

  • Cross-cultural convergence of musical features.
    Trehub SE. Trehub SE. Proc Natl Acad Sci U S A. 2015 Jul 21;112(29):8809-10. doi: 10.1073/pnas.1510724112. Epub 2015 Jul 8. Proc Natl Acad Sci U S A. 2015. PMID: 26157132 Free PMC article. No abstract available.

Similar articles

Cited by

References

    1. Pagel M, Mace R. The cultural wealth of nations. Nature. 2004;428(6980):275–278. - PubMed
    1. Brown DE. Human Universals. Temple Univ Press; Philadelphia: 1991.
    1. Barkow JH, Cosmides L, Tooby J, editors. The Adapted Mind: Evolutionary Psychology and the Generation of Culture. Oxford Univ Press; New York: 1992.
    1. Shepard RN. Perceptual-cognitive universals as reflections of the world. Psychon Bull Rev. 1994;1(1):2–28. - PubMed
    1. Longfellow HW. Outre-mer: A Pilgrimage Beyond the Sea. Harper; New York: 1835.

Publication types

LinkOut - more resources