. 2015 Jul 14;112(28):8726-31.
doi: 10.1073/pnas.1501029112. Epub 2015 Jun 29.

Notch1-STAT3-ETBR signaling axis controls reactive astrocyte proliferation after brain injury

Affiliations

Notch1-STAT3-ETBR signaling axis controls reactive astrocyte proliferation after brain injury

Matthew D LeComte et al. Proc Natl Acad Sci U S A. .

Abstract

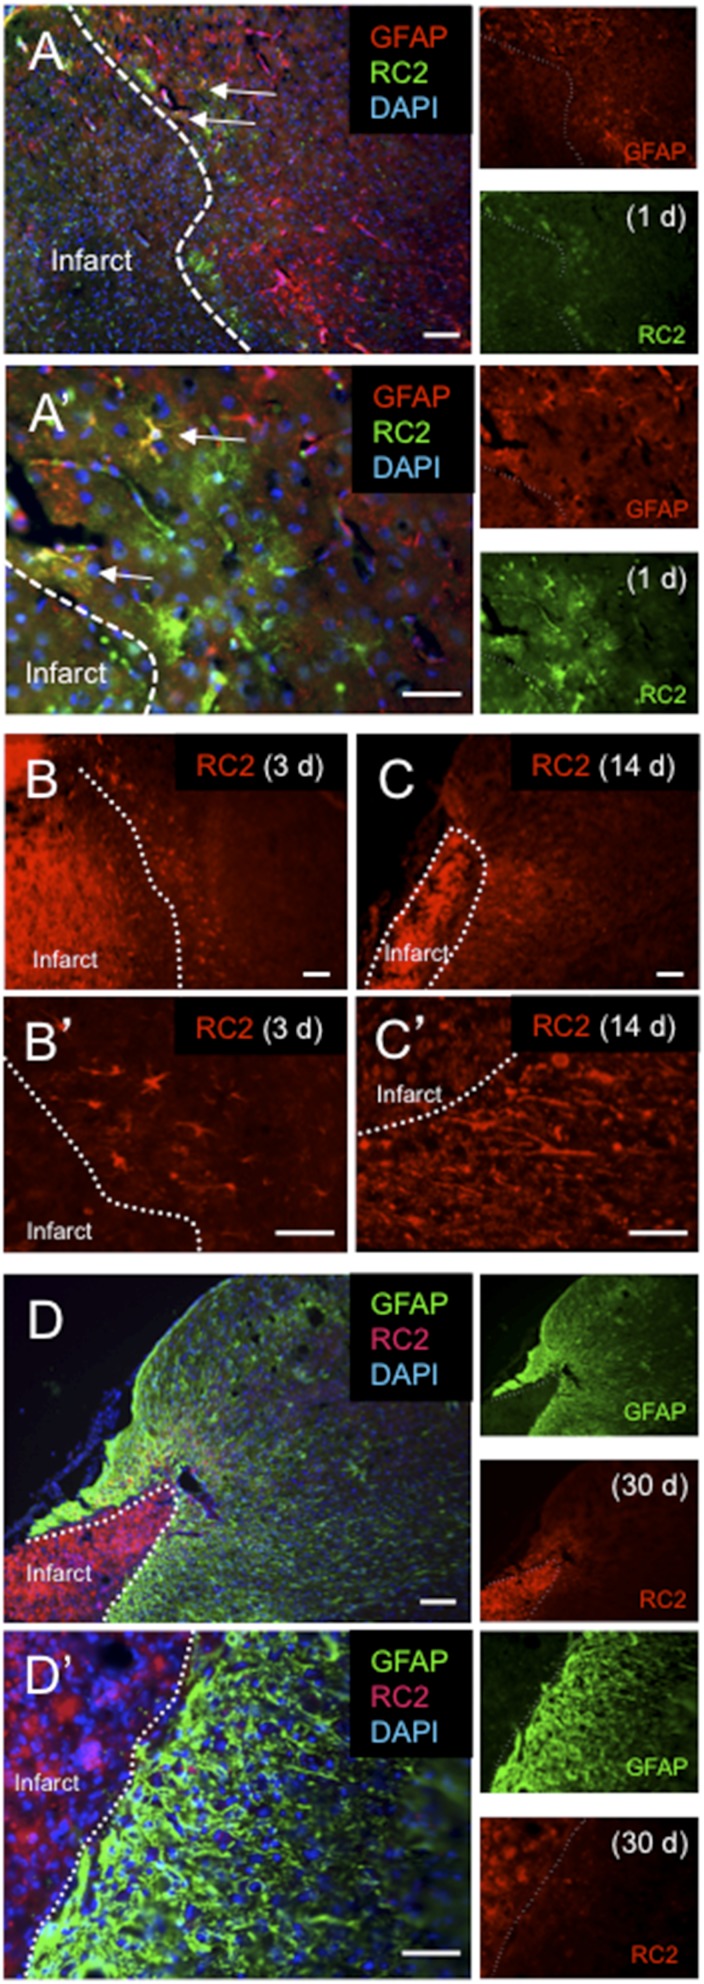
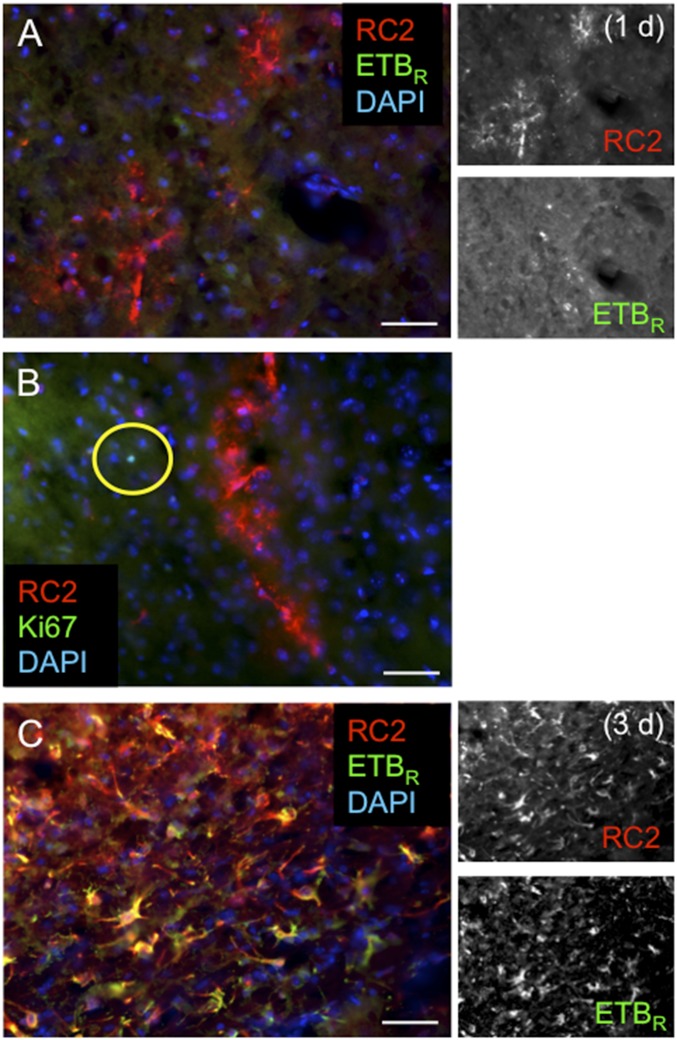
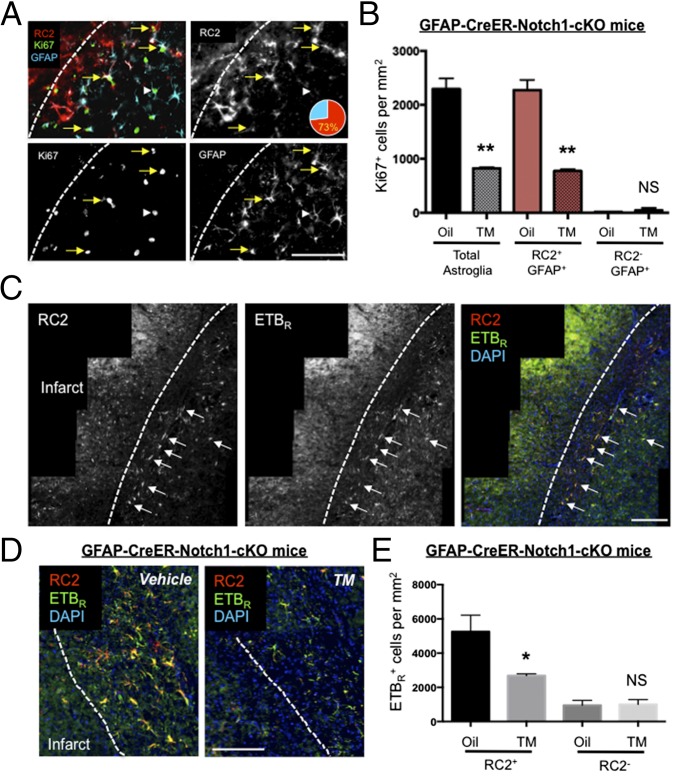
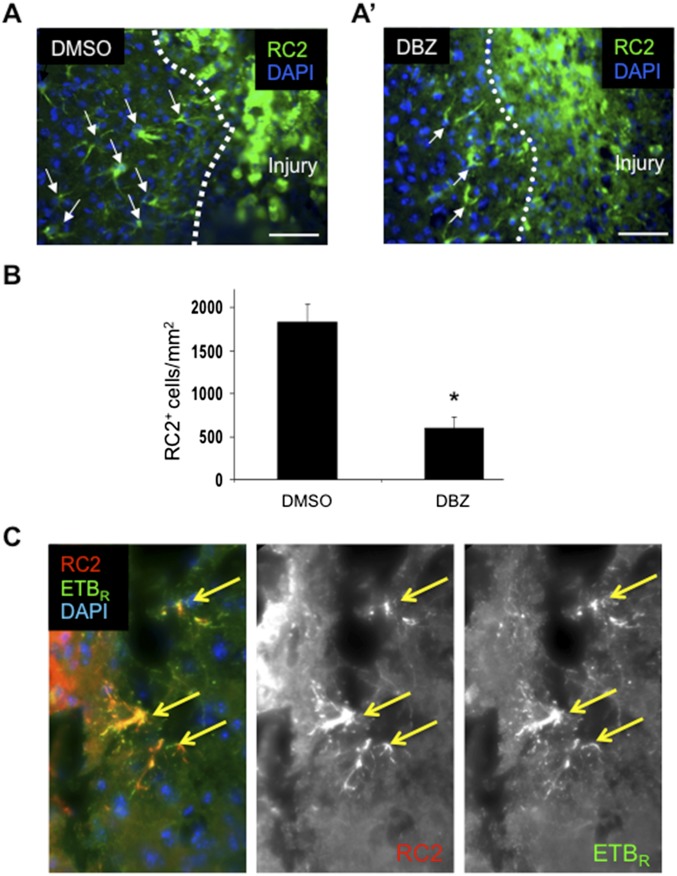
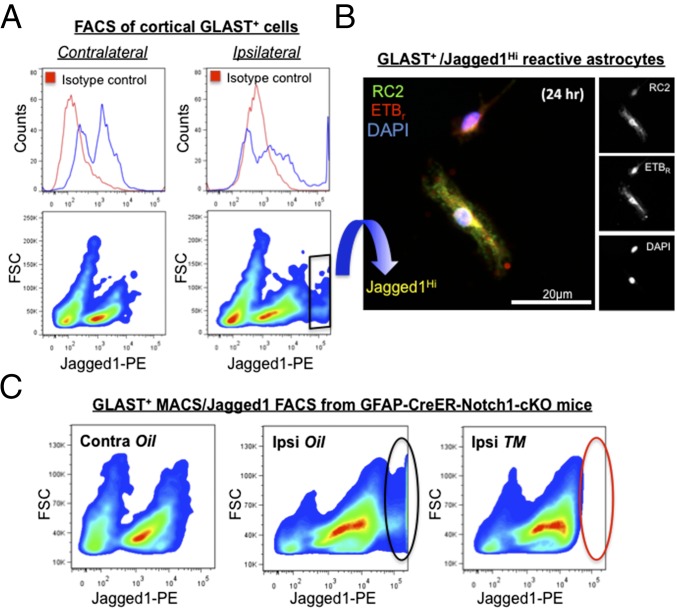
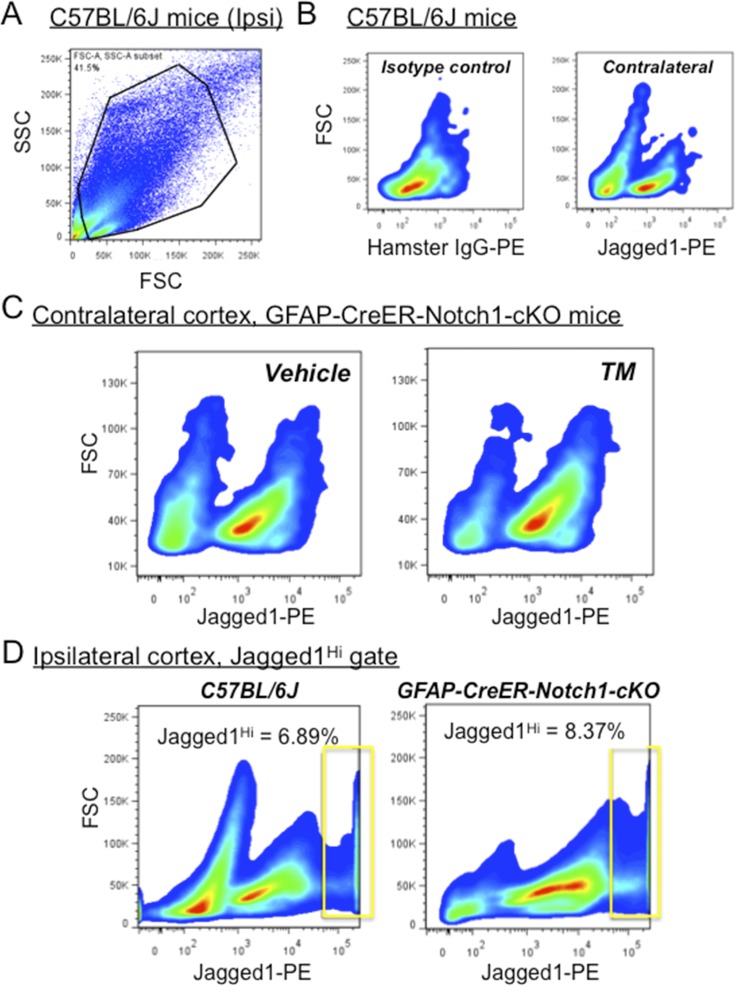
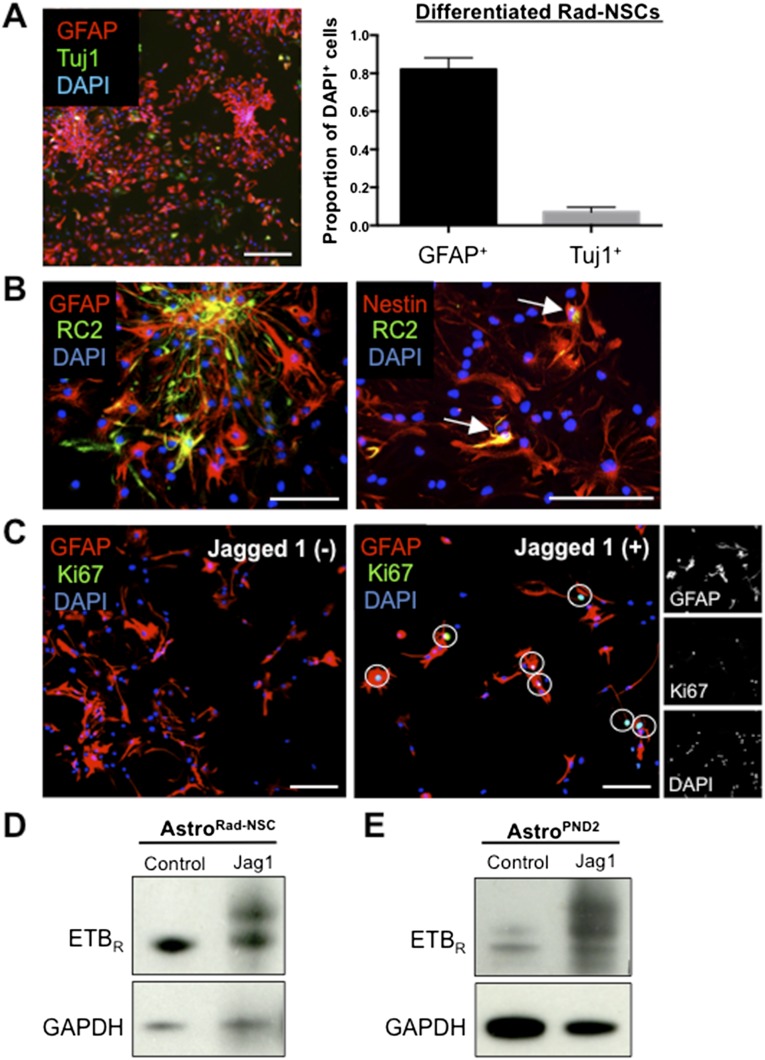
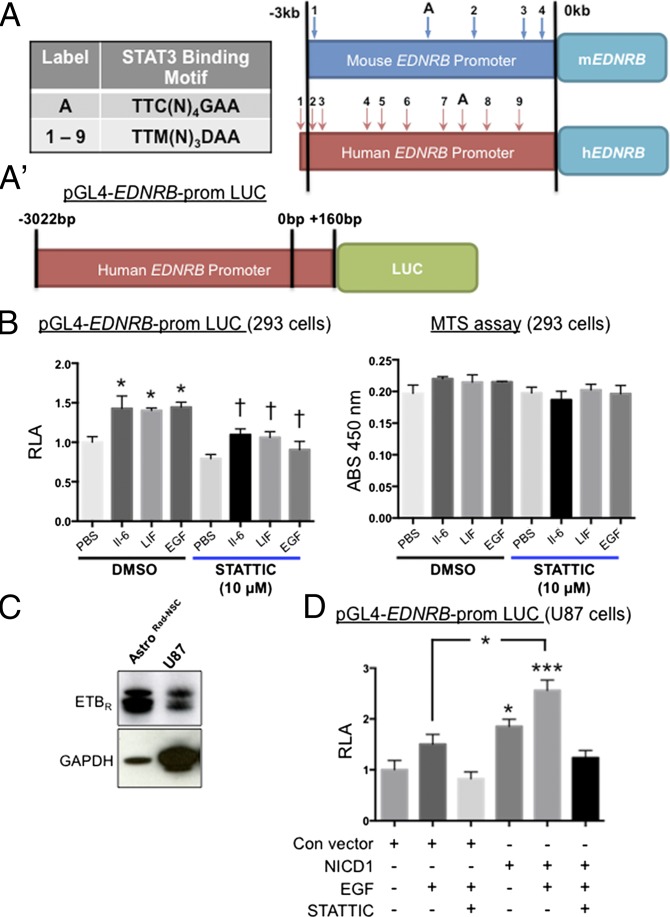
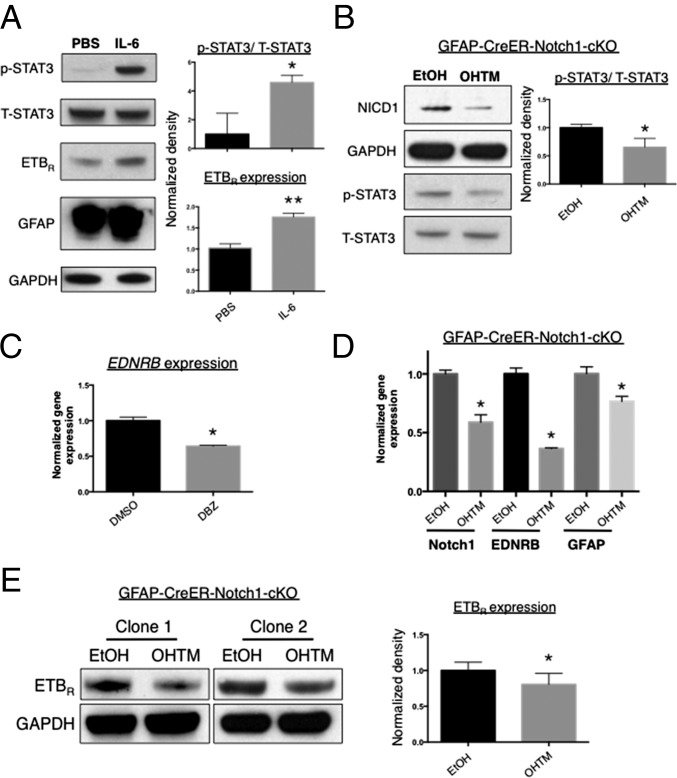
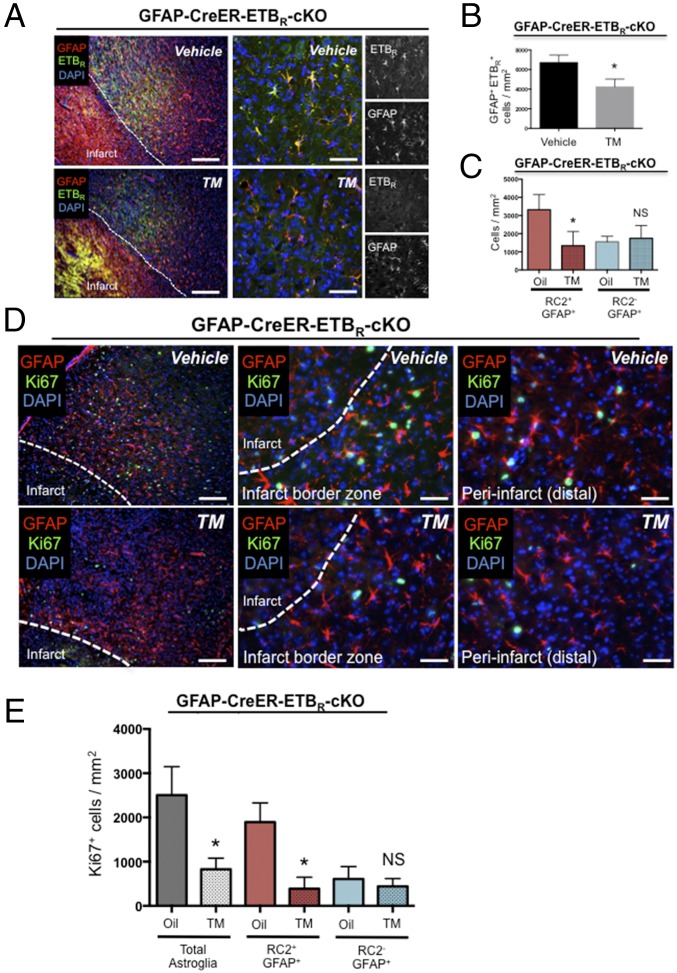
Defining the signaling network that controls reactive astrogliosis may provide novel treatment targets for patients with diverse CNS injuries and pathologies. We report that the radial glial cell antigen RC2 identifies the majority of proliferating glial fibrillary acidic protein-positive (GFAP(+)) reactive astrocytes after stroke. These cells highly expressed endothelin receptor type B (ETB(R)) and Jagged1, a Notch1 receptor ligand. To study signaling in adult reactive astrocytes, we developed a model based on reactive astrocyte-derived neural stem cells isolated from GFAP-CreER-Notch1 conditional knockout (cKO) mice. By loss- and gain-of-function studies and promoter activity assays, we found that Jagged1/Notch1 signaling increased ETB(R) expression indirectly by raising the level of phosphorylated signal transducer and activator of transcription 3 (STAT3), a previously unidentified EDNRB transcriptional activator. Similar to inducible transgenic GFAP-CreER-Notch1-cKO mice, GFAP-CreER-ETB(R)-cKO mice exhibited a defect in reactive astrocyte proliferation after cerebral ischemia. Our results indicate that the Notch1-STAT3-ETB(R) axis connects a signaling network that promotes reactive astrocyte proliferation after brain injury.

Keywords: ETBR; Notch1; STAT3; proliferation; reactive astrocyte.


Conflict of interest statement

The authors declare no conflict of interest.

Figures

Fig. S1.
Fig. S1.
RC2+ reactive astrocytes appear within 1 d after focal ischemic cortical injury but are undetectable 30 d later. (A and A′) RC2+ reactive astrocytes (green) at 1 d after dMCAO. Arrows indicate RC2+ reactive astrocytes that coexpress GFAP (red). Note the “bushy” astrocyte morphology. (B and B′) RC2+ reactive astrocytes have acquired a hypertrophic, stellate morphology by 3 d after dMCAO. (C and C′) At 14 d following injury, GFAP+ reactive astrocytes that express RC2 have largely lost the stellate morphology and extend processes in the direction of the infarct core (dotted line). (D and D′) At 30 d after injury, RC2 expression is undetectable in the GFAP+ reactive astrocytes that compose the glial scar. (Scale bars, 100 µm in A, B, C, and D; 50 µm in A′, B′, C′, and D′.)
Fig. S2.
Fig. S2.
RC2+ reactive astrocytes induce expression of ETBR and Ki67 1–3 d after focal ischemic cortical injury. (A) RC2+ reactive astrocytes (red) are negative for ETBR 1 d after dMCAO. Note the bushy astrocyte morphology. (B) RC2+ reactive astrocytes (red) do not express the proliferation marker Ki67 (green) 1 d after dMCAO. The yellow circle indicates a rare RC2/Ki67+ cell in the peri-infarct area. (C) At 3 d following stroke, the majority of RC2+ reactive astrocytes in the peri-infarct area have undergone hypertrophy and express ETBR. (Scale bars, 100 µm.)
Fig. 1.
Fig. 1.
RC2 marks Notch1-dependent reactive astrocytes that proliferate after injury and express high levels of ETBR. (A) At 3 d after dMCAO, the majority of GFAP+/Ki67+ reactive astrocytes surrounding the infarct core expressed RC2 antigen (73%), whereas a minority of astrocytes coexpressed Ki67 and GFAP but not RC2 (white arrowhead). (B) cKO of Notch1 during stroke significantly reduced the number of proliferating GFAP+ cells (Total astroglia) and RC2+/GFAP+ reactive astrocytes but not RC2/GFAP+ astrocytes 3 d after stroke. **P < 0.01; n = 3. NS, not significant. (C) RC2+ astrocytes expressed high levels of ETBR (white arrows) relative to distal astrocytes and other cell types. (D and E) Conditional deletion of astroglial Notch1 in GFAP-CreER-Notch1-cKO mice significantly decreased RC2+/ETBR+ astrocytes but not RC2/ETBR+ cells in the peri-infarct area 3 d after dMCAO. *P < 0.05, n = 3. (Scale bars, 50 µm.) The three panels in (C) were montaged by software from multiple images in order to show a larger cortical field.
Fig. S3.
Fig. S3.
Formation of RC2+ reactive astrocytes 3 d following cortical stab injury is attenuated by inhibition of Gamma-secretase. (A and A′) RC2+ reactive astrocytes (green) surround the injury 3 d after needle stab. Arrows indicate RC2+ reactive astrocytes. (A′) DBZ injection reduces the presence of RC2+cells. (Scale bars, 50 µm.) (B) Quantification of RC2+ cells in the peri-infarct area. DBZ treatment significantly reduced the number of RC2+ cells after injury. Data are shown as mean ± SEM. *P < 0.05; unpaired t test; n = 3. (C) As in stroke injury, 3 d after brain-stab injury most RC2+ reactive astrocytes (red) adjacent to the injury coexpress ETBR (green). Yellow arrows indicate colocalizations.
Fig. 2.
Fig. 2.
Cell-surface Jagged1 levels identify distinct subpopulations of GLAST+ reactive astrocytes after cortical injury. (A) Jagged1 phenotype of GLAST+ cells isolated by MACS from pooled contralateral and ipsilateral cortical tissues of C57BL/6J mice 3 d after ischemic injury (n = 4 mice; ipsi- and contralateral tissues were dissected from the same animals). (Left) Contralateral GLAST+ cells divide into two populations, Jagged1Neg and Jagged1Lo. For specific anti-Jagged1 stain (see area under blue line on the histogram), note the bimodal distribution indicating two populations, and that the signal from cells stained with nonspecific antibody (isotype control, area under red line) overlaps the first half of the distribution defined by the blue line (i.e., Jagged1Neg cells). (Right) Cell-surface Jagged1 levels increase markedly on a portion of ipsilateral GLAST+ cells after stroke, forming a third additional cell population (i.e., Jagged1Hi cells) with a signal intensity above 105 (see distribution under blue line towards the far end of the histogram). (Right, Bottom) Isolation of Jagged1Hi cells by FACS (the black rhombus indicates the gate). (B) Post-FACS, Jagged1Hi cells adhered and were cultured for 24 h and then were fixed and stained for RC2 (green) and ETBR (red). Cell nuclei were stained by DAPI (blue). (C) GFAP-CreER-Notch1-cKO mice were treated with vehicle (corn oil) or TM (n = 3 mice per treatment group, pooled by ipsi- or contralateral cortical tissue). (Left) GLAST+ cells isolated from contralateral cortices of oil-treated GFAP-CreER-Notch1-cKO mice lacked the population of Jagged1Hi cells, similar to C57BL/6J control animals (compare with phenotype in A, Lower Left). (Center) Similar to ipsilateral cortices of typical C57BL/6J mice 3 d after dMCAO, a population of GLAST+/Jagged1Hi cells (black oval) was observed for GFAP-CreER-Notch1-cKO mice treated with oil (compare with phenotype in A, Lower Right). (Right) Astroglial deletion of Notch1 in TM-treated GFAP-CreER-Notch1-cKO mice largely removed the GLAST+/Jagged1Hi cell population (red oval). Note: Each of the three FACS phenotypes in C represents 4.06 × 10⁵ cells.
Fig. S4.
Fig. S4.
TM treatment does not alter the number of GLAST+/Jagged1+ cells from contralateral (uninjured) cortex after stroke. (A) GLAST+ input from MACS gated by side scatter (SSC) and forward scatter (FSC) of light. (B) Jagged1 phenotype of GLAST+ cells isolated by MACS from pooled contralateral cortical tissues of C57BL/6J mice (n = 4) at 3 d following dMCAO. Monoclonal antibody (PE) directed toward the extracellular domain of Jagged1 labels a population of cells that are immunoreactive in contralateral cortex that are not observed with isotype control staining (Left). (C) GLAST+ cells from contralateral cortex of GFAP-CreER-Notch1-cKO mice treated with TM or oil (vehicle) show similar populations of GLAST+/Jagged1+ immunoreactive cells (pooled results; n = 3 mice per treatment group). (D) GLAST+ cells from ipsilateral (injured) cortex from C57BL/6J and GFAP-CreER-Notch1-cKO vehicle-treated mice 3 d after stroke show similar percentages of Jagged1Hi cells (the gate is indicated by the rectangle). Data are smoothed xy plots of GLAST+ cells subjected to FACS.
Fig. S5.
Fig. S5.
Primary reactive astrocytes proliferate and increase ETBR expression when exposed to immobilized Jagged1. (A, Left) Passage 3–5 Rad-NSCs differentiated for 7 d provide GFAP+ (red) adult reactive astrocytes, AstroRad-NSC. (Scale bar, 200 µm.) (Right) Differentiation in medium containing 10% serum resulted in minor neuronal cell contamination (Tuj1 stain, green). (B) Subpopulations of AstroRad-NSC expressed GFAP (red) (Left), Nestin (red) (Right), and RC2 (green in both). All RC2+ cells coexpressed Nestin (white arrows). (Scale bars, 50 µm.) (C) AstroRad-NSC plated onto immobilized Jagged 1-Fc chimera proliferated and expressed Ki67 (white circles, Right), whereas AstroRad-NSC plated onto control surfaces did not proliferate or express Ki67 (Left). (Scale bars, 100 µm.) (D and E) By immunoblot, ETBR protein levels increased after cells were plated onto immobilized Jagged 1-FC for 2 d; this increase was observed for both AstroRad-NSC (D) and astrocytes from PND 2 mice (AstroPND2) (E).
Fig. 3.
Fig. 3.
Transcriptional activity at the human EDNRB promoter is increased by NICD1 in a STAT3-dependent manner. (A) Mouse and human promoter sequences of the EDNRB gene contain multiple putative STAT3-binding sites. The schematic indicates the relative positions of sites (arrows with labels) upstream of the transcriptional start site (0 kb) that match the STAT3-binding motif TTM(N)3DAA (D: A, G, or T; M: A or C; N: A, G, T or C) (numbered 1 through 9) or motif TTC(N)4GAA (N: A, G, T or C) (labeled “A”). (Table S1.) (A′) Schematic of the reporter construct for the human EDNRB promoter (pGL4-hEDNRB-prom) used for transfection experiments and luciferase activity assays. A 3.5-kb span of the hEDNRB promoter was cloned upstream of the firefly luciferase gene (LUC). +160 bp indicates the position of the start codon. (B, Left) Relative luciferase activity (RLA) of HEK 293 cells transfected with pGL4-hEDNRB-promoter. After 3 h of incubation in IL-6 (50 ng/mL), LIF (20 ng/mL), or EGF (20 ng/mL), luciferase activity increased significantly relative to control (PBS/DMSO). STATTIC, a specific STAT3 inhibitor, abrogated these effects. Data are shown as mean ± SEM. *P < 0.05 vs. DMSO/PBS; P < 0.05 vs. relevant DMSO/growth factor or DMSO/cytokine; ANOVA; n = 3. (Right) STATTIC did not affect cell viability (MTS assay). (C) Expression of ETBR by AstroRad-NSC and the human U87 cell line. (D) Compared with U87 cells transfected with control vector, U87 cells transfected with NICD1 significantly increased RLA. However, this increase was not seen in NICD1-transfected cells incubated in EGF with STATTIC or with STATTIC alone. Data are shown as mean ± SEM. *P < 0.05, ***P < 0.001; ANOVA; n = 3.
Fig. 4.
Fig. 4.
Astroglial ETBR levels change in a manner correlated with STAT3 activation and are modified by the presence/absence of Notch1. (A) Incubation of AstroRad-NSC in IL-6 (50 ng/mL) for 2 d increased the level of activated p-STAT3, ETBR, and GFAP protein. n = 3. (B) AstroRad-NSC generated from Rad-NSC of GFAP-CreER-Notch1-cKO mice exhibited decreased cleavage of NICD1 after exposure to OHTM for 8 d in comparison with control cells treated with vehicle (ethanol, EtOH). n = 3. (C) LIF (20 ng/mL)-induced p-STAT3 levels were reduced in AstroRad-NSC after conditional deletion of Notch1. (Left) Immunoblot. (Right) Normalized band densities from immunoblot [ratio of p-STAT3 to T-STAT3]). n = 3. (C) Compared with vehicle (DMSO) treatment, exposure to a GSI (DBZ) for 24 h decreased EDNRB gene expression in AstroRad-NSC. Data are shown as mean ± SEM. *P < 0.001; unpaired t test; n = 3. (D) Notch1 cKO significantly reduced EDNRB expression in AstroRad-NSC. Data are shown as mean ± SEM. *P < 0.01; ANOVA; n = 3. (E) AstroRad-NSC differentiated from different clonal Rad-NSC lines had decreased levels of ETBR after Notch1 cKO. n = 5. Note: Rad-NSC clones 1 and 2 were isolated from separate GFAP-CreER-Notch1-cKO animals. *P < 0.05, **P < 0.01.
Fig. 5.
Fig. 5.
ETBR cKO depletes proliferative astrocytes in the peri-infarct area 3 d after stroke. (A) ETBR cKO significantly decreased the number of GFAP+/ETBR+ reactive astrocytes in the peri-infarct area 3 d after stroke. Note: Bright staining in infarct zone (A, Left) is autofluorescence/nonspecific background. Staining of cKO phenotype shows specificity of ETBR antisera. (Scale bars, 200 µm.) (B) Quantification of GFAP+/ETBR+ reactive astrocytes from tissue sections of brains with or without ETBR cKO. Data are shown as mean ± SEM. *P < 0.05; unpaired t test; n = 3 mice per group. (C) GFAP+/RC2+ reactive astrocytes, which are the majority of proliferating reactive astrocytes 3 d following stroke, were significantly decreased by ETBR cKO. In contrast, GFAP+ astrocytes negative for RC2 expression were not reduced in number. Data are mean ± SEM. *P < 0.01; ANOVA with Bonferroni; n = 5 mice per group. NS, not significant. (D) ETBR cKO reduced the number of actively dividing reactive astrocytes (Ki67+) 3 d after stroke. (Left) Representative low-magnification images from oil-treated and TM-treated GFAP-CreER-ETBR-cKO mice. (Scale bars, 100 µm.) (Center) Representative images of proximal peri-infarct area. (Scale bars, 30 µm.) (Right) Representative images of distal peri-infarct area. (Scale bars, 30 µm.) (E) ETBR cKO significantly reduced the number of proliferating reactive astrocytes in the peri-infarct area. Note: RC2+/GFAP+/Ki67+ (triple-positive) reactive astrocytes were significantly reduced in number within the peri-infarct area, whereas the number of RC2/GFAP+/Ki67+ reactive astrocytes was not affected. Data are shown as mean ± SEM. *P < 0.01; ANOVA; n = 5 mice per group. NS, not significant.
Fig. S6.
Fig. S6.
Genotyping of GFAP-CreER-ETBR-cKO mice. (A) PCR for GFAP allele. (B) PCR for EDNRB allele. Note: Numbers 1, 2, and 3 correspond to the same individual mice for GFAP and EDNRB PCR reactions. Mouse #2 has the GFAP-ETBR-cKO genotype (hGFAP-CreERTM+/−:EdnrbloxP/loxP).

References

    1. Pekny M, Nilsson M. Astrocyte activation and reactive gliosis. Glia. 2005;50(4):427–434. - PubMed
    1. Ridet JL, Malhotra SK, Privat A, Gage FH. Reactive astrocytes: Cellular and molecular cues to biological function. Trends Neurosci. 1997;20(12):570–577. - PubMed
    1. Bush TG, et al. Leukocyte infiltration, neuronal degeneration, and neurite outgrowth after ablation of scar-forming, reactive astrocytes in adult transgenic mice. Neuron. 1999;23(2):297–308. - PubMed
    1. Myer DJ, Gurkoff GG, Lee SM, Hovda DA, Sofroniew MV. Essential protective roles of reactive astrocytes in traumatic brain injury. Brain. 2006;129(Pt 10):2761–2772. - PubMed
    1. Faulkner JR, et al. Reactive astrocytes protect tissue and preserve function after spinal cord injury. J Neurosci. 2004;24(9):2143–2155. - PMC - PubMed

Publication types