. 2015 Jul 21;112(29):8817-23.
doi: 10.1073/pnas.1510083112. Epub 2015 Jun 29.

Intrinsic unfoldase/foldase activity of the chaperonin GroEL directly demonstrated using multinuclear relaxation-based NMR

Affiliations

Intrinsic unfoldase/foldase activity of the chaperonin GroEL directly demonstrated using multinuclear relaxation-based NMR

David S Libich et al. Proc Natl Acad Sci U S A. .

Abstract

The prototypical chaperonin GroEL assists protein folding through an ATP-dependent encapsulation mechanism. The details of how GroEL folds proteins remain elusive, particularly because encapsulation is not an absolute requirement for successful re/folding. Here we make use of a metastable model protein substrate, comprising a triple mutant of Fyn SH3, to directly demonstrate, by simultaneous analysis of three complementary NMR-based relaxation experiments (lifetime line broadening, dark state exchange saturation transfer, and Carr-Purcell-Meinboom-Gill relaxation dispersion), that apo GroEL accelerates the overall interconversion rate between the native state and a well-defined folding intermediate by about 20-fold, under conditions where the "invisible" GroEL-bound states have occupancies below 1%. This is largely achieved through a 500-fold acceleration in the folded-to-intermediate transition of the protein substrate. Catalysis is modulated by a kinetic deuterium isotope effect that reduces the overall interconversion rate between the GroEL-bound species by about 3-fold, indicative of a significant hydrophobic contribution. The location of the GroEL binding site on the folding intermediate, mapped from (15)N, (1)HN, and (13)Cmethyl relaxation dispersion experiments, is composed of a prominent, surface-exposed hydrophobic patch.

Keywords: chaperonins; dark state exchange saturation transfer; invisible states; lifetime line broadening; relaxation dispersion.


Conflict of interest statement

The authors declare no conflict of interest.

Figures
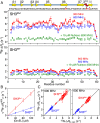
Fig. 1.
Fig. 1.
15N lifetime line broadening of SH3 in the presence of GroEL. (A)15N-ΔR2 profiles for 100 μM 15N-labeled SH3Mut (Top) and SH3WT (Bottom) in the presence of 120 μM (in subunits) GroEL at 900 (red) MHz and 600 (blue) MHz with the experimental data shown as circles and the calculated values as lines. Also shown as controls are the 15N-ΔR2 profiles obtained upon addition of 19 μM acid-denatured Rubisco (green squares), a substrate known to bind to the internal cavity of GroEL with nanomolar affinity. This concentration corresponds to a stoichiometry of one Rubisco molecule per GroEL cavity. (B) Dependence of 15N-ΔR2 on concentration of GroEL for SH3Mut (red) and SH3WT (blue). (C) Correlation plot of observed and calculated 15N-ΔR2 values for SH3Mut (red) and SH3WT (blue) at 900 MHz (Left) and 600 MHz (Right). Experiments were conducted at 10 °C. Error bars = 1 SD.
Fig. 2.
Fig. 2.
15N CPMG relaxation dispersion and DEST on SH3Mut in the presence of GroEL. (A) Examples of experimental (circles) and best-fit (lines) 15N CPMG relaxation profiles for SH3Mut (100 μM) in the presence (red) and absence (blue) of 120 μM GroEL at 900 MHz (Top row) and 600 MHz (Bottom row). (B) Examples of experimental (circles) and best-fit (lines) 15N-DEST profiles for SH3Mut in the presence of GroEL at two radiofrequency field strengths (500 Hz in orange and 750 Hz in purple) for 15N saturation. All experiments were conducted at 10 °C.
Fig. 3.
Fig. 3.
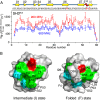
Four-state exchange model for the interaction of SH3Mut with apo GroEL. F and I represent the free folded and intermediate states, respectively, of SH3Mut whereas F-G and I-G are the corresponding GroEL-bound states. The values of the rate constants and populations obtained for the 15N/protonated SH3 samples from the simultaneous fits to the 15N lifetime-broadening, DEST, and CPMG relaxation dispersion data obtained at 10 °C are indicated (further details in Table 2 and SI Theory). The corresponding values obtained for the [15N/1HN/AILV-13CH3]/deuterated SH3 samples are provided in Table 2. Top, ribbon diagrams of the free F [Protein Data Bank (PDB) ID: 2LP5] and I (PDB ID: 2L2P) states of SH3Mut together with the side chain of Phe4 (15); Bottom, top view of one cylinder of GroEL (32) shown as a ribbon with the seven subunits indicated by different colors and a surface representation of the SH3 domain (red) placed in the cavity, showing that there is ample room within the cavity to accommodate one SH3 molecule.
Fig. 4.
Fig. 4.
Transverse (R2) relaxation rates and chemical shifts for the intermediate (I-G) state of SH3Mut bound to GroEL. (A) Calculated N15-R2bound profiles for the I-G state at 900 (red) MHz and 600 (blue) MHz (note the lines in A simply serve to connect the calculated N15-R2bound values). The corresponding N15-R2bound profiles for the F-G state are shown in Fig. S4A. Error bars: 1 SD. (B) Mapping of chemical shift differences between the I-G and I states on a surface representation of the I state (Left) and for reference the F state (Right) (note the views are identical to those of the ribbon diagrams in Fig. 3, Top). Only residues that have a lower bound of |ΔϖI,I-G| > 1.0 ppm (E5, T14, I50, S52, L55, and A56), 0.4 ppm (T2, L3, F4, E5, L7, I28, W37, S52, L55, and A56), and/or 1.0 ppm (A6, I28, L55, and A56) for 15N, 1HN, and/or 13Cmethyl nuclei, respectively, are colored according to residue type (green, hydrophobic; light blue, polar; and red, negatively charged). Note the reduced extent of the hydrophobic patch in the F state compared with the I state, accounting for the substantially reduced affinity of the F state for GroEL.
Fig. S1.
Fig. S1.
In the absence of exchange between the F-G and I-G states, relaxation dispersion and ΔR2 cannot be accounted for simultaneously in the presence of GroEL. Each panel shows the same simulations for different values of ΔϖF,I = ΔϖF,I-G (i.e., ΔϖI,I-G = 0; note that in the absence of a fast exchange process connecting I-G to F via F-G, ΔϖI,I-G has minimal impact on the relaxation dispersion profiles). Black curves show relaxation dispersions calculated for a two-state system with the interconversion between F and I states with kFI and kIF set to the experimentally determined values of 7.5 s−1 and 310 s−1, respectively (compare with Table 1 in main text). Red curves show relaxation dispersions calculated using the four-state model and parameters (rate constants and R2 rates) shown in Fig. 2 of the main text (compare with Tables 2 and 3 in main text). Blue curves show relaxation dispersions for a four-state model where the F-G and I-G states do not directly interconvert with one another (i.e., kFIG=kIFG=0), konapp=6s1,60s1,600s1, and 6,000 s−1, and the population of the I-G state I, pI-G, is kept constant by scaling the koff proportionately (i.e., koff = 20 s−1, 200 s−1, 2,000 s−1, and 2 × 10⁴ s−1), and the remaining rate constants and R2 values are set to the same values as in the red curves. Experimentally, the dispersion profiles in the presence of GroEL are shifted by the ΔR2 value while retaining similar shapes (compare black vs. red simulated curves). In the absence of interconversion between the F-G and I-G states (blue curves), varying the association rate constant konapp for the binding of F and I to GroEL does not reproduce the experimental observations, indicating that interconversion between F-G and I-G states is required.
Fig. S2.
Fig. S2.
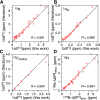
Chemical shift difference comparisons between the free F and I states. Comparison of absolute chemical shift differences between the free F and I states (|ΔϖF,Ι|) is determined here from the global fits (x axis) and those reported in the literature by Neudecker et al. (14) (y axis) for (A) 15N, (B) 1HN, and (C) 13Cmethyl nuclei. Also shown in D is the correlation between the |15N-ΔϖF,Ι| values obtained in the present work for the 15N/protonated (x axis) and [15N/1HN/AILV-13CH3]/deuterated (y axis) SH3Mut samples. The Pierson correlation coefficient R is also listed.
Fig. S3.
Fig. S3.
The experimental relaxation dispersion profiles and ΔR2 values in the presence of GroEL are consistent with an acceleration in the interconversion rates between the F and I states only upon binding GroEL. The four panels show comparisons of experimental and simulated 15N-CPMG relaxation dispersion profiles at a spectrometer frequency of 900 MHz for the same residues (Asp9, Ser19, Trp36, and Leu55) shown in Fig. 2 of the main text. The experimental data for SH3Mut in the absence and presence of GroEL are displayed as blue and red circles, respectively. The corresponding calculated curves obtained from the global best-fitting procedure to kinetic scheme 1 (Eq. S1) with the optimized values of the rate constants (Table 2 of main text; the optimized values of the interconversion rate constants between the F and I states when bound to GroEL are kFIG=4,000s1 and kFIG=1,300s1), bound R2 values, and Δω values (SI Theory) are shown as solid blue and red lines, respectively. Simulated CPMG profiles are shown as green dashed lines for values of kFIG ranging from 50 s−1 to 50,000 s−1, as indicated at Top Left. The kFIG/kIFG ratio is kept constant at a value of 3.077 (the value obtained from the global best fit) to maintain detailed balance (see Eq. S2). The shape of the profiles, the Rex values (the difference in R2 at 0-Hz and 1,000-Hz CPMG field), and the ΔR2 values (the difference in R2 in the presence and absence of GroEL at a CPMG field of 1,000 Hz where exchange contributions to R2,eff are suppressed) are reproduced only with the values of kFIG and kIFG provided in Table 2. For values of kFIG and kIFG smaller than the optimized ones, the calculated values of both Rex and ΔR2 are too small; for values of kFIG and kIFG larger than the optimized ones, the calculated values of ΔR2 are too large.
Fig. S4.
Fig. S4.
Transverse relaxation rates of SH3 bound to GroEL. (A) Calculated N15R2bound profile for SH3WT bound to GroEL [state F-G at 900 (red) MHz and 600 (blue) MHz]. (B) Correlation between calculated N15R2bound values for the I-G state and the measured 15N-ΔR2 values for SH3Mut. Experiments were conducted at 10 °C. Error bars: 1 SD.
Fig. S5.
Fig. S5.
CPMG relaxation dispersion data for the [15N/1HN/AILV-13CH3]/deuterated-SH3Mut sample in the presence and absence of GroEL. (A–C) Examples of experimental (circles) and best-fit (lines) CPMG relaxation dispersion profiles for (A) 15N, (B) 1HN, and (C) 13Cmethyl as a function of CPMG field strength (νCPMG) in the presence (red, 120 μM in subunits) and absence (blue) of GroEL at 900 MHz (800 MHz for 13Cmethyl) (A–C, Top rows) and 600 MHz (A–C, Bottom rows). All experiments were conducted at 10 °C.
Fig. S6.
Fig. S6.
Comparison of observed and calculated ΔR2 values for [15N/1HN/AILV-13Cmethyl]/deuterated-SH3Mut in the presence of GroEL. (A) 15N-ΔR2 at 900 MHz (Left) and 600 MHz (Right). (B) 13CmethylR2 at 800 MHz (Left) and 600 MHz (Right).
Fig. S7.
Fig. S7.
15N- and 13Cmethyl-DEST profiles recorded on [15N/1HN/AILV-13CH3]/deuterated-SH3Mut in the presence of GroEL. (A and B) Examples of experimental (circles) and best-fit (lines) DEST profiles for (A) 15N and (B) 13Cmethyl as a function of frequency offset from the 15N (119.5 ppm) and 13C (18 ppm) carrier, respectively. Data were recorded at two RF field strengths: 500 Hz (orange) and 750 Hz (purple) for 15N and 750 Hz (orange) and 1,500 Hz (purple) for 13C. All experiments were conducted at 10 °C.
Fig. S8.
Fig. S8.
Effect of the value of the rate constant kFIG on ΔR2. Shown are plots of simulated 15N-ΔR2 as a function of kFIG for konapp = 6 s−1, 60 s−1, 600 s−1, and 6,000 s−1. The population of the GroEL-bound I-G state, pI-G, is kept constant by scaling the rate constant koff proportionately (koff = 20 s−1, 200 s−1, 2,000 s−1, and 2 × 10⁴ s−1), and the remaining rate constants and bound R2 values are as listed in Tables 2 and 3 of the main text, respectively. ΔΔR2 represents the decrease in ΔR2 between the protonated (“H”) sample and its deuterated counterpart (“D”).
Fig. S9.
Fig. S9.
Effect of the sign of ΔϖF,I-G on the 15N relaxation dispersion profiles. 15N profiles are simulated for the four-state exchanging system shown in Fig. 3 of the main text (as well as in Eq. S1 of SI Theory), using the rate constants and populations for 15N-SH3Mut listed in Table 2 of the main text for ΔϖF,I = 1 ppm, 2 ppm, 3 ppm, and 4 ppm at a 1H spectrometer frequency of 900 MHz. In each case, the profiles shown with black circles are calculated for ΔϖF,I-G = 0 ppm; the profiles shown with blue circles and asterisks are calculated for ΔϖF,I-G = +2 ppm and −2 ppm, respectively; and the profiles shown with red circles and asterisks are calculated for ΔϖF,I-G = +4 ppm and −4 ppm, respectively.

Comment in

References

    1. Dobson CM. Protein folding and misfolding. Nature. 2003;426(6968):884–890. - PubMed
    1. Hartl FU, Bracher A, Hayer-Hartl M. Molecular chaperones in protein folding and proteostasis. Nature. 2011;475(7356):324–332. - PubMed
    1. Thirumalai D, Lorimer GH. Chaperonin-mediated protein folding. Ann Rev Biophys Biomol Struct. 2001;30:245–269. - PubMed
    1. Spiess C, Meyer AS, Reissmann S, Frydman J. Mechanism of the eukaryotic chaperonin: Protein folding in the chamber of secrets. Trends Cell Biol. 2004;14(11):598–604. - PMC - PubMed
    1. Saibil HR. Chaperone machines in action. Curr Opin Struct Biol. 2008;18(1):35–42. - PubMed

Publication types

LinkOut - more resources