. 2015 Jul 14;112(28):E3709-18.
doi: 10.1073/pnas.1503118112. Epub 2015 Jun 29.

Structural asymmetry in a conserved signaling system that regulates division, replication, and virulence of an intracellular pathogen

Affiliations

Structural asymmetry in a conserved signaling system that regulates division, replication, and virulence of an intracellular pathogen

Jonathan W Willett et al. Proc Natl Acad Sci U S A. .

Abstract

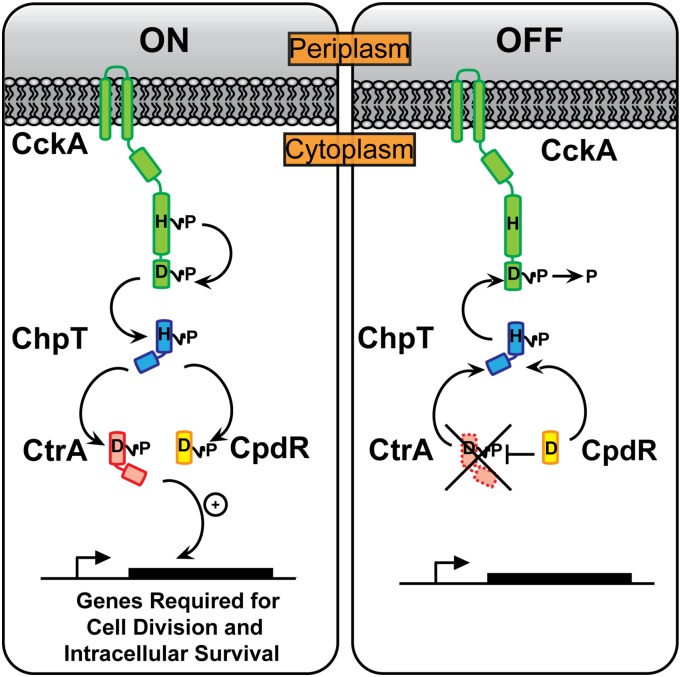
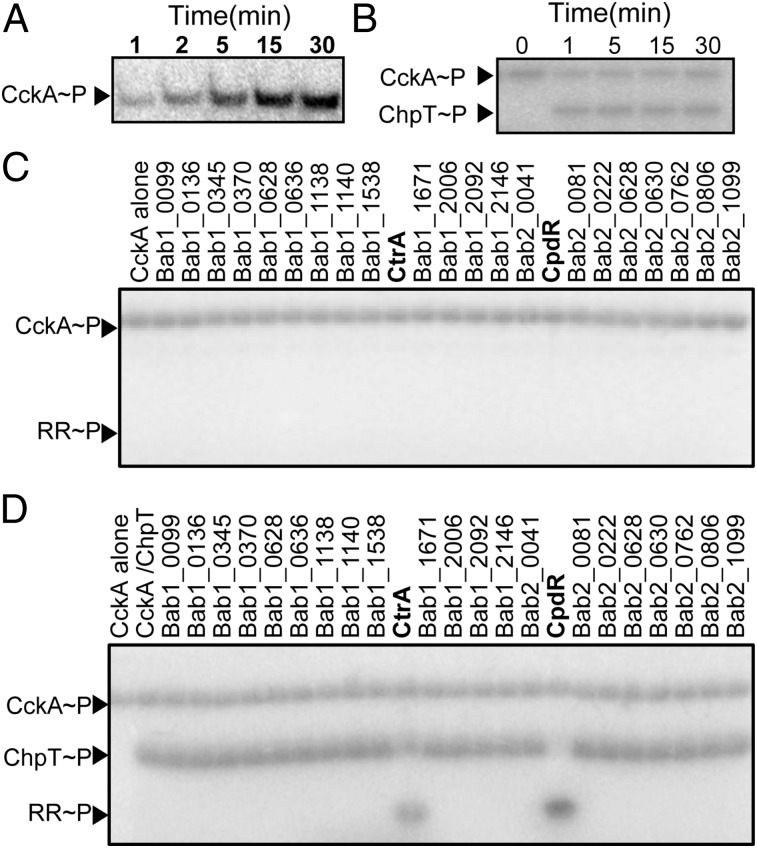
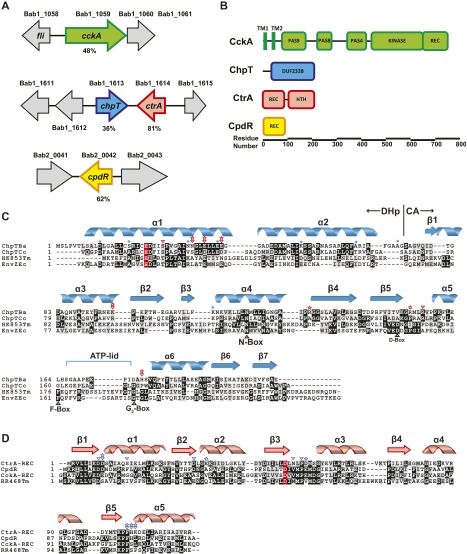
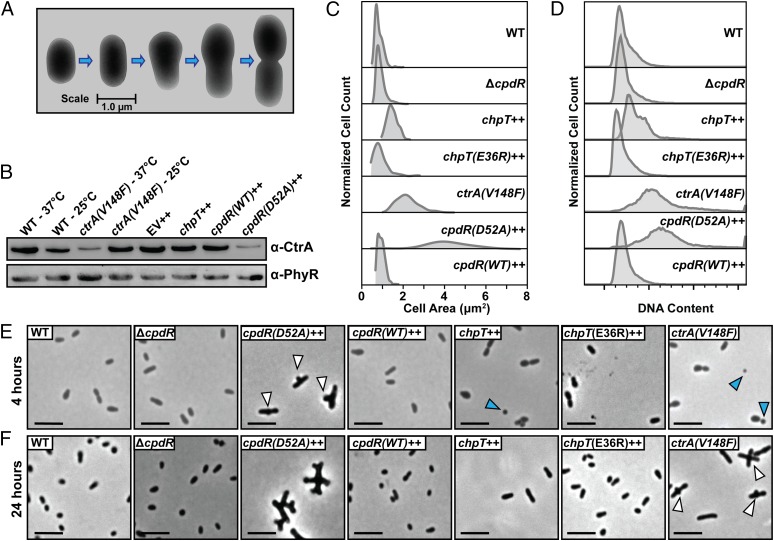
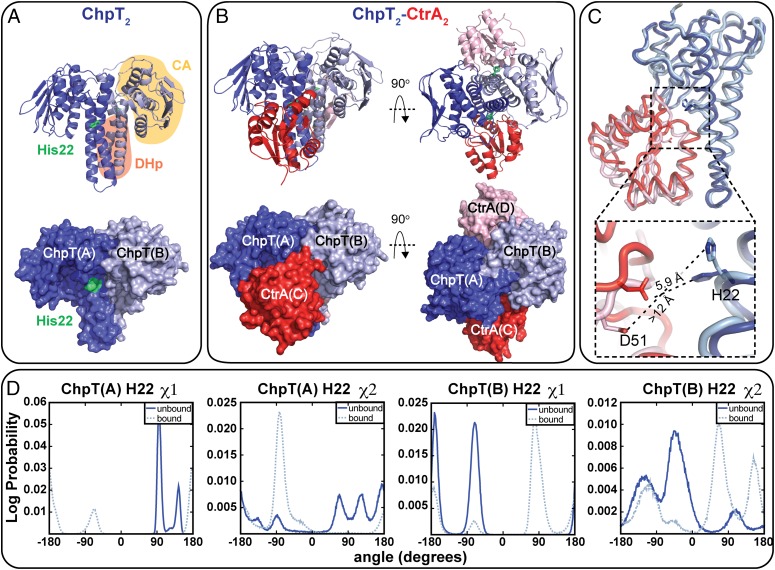
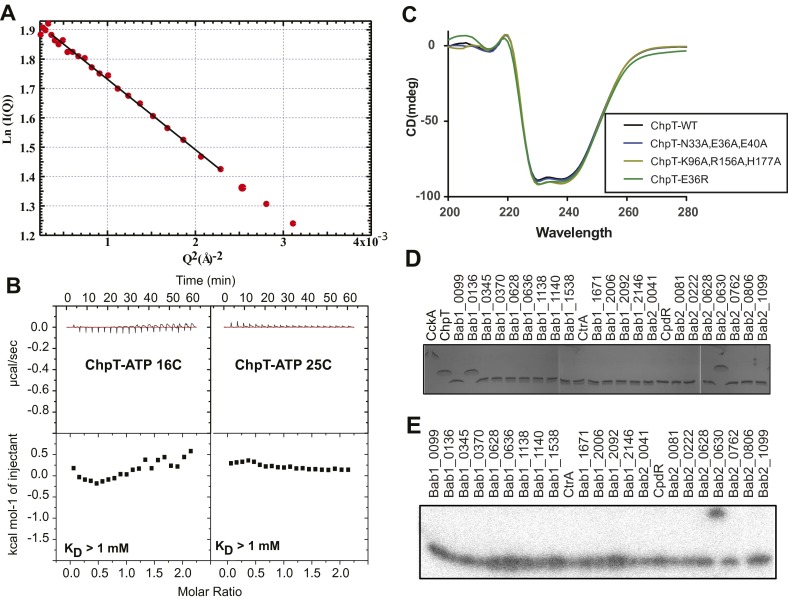
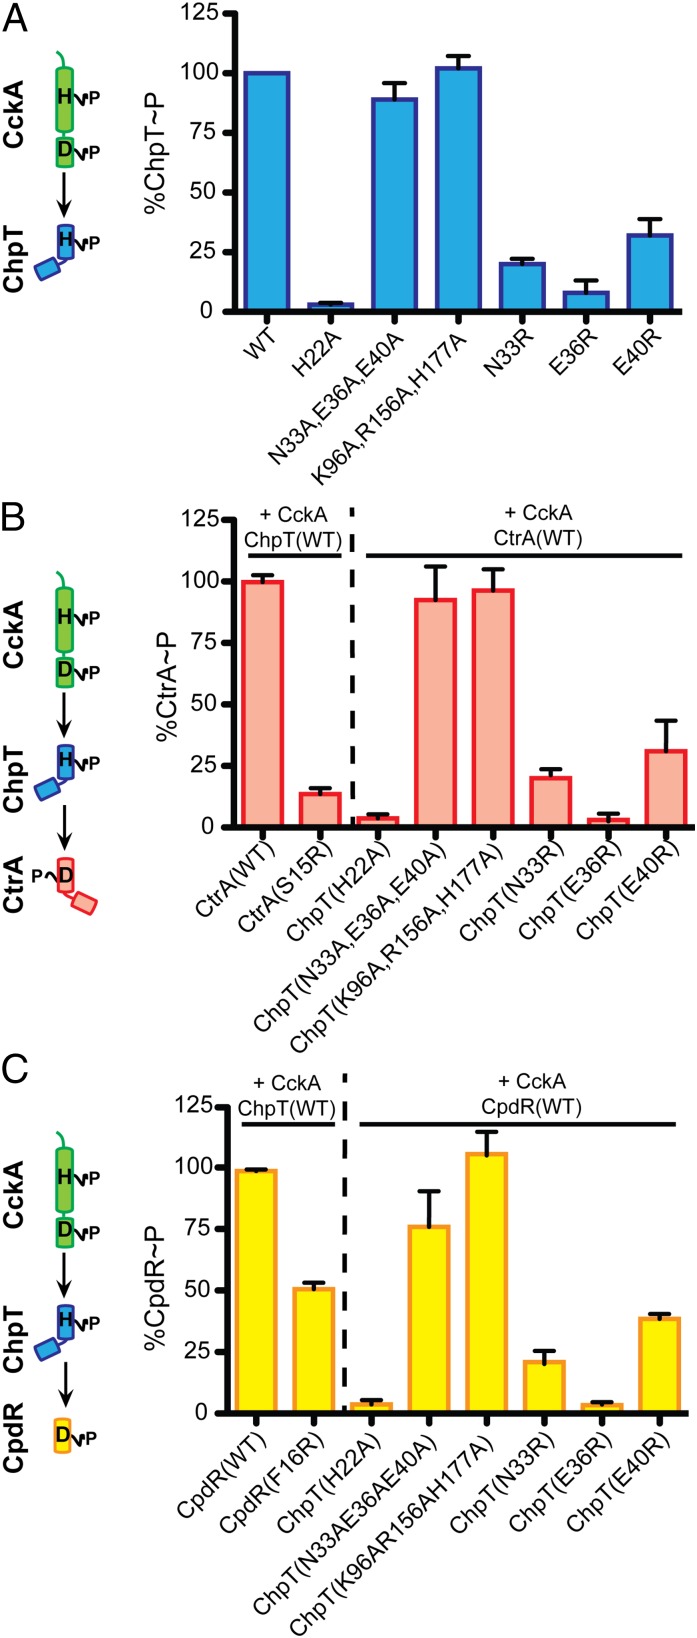
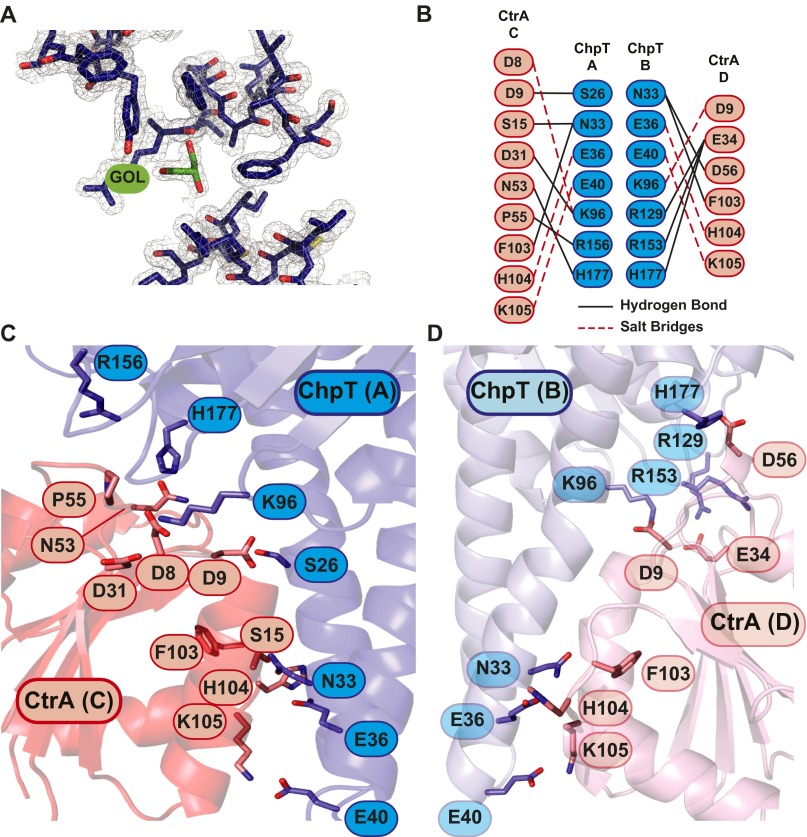
We have functionally and structurally defined an essential protein phosphorelay that regulates expression of genes required for growth, division, and intracellular survival of the global zoonotic pathogen Brucella abortus. Our study delineates phosphoryl transfer through this molecular pathway, which initiates from the sensor kinase CckA and proceeds through the ChpT phosphotransferase to two regulatory substrates: CtrA and CpdR. Genetic perturbation of this system results in defects in cell growth and division site selection, and a specific viability deficit inside human phagocytic cells. Thus, proper control of B. abortus division site polarity is necessary for survival in the intracellular niche. We further define the structural foundations of signaling from the central phosphotransferase, ChpT, to its response regulator substrate, CtrA, and provide evidence that there are at least two modes of interaction between ChpT and CtrA, only one of which is competent to catalyze phosphoryltransfer. The structure and dynamics of the active site on each side of the ChpT homodimer are distinct, supporting a model in which quaternary structure of the 2:2 ChpT-CtrA complex enforces an asymmetric mechanism of phosphoryl transfer between ChpT and CtrA. Our study provides mechanistic understanding, from the cellular to the atomic scale, of a conserved transcriptional regulatory system that controls the cellular and infection biology of B. abortus. More generally, our results provide insight into the structural basis of two-component signal transduction, which is broadly conserved in bacteria, plants, and fungi.

Keywords: Brucella abortus; ChpT; CtrA; cell cycle; two-component system.


Conflict of interest statement

The authors declare no conflict of interest.

Figures

Fig. 1.
Fig. 1.
Model of the CckA–ChpT–CtrA–CpdR phosphorelay. The HK CckA (green) autophosphorylates on a conserved His (H) residue and transfers a phosphoryl group to a conserved Asp (D) residue on its C-terminal REC domain. CckA∼P transfers phosphoryl groups to the ChpT phosphotransferase (blue), which can subsequently transfer phosphoryl groups to the REC domains of CtrA (red) and CpdR (yellow). CtrA∼P is a DNA-binding response regulator that modulates transcription of genes controlling cell polarity, division, and intracellular survival in mammalian macrophages. CpdR controls steady-state levels of CtrA in the B. abortus cell.
Fig. 2.
Fig. 2.
CckA–ChpT–CtrA–CpdR proteins constitute a phosphorelay system in vitro. (A) Autoradiograph of CckA autophosphorylation from 1 to 30 min in the presence of [γ-32P]ATP. (B) Autoradiograph of phosphotransfer from CckA∼P to ChpT measured from 0 to 30 min in the presence of [γ-32P]ATP. CckA was permitted to autophosphorylate for 30 min before incubation with ChpT. (C and D) Phosphoryl transfer from CckA∼P was assayed for 15 s against all 23 B. abortus response regulators in the (C) absence or (D) presence of ChpT.
Fig. S1.
Fig. S1.
(A) Genome context of cckA (green), chpT (blue), ctrA (red), and cpdR (yellow) in B. abortus strain 2308. Locus numbers are indicated above each gene. Percent amino acid sequence identity to C. crescentus orthologs is indicated below each gene. (B) Domain organization of B. abortus CckA, ChpT, CtrA, and CpdR proteins. All proteins are drawn to scale. (C) C. crescentus and B. abortus ChpT phosphotransferase proteins aligned with the sequences of HKs E. coli EnvZ and T. maritima HK853. Residues involved in protein dimerization (blue circles) and interaction with CtrA(C) (small red arrow) and CtrA(D) (small red star) are indicated. The conserved histidine phosphorylation site is highlighted red. (D) Alignment of B. abortus CtrA, CpdR, CckA, and T. maritima RR468 REC domains. Site of aspartyl phosphorylation is highlighted red. Residues that interact with ChpT(A) (small blue arrow) and ChpT(B) (small blue star) are indicated. All secondary structure is indicated above the sequence (spiral, helix; horizontal arrow, beta strand).
Fig. 3.
Fig. 3.
The CckA–ChpT–CtrA–CpdR phosphorelay regulates B. abortus cell division. (A) CryoEM images of fixed WT B. abortus cells captured at stages through a typical cell cycle. (B) Western blot showing steady-state CtrA protein levels 24 h after shift to the nonpermissive temperature [37 °C for ctrA(V148F)] or addition of IPTG [chpT++, cpdR(WT)++, and cpdR(D52A)++]. (C) Total cell area distributions of populations of B. abortus cells (n ≈ 300) after growth for 24 h under conditions in which conditional alleles are induced/activated. (D) DNA content of WT and mutant B. abortus cells (n = 20,000) measured by propidium iodide staining followed by flow cytometry. Light micrographs of WT and mutant B. abortus strains taken after (E) 4-h and (F) 24-h cultivation in complex medium at 37 °C, containing IPTG. Blue arrows mark apparent B. abortus minicells; white arrows mark cells with disrupted cell growth and division polarity. (Scale bars, 2 μm.)
Fig. S2.
Fig. S2.
Cryoelectron micrographs of B. abortus (A) ctrA(V148F), (B) chpT++, and (C) cpdR(D52A)++ overexpression strains. (D) Western blot of HA-tagged ChpT and ChpT(E36R) proteins from B. abortus cell lysate resolved by SDS/PAGE. WT B. abortus cell lysate was run and blotted as a negative control.
Fig. S3.
Fig. S3.
qRT-PCR analysis of ccrM transcript levels in WT, ctrA(V148F), chpT++, EV++ (empty vector control), cpdR(WT)++, and cpdR(D52A)++ backgrounds. ccrM transcript levels in each independent strain sample (n = 3) are normalized to the WT mean, which is set to a value of 1.
Fig. 4.
Fig. 4.
The CckA–ChpT–CtrA–CpdR phosphorelay regulates intracellular replication, and survival of WT and mutant B. abortus strains in terminally differentiated THP-1 macrophages. (A) Enumeration (cfu per well) of the intracellular ctrA(V148F) temperature-sensitive strain recovered from THP-1 cells cultured at the nonpermissive (37 °C) and permissive (30 °C) temperatures. (B) Enumeration of intracellular B. abortus overexpressing chpT or (C) cpdR recovered from THP-1. (D) Growth and survival of WT and mutant B. abortus strains cultured axenically over 48 h in complex medium. Cultures were first grown for 8 h under conditions in which mutant alleles were not activated/induced [30 °C for ctrA(V148F) and without IPTG for cpdR(WT)++ and cpdR(D52A)++ strains]. Cultures were then shifted to inducing conditions [37 °C for ctrA(V148F) and adding IPTG to cpdR(WT)++ and cpdR(D52A)++]. Numbers indicate B. abortus viable cfu per milliliter of medium, recovered at time points through this culture procedure. Data points represent mean cfu of three independent samples ± SEM.
Fig. 5.
Fig. 5.
Molecular structures of B. abortus ChpT and ChpT– CtrAREC complex. (A) Ribbon (Top) and surface views (Bottom) of homodimeric B. abortus ChpT at 1.7-Å resolution (PDB ID code 4QPK). One ChpT monomer is drawn in dark blue and one in light blue. The conserved site of ChpT phosphorylation, His22, is highlighted green; DHp (highlighted pink) and CA-like domains (highlighted yellow) of ChpT are labeled. (B) Ribbon (Top) and surface views (Bottom) of the 2:2 ChpT-CtrAREC complex at 2.7-Å resolution (PDB ID code 4QPJ); diagram illustrates two CtrA receiver domain (REC) monomers (in red and pink) bound to a central homodimer of ChpT (ChpT monomers in dark blue and light blue). (C) Least-squares Cα fit of the two halves of ChpT–CtrAREC complex: ChpT(A) dark blue, ChpT(B) light blue, CtrAREC(C) dark red, and CtrAREC(D) pink. Distances between ChpT(A)–CtrA(C) and ChpT(B)–CtrA(D) phosphoryltransfer residues (ChpT H22 and CtrA D51) are labeled in the expanded box. (D) Log probability of ChpT(A) and ChpT(B) H22 χ1 and χ2 rotamer angle occupancy in the ChpT (unbound; solid blue) and in the ChpT2–CtrA2 complex structures (bound; light dotted blue) based on MD simulations (Materials and Methods); distributions represent Gaussian fluctuations of H22 conformation about a local equilibrium state.
Fig. S4.
Fig. S4.
(A) Guinier fit of B. abortus ChpT SAXS data. (B) ITC assay of ChpT titrated with ATP. Isotherms at 16 °C and 25 °C indicate no apparent binding (>1 mM equilibrium affinity) between ChpT and ATP. (C) CD spectra of purified WT ChpT and mutant alleles of ChpT. (D) Coomassie-stained SDS polyacrylamide gel of purified proteins used in Fig. 2. (E) [32P]acetyl phosphate labeling of purified B. abortus receiver (REC) domains.
Fig. 6.
Fig. 6.
A structural analysis of phosphoryltransfer. (A) Phosphoryltransfer from phospho-CckA (CckA∼P) to an equimolar concentration of WT and mutant ChpT (ChpT point mutations labeled on axis). (B) Phosphoryltransfer from CckA∼P to CtrA(WT) and CtrA(S15R) proteins in the presence of WT or mutant ChpT proteins. (C) Phosphoryltransfer from CckA∼P to CpdR(WT) and CpdR(F16R) proteins in the presence of WT or mutant ChpT proteins. All phosphotransfer reactions are normalized to phosphotransfer reactions performed with WT controls (100%); mean ± SEM is shown for three independent replicates.
Fig. S5.
Fig. S5.
(A) Simulated annealing composite omit map (contoured at ±2σ) of a region surrounding a glycerol molecule (GOL; colored green) in the binding pocket of the ChpT CA domain. (B) Interaction map of polar contacts between ChpT monomers (A and B; blue) and CtrAREC domains (C and D; red), hydrogen bonds (black lines), and salt bridges (dotted red lines). Magnified view of ChpT–CtrA complex structure showing (C) ChpT(A)–CtrA(C) and (D) ChpT(B)–CtrA(D) interacting residues.

References

    1. Pappas G, Papadimitriou P, Akritidis N, Christou L, Tsianos EV. The new global map of human brucellosis. Lancet Infect Dis. 2006;6(2):91–99. - PubMed
    1. Atluri VL, Xavier MN, de Jong MF, den Hartigh AB, Tsolis RM. Interactions of the human pathogenic Brucella species with their hosts. Annu Rev Microbiol. 2011;65:523–541. - PubMed
    1. Dean AS, et al. Clinical manifestations of human brucellosis: A systematic review and meta-analysis. PLoS Negl Trop Dis. 2012;6:e1929. - PMC - PubMed
    1. Batut J, Andersson SG, O’Callaghan D. The evolution of chronic infection strategies in the alpha-proteobacteria. Nat Rev Microbiol. 2004;2(12):933–945. - PubMed
    1. Philippot L, et al. The ecological coherence of high bacterial taxonomic ranks. Nat Rev Microbiol. 2010;8(7):523–529. - PubMed

Publication types

Substances

LinkOut - more resources