. 2015 Jul 6;210(1):45-62.
doi: 10.1083/jcb.201410001. Epub 2015 Jun 29.

Mio depletion links mTOR regulation to Aurora A and Plk1 activation at mitotic centrosomes

Affiliations

Mio depletion links mTOR regulation to Aurora A and Plk1 activation at mitotic centrosomes

Melpomeni Platani et al. J Cell Biol. .

Abstract

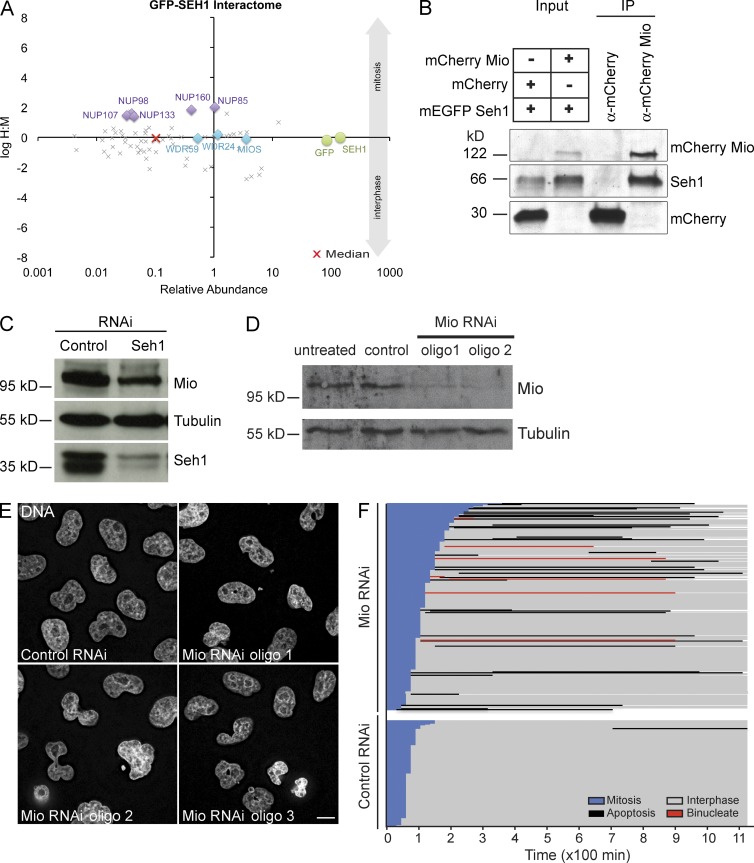
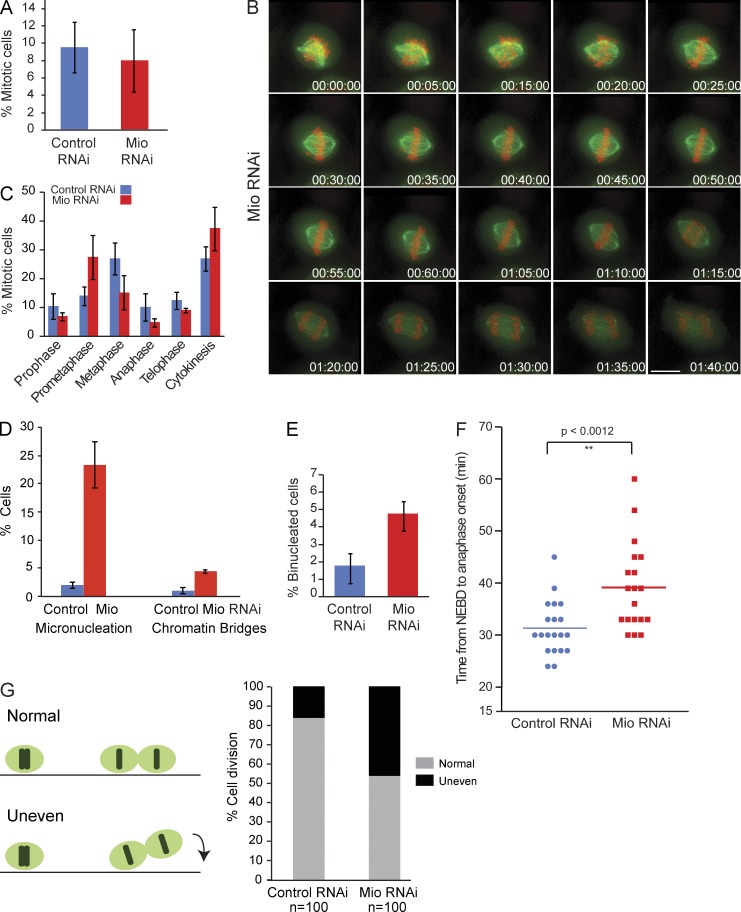
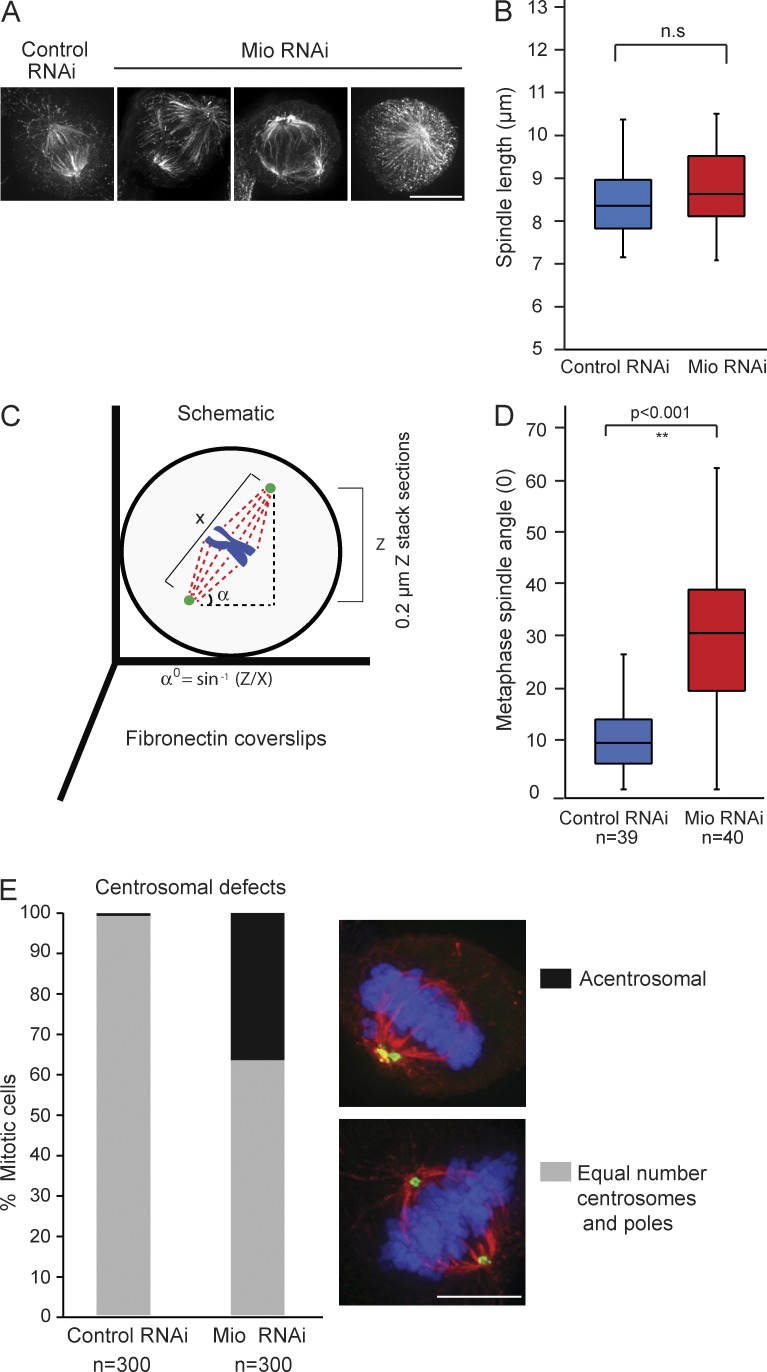
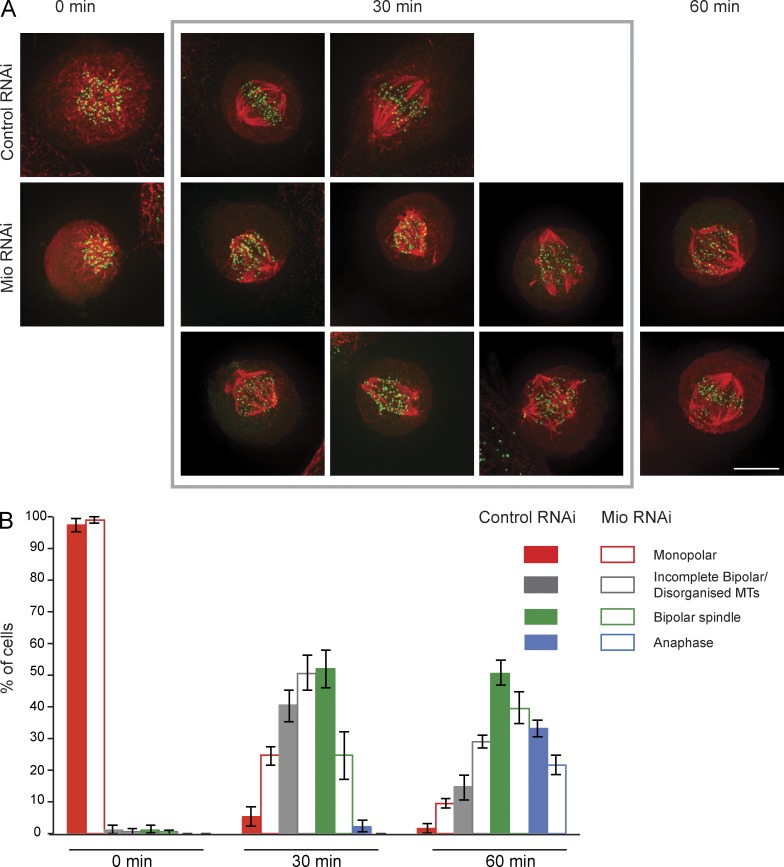
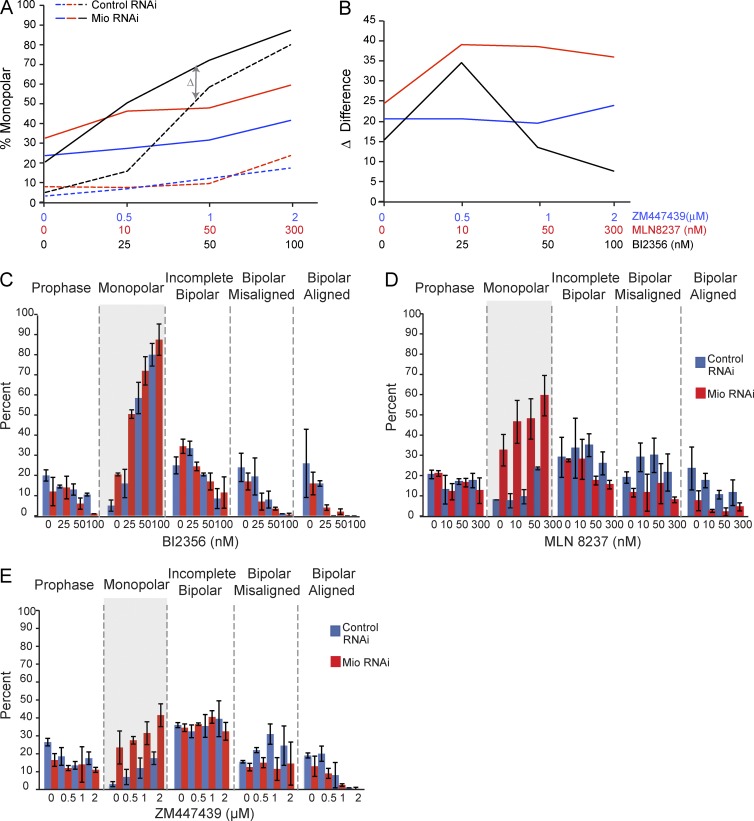
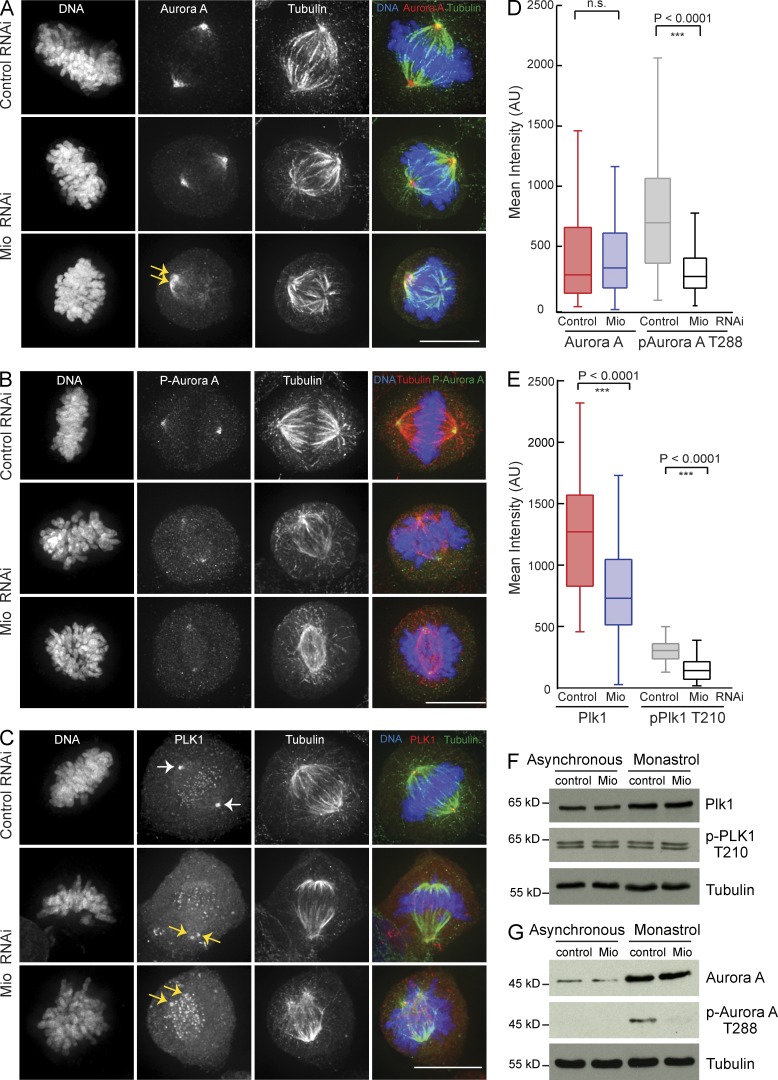
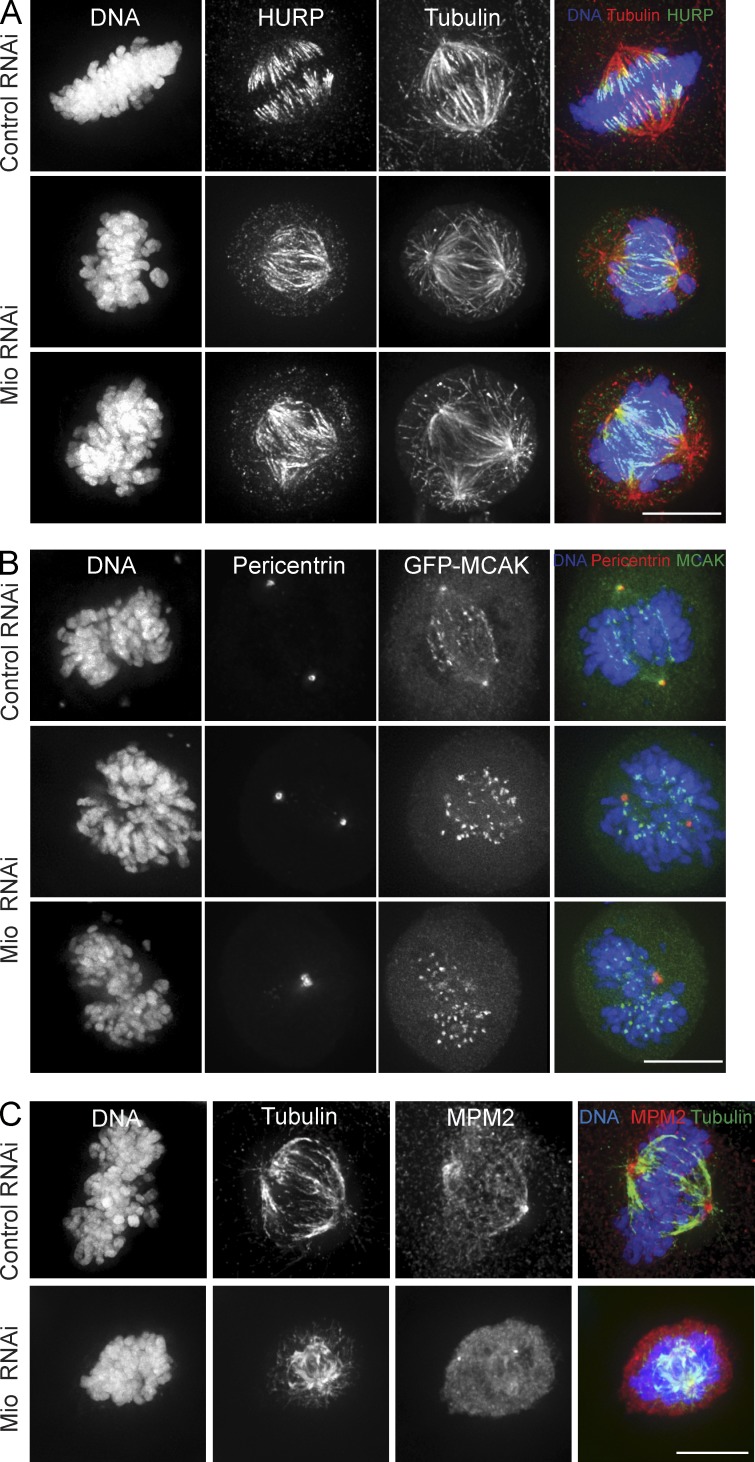
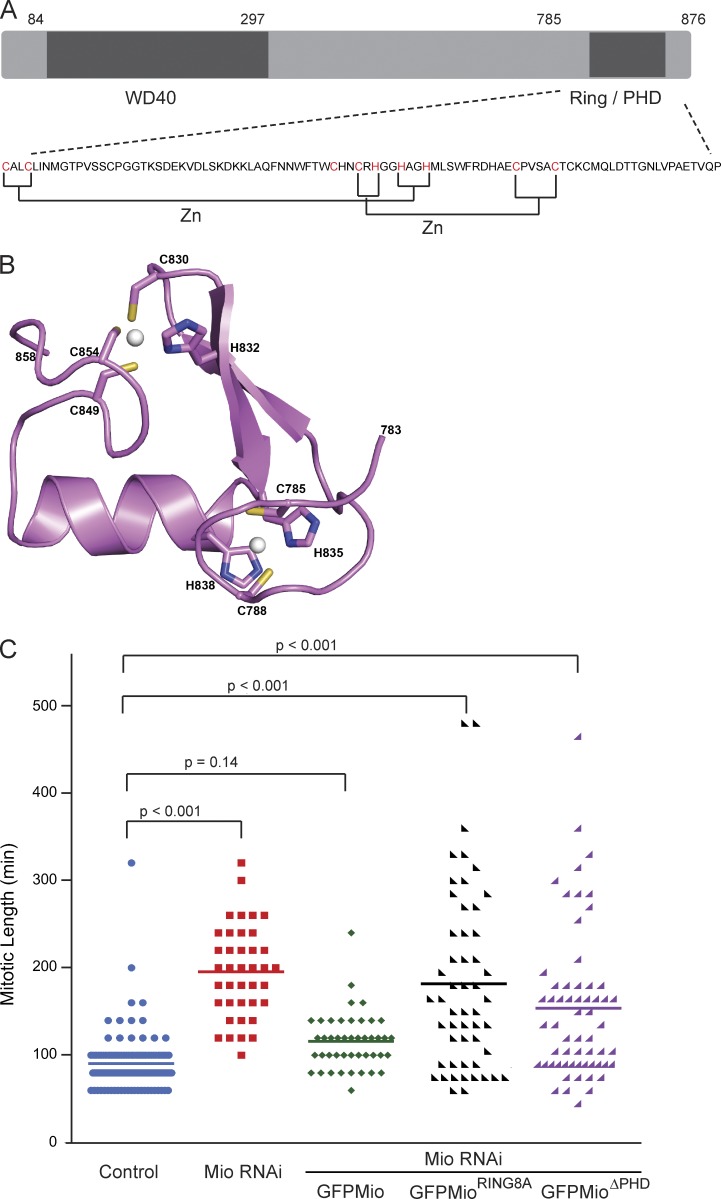
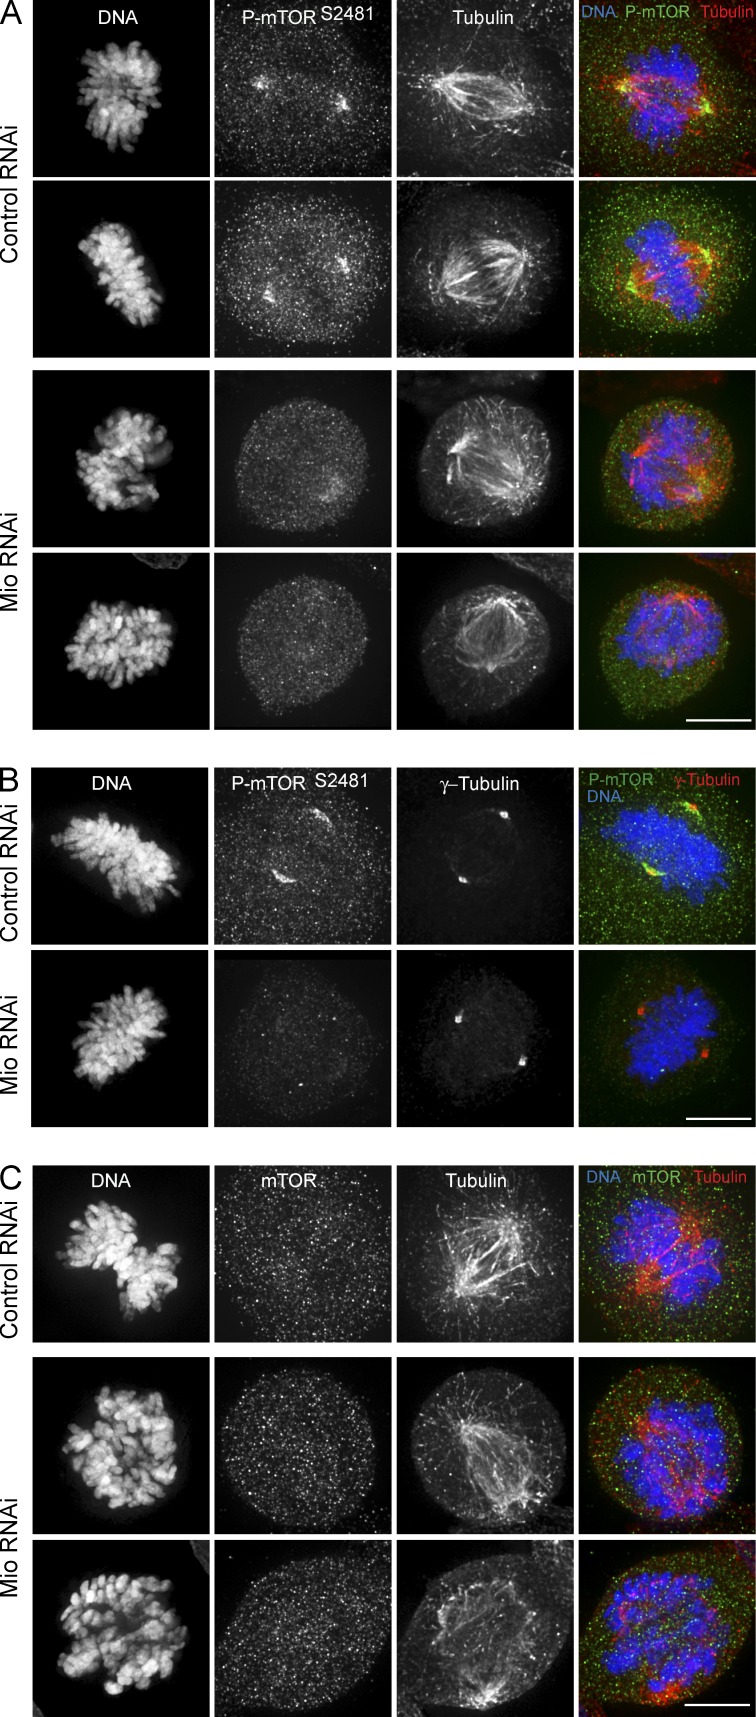
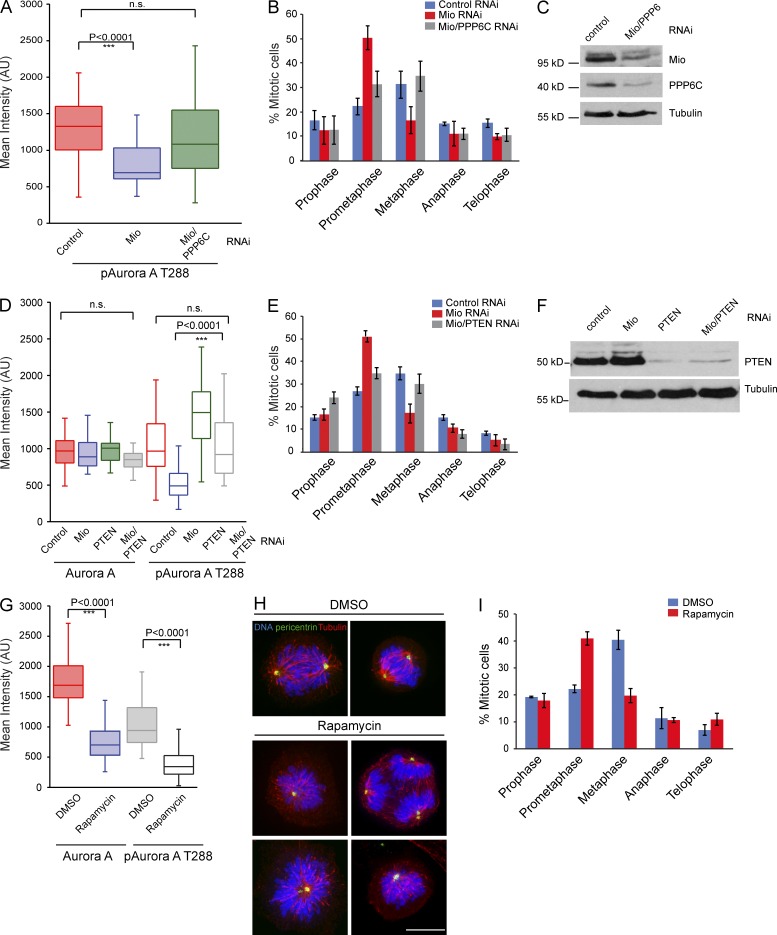
Coordination of cell growth and proliferation in response to nutrient supply is mediated by mammalian target of rapamycin (mTOR) signaling. In this study, we report that Mio, a highly conserved member of the SEACAT/GATOR2 complex necessary for the activation of mTORC1 kinase, plays a critical role in mitotic spindle formation and subsequent chromosome segregation by regulating the proper concentration of active key mitotic kinases Plk1 and Aurora A at centrosomes and spindle poles. Mio-depleted cells showed reduced activation of Plk1 and Aurora A kinase at spindle poles and an impaired localization of MCAK and HURP, two key regulators of mitotic spindle formation and known substrates of Aurora A kinase, resulting in spindle assembly and cytokinesis defects. Our results indicate that a major function of Mio in mitosis is to regulate the activation/deactivation of Plk1 and Aurora A, possibly by linking them to mTOR signaling in a pathway to promote faithful mitotic progression.


Figures

Figure 1.
Figure 1.
Seh1 interacts with the SEACAT complex both in interphase and mitosis. (A) Seh1 complexes were purified from a cell line stably expressing GFP-Seh1, HeLaEGP-SEH1. Cells were differentially labeled with isotopic amino acids by growth in SILAC media before immunopurification of GFP-Seh1 complexes. Where indicated, cells were arrested in mitosis using 200 ng/ml nocodazole for 14 h. Immunopurified GFP-Seh1 complexes were analyzed by quantitative mass spectrometry. Plot of log ratio H/M versus relative abundance (summarized peptide intensities normalized by molecular weight) for all quantified proteins is shown. Bait protein GFP-Seh1 (green circles) and the interactors Nup107 complex (purple diamonds) and SEACAT/GATOR2 complex (blue diamonds) are highlighted. This nonbiased quantitative experiment was performed twice in asynchronous cell populations and once in mitotically arrested cells, and top hits were chosen for targeted follow-up validation by immunoprecipitation/Western blot analysis using specific antibodies. (B) Mio interacts with Seh1 in mammalian cells. Immunoprecipitates (IP) are shown of total protein extracts from HeLa cells transfected with mCherry, mCherry-Mio, and EGFP-Seh1. Immunoprecipitation was performed using α-RFP binder, and Seh1 was detected using α-Seh1 antibody. (C) Immunoblots of HeLa cell lysates treated with siRNAs corresponding to negative control and Seh1 (probed using α-Mio and α-Seh1) show that depletion of Seh1 can affect Mio stability. (D) Immunoblots of HeLa cell lysates treated with siRNAs corresponding to negative control and Mio (probed using α-Mio) show efficient depletion of Mio protein with different siRNA oligos 48 h after transfection. (C and D) Tubulin served as a loading control. (E) Abnormal nuclear morphology detected after Mio depletion. HeLa cells transfected with control and Mio siRNA oligos for 48 h were stained with DAPI to reveal the DNA and nuclear morphology. (F) Mio depletion increases mitotic length, binucleation, and apoptosis. HeLa cells transfected with control or Mio siRNAs were incubated for 30 h before phase-contrast imaging for a further 19 h. Images were acquired every 15 min. Image sequences were then analyzed tracking individual control (n = 132) and Mio-depleted cells (n = 289) to determine their behavior. Fate profiles of live control or Mio-depleted cells are shown as a function of time. Bars represent total time spent at different cell cycle stages for individual cells. Starting point T = 0 is NEBD. Bar, 10 µm.
Figure 2.
Figure 2.
Mio is required for mitotic progression. (A) Mitotic index of control (blue bar) and Mio-depleted cells (red bar) 48 h after transfection (n = 3). (B) Depletion of Mio causes spindle assembly and cytokinesis defects. Selected maximum intensity projections from time-lapse images show the mitotic and cytokinesis defects. HeLa cell line stably expressing EGFP-tubulin (green) and mRFP-H2B (red), HeLaEGFPTubulin-mRFPH2B, was transfected with Mio siRNA oligos. Images were collected every 5 min at 46 h for a period of 120 min. Numbers indicate time in hours/minutes/seconds. (C) Quantitation of different mitotic stages for control (blue bars) and Mio-depleted cells (red bars; n = 3). (D) Quantitation of micronucleation and chromatin bridges in control and Mio-depleted cells. Error bars represent SD. (E) Binucleation index of control (blue bar) and Mio-depleted cells (red bar) 48 h after transfection (n = 3). (F) Mitotic progression scatter plots of anaphase onset with NEBD as T = 0 in control (blue) and Mio siRNA-treated cells (red) from live cell videos. Statistical significance was determined by a two-tailed, unpaired t test. (G) Quantitation of normal and misoriented cell divisions in cells treated as in B (n = 3). Bar, 10 µm.
Figure 3.
Figure 3.
Mio depletion leads to spindle misorientation and centrosomal defects. (A) Abnormal spindle morphology detected after Mio depletion. HeLa cells were transfected with control and Mio siRNA oligos for 48 h and stained with α-tubulin. (B) Quantification of metaphase spindle length between control (blue) and Mio-depleted cells (red) shows no significant change in the length of the mitotic spindle. (C) Schematic depicting the spindle angle (α) measurement relative to the fibronectin substratum. (D) Quantification of metaphase spindle angles between control (blue) and Mio-depleted cells (red) showing a significant increase of >20o of spindle angle. n = 40 from three experiments. (E) Quantification of mitotic metaphase cells with an unequal number of centrosomes and spindle poles. 3D maximum intensity projections of representative metaphase cells immunostained with α-pericentrin (green), α-tubulin (red), and DNA (blue) are shown on the right. 300 cells per condition (n = 3). Bars, 10 µm.
Figure 4.
Figure 4.
Bipolar spindle formation is delayed in Mio-depleted cells. (A) Control and Mio-depleted cells were arrested with Eg5 inhibitor Monastrol for 3 h. The drug was washed out with fresh medium, and cells were fixed at the indicated time points. Cells were immunostained with α-tubulin (red) and α-ACA (green). (B) Quantitation of spindle and chromosome alignment status in control and Mio-depleted cells at the indicated time points after Monastrol release. 300 cells/time point (n = 3). Bar, 10 µm.
Figure 5.
Figure 5.
Mio-depleted cells show sensitivity to Plk1 and Aurora A inhibition. (A) Quantitation of monopolar spindles in control (dotted lines) and Mio-depleted cells (solid lines) 46 h after siRNA transfection followed by 1.5-h incubation into the indicated concentrations of ZM447439, BI2356, and MLN8237. (B) The difference (Δ) in monopolar spindle percentage between control and Mio-depleted cells at each indicated drug concentration. (C–E) Mitotic profile of control and Mio-depleted cells 48 h after siRNA transfection followed by 1.5-h incubation into the indicated concentrations of BI2356 (C), MLN8237 (D), and ZM447439 (E). (A–E) 300 cells per condition/drug concentration (n = 3). Error bars represent SD. The highlighted gray areas of the monopolar spindles mitotic stage are used for the graphs in A and B.
Figure 6.
Figure 6.
Plk1 and Aurora A are misregulated after Mio depletion. (A) Control and Mio-depleted cells were fixed and immunostained with α–Aurora A (red), α-tubulin (green), and DNA (blue). Arrows point to centrosomes. (B) Control and Mio-depleted cells were fixed and immunostained with α-p–Aurora AT288 (green), α-tubulin (red), and DNA (blue). (C) Control and Mio-depleted cells were fixed and immunostained with α-Plk1 (red), α-tubulin (green), and DNA (blue). Arrows point to centrosomes. (D) Quantification of Aurora A and p–Aurora AT288 levels at spindle poles in control and Mio-depleted cells. Depletion of Mio reduces p–Aurora AT288 levels, whereas Aurora A is mostly retained. (E) Quantification graph of PLK1 and p-PLK1T210 levels at centrosomes in control and Mio-depleted cells. Both Plk1 and p-Plk1T120 levels at centrosomes are reduced. (D and E) Fluorescence intensities are in arbitrary units (AU). Error bars represent SD. (F and G) Immunoblots of HeLa cell lysates treated with siRNAs corresponding to negative control and Mio from asynchronous and Monastrol-arrested cells (probed using α-PLK1, α–p-PLK1T210, α–Aurora A, and α-p–Aurora AT288) show reduction of Aurora AT288ph signal upon Mio depletion, whereas total Aurora A, Plk1, and Plk1T210ph levels appear unchanged. Tubulin serves as a loading control. n.s., not significant. Bars, 10 µm.
Figure 7.
Figure 7.
Spindle assembly factors HURP and MCAK are misregulated after Mio depletion. (A) Control and Mio-depleted cells were fixed and immunostained with α-HURP (green), α-tubulin (red), and DNA (blue). (B) Control and Mio-depleted cells transfected with GFP-MCAK (green) were fixed and immunostained with α-pericentrin (red) and DNA (blue). (C) Control and Mio-depleted cells were fixed and immunostained with α-MPM2 (red), α-tubulin (green), and DNA (blue). Bars, 10 µm.
Figure 8.
Figure 8.
Mitotic progression is impaired in the absence of the Ring/PHD domain. (A) Schematic diagram showing the domain structure of Mio and the sequence of its C-terminal Ring/PHD domain. The predicted cysteines and histidines involved in zinc coordination are labeled in red. (B) Cartoon representation of predicted 3D molecular structure of Mio C-terminal Ring/PHD domain showing the mutated residues in stick form. Zinc ions are shown in ball representation (as white spheres). (C) Mitotic progression scatter plots with NEBD as T = 0 in control (blue), Mio siRNA-treated cells with and without (red) expression of siRNA-resistant versions of wild-type GFP-Mio (green), GFP-MioRing8A (black), and GFP-MioΔPHD (purple) from live cell videos. n = 214 cells from two independent experiments. Statistical significance was determined by an unpaired Student’s t test.
Figure 9.
Figure 9.
Activity of mTOR is reduced in mitotic cells after Mio depletion. (A) Control and Mio-depleted cells were fixed and immunostained with α–p-mTOR (Ser2481; green), α-tubulin (red), and DNA (blue). (B) Control and Mio-depleted cells were fixed and immunostained with α–p-mTOR (Ser2481; green), γ-tubulin (red), and DNA (blue). (C) Control and Mio-depleted cells were fixed and immunostained with α-mTOR (green), α-tubulin (red), and DNA (blue). Bars, 10 µm.
Figure 10.
Figure 10.
Activity of mTOR is reduced in mitotic cells after Mio depletion. (A) Quantification of p–Aurora AT288 levels at spindle poles in control, Mio-depleted, and Mio/PPP6C co-depleted cells. (B) Mitotic profile of control, Mio-depleted, and Mio/PPP6C co-depleted cells 48 h after siRNA transfection. 300 cells per condition (n = 3). (C and F) Immunoblots of HeLa cell lysates treated with siRNAs corresponding to negative control, Mio, Mio with PPP6C, PTEN, and Mio/PTEN from asynchronous cells (probed using α-Mio, α-PPP6C, and α-PTEN) show efficient depletion of Mio, PPP6C, and PTEN. Tubulin serves as a loading control. (D) Quantification of Aurora A and p–Aurora AT288 levels at spindle poles in control, Mio-depleted, and Mio/PTEN co-depleted cells. PTEN co-depletion with Mio rescues the p–Aurora AT288 levels reduction. (E) Mitotic profile of control, Mio-depleted, and Mio and PTEN co-depleted cells 48 h after siRNA transfection. 300 cells per condition (n = 3). (G) Quantification of Aurora A and p–Aurora AT288 levels at spindle poles in control DMSO- and rapamycin-treated cells. (A, D, and G) Fluorescence intensities are in arbitrary units (AU). (H) Control DMSO- and rapamycin-treated cells were fixed and immunostained with α-pericentrin (green), α-tubulin (red), and DNA (blue). (I) Mitotic profile of control DMSO- and rapamycin-treated cells after 4-h incubation ( n = 3). Error bars represent SD. n.s., not significant. Bar, 10 µm.

References

    1. Allan C., Burel J.M., Moore J., Blackburn C., Linkert M., Loynton S., Macdonald D., Moore W.J., Neves C., Patterson A., et al. . 2012. OMERO: flexible, model-driven data management for experimental biology. Nat. Methods. 9:245–253. 10.1038/nmeth.1896 - DOI - PMC - PubMed
    1. Andrews P.D., Ovechkina Y., Morrice N., Wagenbach M., Duncan K., Wordeman L., and Swedlow J.R.. 2004. Aurora B regulates MCAK at the mitotic centromere. Dev. Cell. 6:253–268. 10.1016/S1534-5807(04)00025-5 - DOI - PubMed
    1. Astrinidis A., Senapedis W., and Henske E.P.. 2006. Hamartin, the tuberous sclerosis complex 1 gene product, interacts with polo-like kinase 1 in a phosphorylation-dependent manner. Hum. Mol. Genet. 15:287–297. 10.1093/hmg/ddi444 - DOI - PubMed
    1. Bar-Peled L., Chantranupong L., Cherniack A.D., Chen W.W., Ottina K.A., Grabiner B.C., Spear E.D., Carter S.L., Meyerson M., and Sabatini D.M.. 2013. A tumor suppressor complex with GAP activity for the Rag GTPases that signal amino acid sufficiency to mTORC1. Science. 340:1100–1106. 10.1126/science.1232044 - DOI - PMC - PubMed
    1. Barr A.R., and Gergely F.. 2007. Aurora-A: the maker and breaker of spindle poles. J. Cell Sci. 120:2987–2996. 10.1242/jcs.013136 - DOI - PubMed

Publication types

MeSH terms

Associated data