. 2015 Jun 12:6:569.
doi: 10.3389/fmicb.2015.00569. eCollection 2015.

RNA-Seq analysis of isolate- and growth phase-specific differences in the global transcriptomes of enteropathogenic Escherichia coli prototype isolates

Affiliations

RNA-Seq analysis of isolate- and growth phase-specific differences in the global transcriptomes of enteropathogenic Escherichia coli prototype isolates

Tracy H Hazen et al. Front Microbiol. .

Abstract

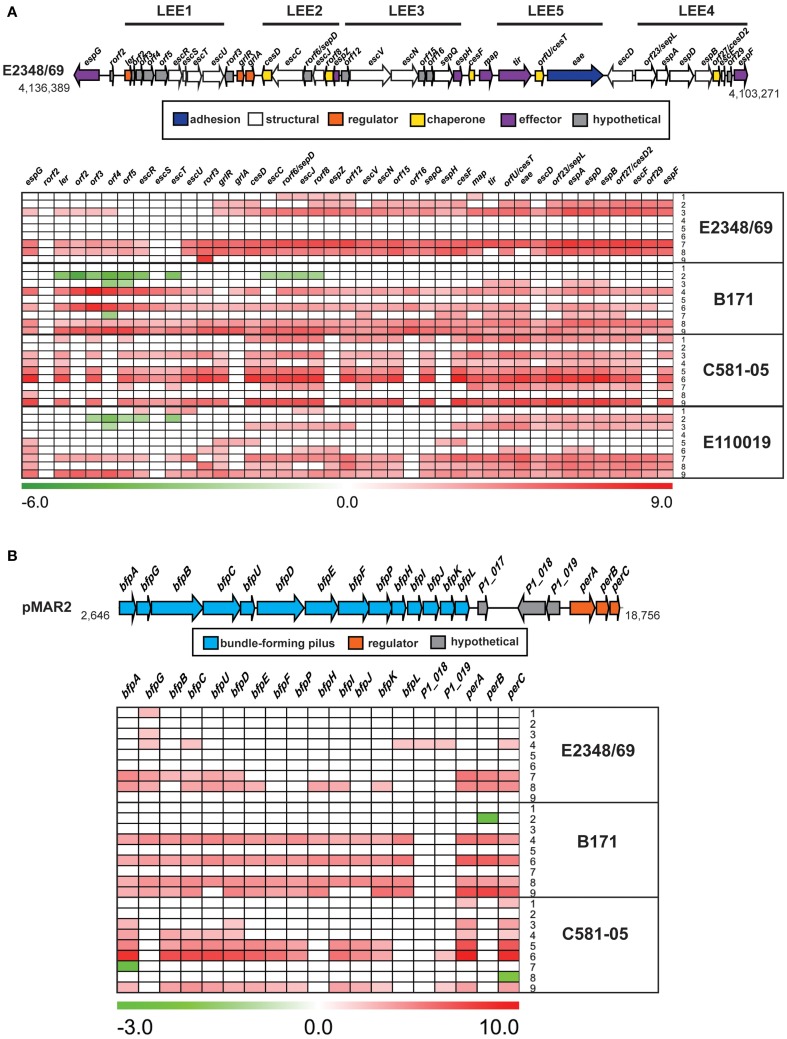
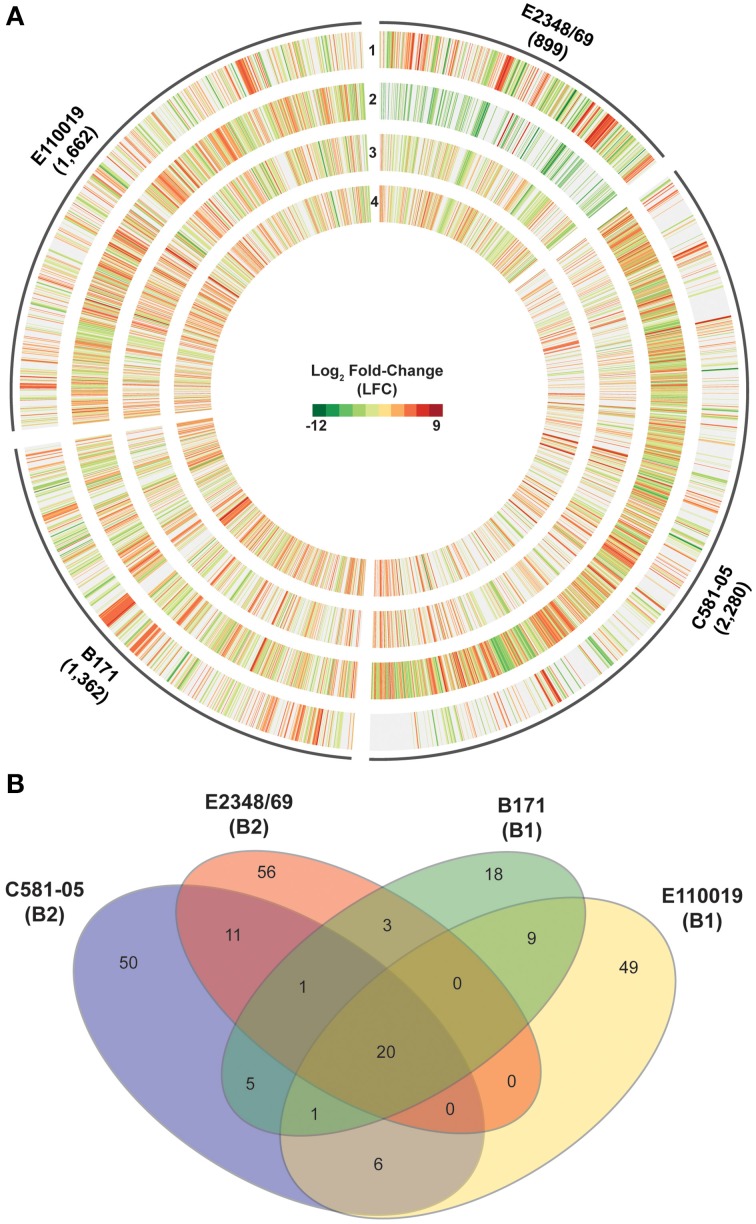
Enteropathogenic Escherichia coli (EPEC) are a leading cause of diarrheal illness among infants in developing countries. E. coli isolates classified as typical EPEC are identified by the presence of the locus of enterocyte effacement (LEE) and the bundle-forming pilus (BFP), and absence of the Shiga-toxin genes, while the atypical EPEC also encode LEE but do not encode BFP or Shiga-toxin. Comparative genomic analyses have demonstrated that EPEC isolates belong to diverse evolutionary lineages and possess lineage- and isolate-specific genomic content. To investigate whether this genomic diversity results in significant differences in global gene expression, we used an RNA sequencing (RNA-Seq) approach to characterize the global transcriptomes of the prototype typical EPEC isolates E2348/69, B171, C581-05, and the prototype atypical EPEC isolate E110019. The global transcriptomes were characterized during laboratory growth in two different media and three different growth phases, as well as during adherence of the EPEC isolates to human cells using in vitro tissue culture assays. Comparison of the global transcriptomes during these conditions was used to identify isolate- and growth phase-specific differences in EPEC gene expression. These analyses resulted in the identification of genes that encode proteins involved in survival and metabolism that were coordinately expressed with virulence factors. These findings demonstrate there are isolate- and growth phase-specific differences in the global transcriptomes of EPEC prototype isolates, and highlight the utility of comparative transcriptomics for identifying additional factors that are directly or indirectly involved in EPEC pathogenesis.

Keywords: RNA-sequencing; diversity; enteropathogenic Escherichia coli; pathogenesis; regulation.


Figures

Figure 1
Figure 1
Comparison of the genomic content of four EPEC prototype isolates. Venn diagram illustrating the number of shared and unique genes identified among the four EPEC prototype isolates using LS-BSR (Sahl et al., 2014). The E. coli phylogroup (Tenaillon et al., ; Hazen et al., 2013) of each of the prototype isolates is indicated in parentheses below the isolate name. The number of core genes is indicated, which are genes that are present with significant similarity (LS-BSR ≥ 0.8) in all four of the EPEC isolates. The number of shared genes is indicated in the overlapping regions, which are the genes that have significant similarity (LS-BSR ≥ 0.8) in two or three of the EPEC isolates, but are divergent (LS-BSR < 0.8) or absent (BSR < 0.4) in the other EPEC isolate or isolates. The number of unique genes identified in each EPEC isolate genome are the genes that have LS-BSR ≥ 0.8 in the one genome and <0.8 in the other three genomes. The number of genes in parentheses represents the number of unique genes of each EPEC isolate, which have LS-BSR ≥ 0.8 in the one genome and <0.4 in the other three genomes.
Figure 2
Figure 2
Comparison of the RNA-Seq samples. A heatmap with clustering analysis of the expression values was constructed for 2000 LS-BSR gene clusters that were conserved and also expressed in all four EPEC prototype isolates. The normalized gene expression values were used to compute the standard deviation for each LS-BSR gene cluster across all samples. There were 2000 of the 3302 LS-BSR expressed gene clusters that had the greatest standard deviations of expression values that are represented in this heatmap, constructed using the R package gplots v2.11.0. A colored rectangle indicates the media type or experimental treatment.
Figure 3
Figure 3
Isolate- and growth phase-specific differences in the global transcriptomes of the EPEC prototype isolates. Circular plots of the log2 fold-change (LFC) differential expression (DE) values of gene expression when grown to an OD600 = 0.5 in DMEM compared to LB, for the EPEC prototype isolates. Each isolate is in a different panel designated as follows: (A) E2348/69, (B) B171, (C) C581-05, and (D) E110019. The genes are organized clockwise based on their locus tags for the chromosome and the pMAR2 plasmid of E2348/69, and for the pseudomolecule sequences generated for B171, C581-05, and E110019, which are organized relative to the gene order of E2348/69 as a reference. In each of the circular plots, each of the following tracks numbered sequentially from outside to inside represent the following sample comparisons: DMEM vs. LB OD600 = 1.0 (track 1), DMEM vs. LB OD600 = 0.5 (track 2), DMEM vs. LB OD600 = 0.2 (track 3), DMEM OD600 = 1.0 vs. DMEM OD600 = 0.2 (track 4), DMEM OD600 = 1.0 vs. DMEM OD600 = 0.5 (track 5), DMEM OD600 = 0.5 vs. DMEM OD600 = 0.2 (track 6), LB OD600 = 1.0 vs. LB OD600 = 0.2 (track 7), LB OD600 = 1.0 vs. LB OD600 = 0.5 (track 8), LB OD600 = 0.5 vs. LB OD600 = 0.2 (track 9). The values displayed exhibited significant DE per the following criteria: LFC ≥2, ≤-2, minimum read count = 10, false discovery rate (FDR) ≤ 0.05.
Figure 4
Figure 4
Comparison of the virulence regulons of the EPEC prototype isolates. (A) Circular plot comparing the log2 fold-change (LFC) values for genes that exhibited significant differential expression (DE) for the EPEC prototype isolates grown to an OD600 = 0.5 in DMEM compared to LB. Genes that exhibited significant DE in DMEM compared to LB met the following criteria: LFC ≥2, ≤-2, minimum read count = 10, false discovery rate (FDR) ≤ 0.05. The number of genes that had significant DE is indicated in parentheses below each isolate name. The outermost track of each EPEC isolate displays the LFC values of each of the significant DE genes for that isolate, and the genes are ordered clockwise in the order they appear in the completed or draft genome. Each of the inner tracks displays the LFC values of each gene with significant DE from another EPEC prototype isolate. These significant DE genes have ≥90% nucleotide identity to the corresponding gene in the outermost track. (B) Venn diagram showing the number of genes differentially-expressed for each of the four EPEC prototype isolates analyzed in this study grown to an OD600 = 0.5 in DMEM compared to LB. The E. coli phylogroup (Tenaillon et al., ; Hazen et al., 2013) of each of the prototype isolates is indicated in parentheses below the isolate name. The number of core genes is indicated that are highly conserved (LS-BSR ≥ 0.8) in all four of the EPEC isolates that also exhibited significant DE in all four of the EPEC isolates. The number of genes that were identified as highly-conserved (LS-BSR ≥ 0.8) that also exhibited significant DE in two or three EPEC isolates and divergent or absent (LS-BSR < 0.8) is also designated. The number of isolate-specific genes indicates those genes that were exclusive to each EPEC isolate (LS-BSR ≥ 0.4 and <0.4 in all other EPEC isolates) and also exhibited significant DE during growth to an OD600 = 0.5 in DMEM compared to LB.
Figure 5
Figure 5
Comparison of the isolate- and growth phase-specific differences in the expression of genes in the LEE and BFP regions. A diagram and heatmap of the isolate- and growth phase-specific differences in expression of (A) genes encoded within the LEE region of E2348/69, B171, E110019, and C581-05, and (B) genes of the BFP operon encoded by the EAF plasmids of E2348/69, B171, and C581-05 (note E110019 naturally lacks the BFP encoding plasmid). Red indicates increased differential expression, green indicates decreased differential expression, and white indicates the difference in expression was not significant or a gene was not present in the EPEC isolate. Each row represents the differential expression (log2 fold-change; LFC) for the following different sample comparisons: LB OD600 = 0.5 vs. LB OD600 = 0.2 (row 1), LB OD600 = 1.0 vs. LB OD600 = 0.5 (row 2), LB OD600 = 1.0 vs. LB OD600 = 0.2 (row 3), DMEM OD600 = 0.5 vs. DMEM OD600 = 0.2 (row 4), DMEM OD600 = 1.0 vs. DMEM OD600 = 0.5 (row 5), DMEM OD600 = 1.0 vs. DMEM OD600 = 0.2 (row 6), DMEM vs. LB OD600 = 0.2 (row 7), DMEM vs. LB OD600 = 0.5 (row 8), and DMEM vs. LB OD600 = 1.0 (row 9).
Figure 6
Figure 6
Comparison of the global transcriptional response of the EPEC prototype isolates during adherence to HeLa cells compared to planktonic growth in DMEM broth. (A) Circular plot of log2 fold-change (LFC) values of genes that exhibited significant differential expression (DE) for each of the EPEC prototype isolates during growth in broth culture or during adherence to HeLa cells during in vitro tissue culture assays. The tracks contain LFC values of the following DE comparisons: DMEM OD600 = 0.5 vs. LB OD600 = 0.5 (track 1), HeLa vs. DMEM OD600 = 1.0 (track 2), HeLa vs. DMEM OD600 = 0.5 (track 3), and HeLa vs. DMEM OD600 = 0.2 (track 4). Red indicates increased DE, green indicates decreased DE, and white indicates the difference in expression was not significant or a gene was not present in the EPEC isolate. (B) Venn diagram showing the number of genes differentially-expressed for each of the four EPEC prototype isolates analyzed in this study grown to an OD600 = 0.5. The E. coli phylogroup (Tenaillon et al., ; Hazen et al., 2013) of each of the prototype isolates is indicated in parentheses below the isolate name. The number of core genes is indicated that were highly conserved (LS-BSR ≥ 0.8) in all four of the EPEC isolates and also exhibited significant DE in all four of the EPEC isolates during adherence to HeLa cells compared to growth in DMEM broth culture to an OD600 = 0.5. The number of genes that were identified with significant similarity (LS-BSR ≥ 0.8) and also exhibited significant DE in the different combinations of two or three EPEC isolates is also designated. The number of isolate-specific genes indicates those genes that were exclusive to each EPEC isolate (LS-BSR ≥ 0.4 and <0.4 in all other EPEC isolates) and also exhibited significant DE during adherence to HeLa cells compared to growth in DMEM broth culture to an OD600 = 0.5.

Similar articles

Cited by

References

    1. Abu-Ali G. S., Ouellette L. M., Henderson S. T., Lacher D. W., Riordan J. T., Whittam T. S., et al. . (2010). Increased adherence and expression of virulence genes in a lineage of Escherichia coli O157:H7 commonly associated with human infections. PLoS ONE 5:e10167. 10.1371/journal.pone.0010167 - DOI - PMC - PubMed
    1. Anders S., Huber W. (2010). Differential expression analysis for sequence count data. Genome Biol. 11:R106. 10.1186/gb-2010-11-10-r106 - DOI - PMC - PubMed
    1. Anders S., Pyl P. T., Huber W. (2014). HTSeq-a Python framework to work with high-throughput sequencing data. Bioinformatics 31, 166–169. 10.1093/bioinformatics/btu638 - DOI - PMC - PubMed
    1. Bergholz T. M., Wick L. M., Qi W., Riordan J. T., Ouellette L. M., Whittam T. S. (2007). Global transcriptional response of Escherichia coli O157:H7 to growth transitions in glucose minimal medium. BMC Microbiol. 7:97. 10.1186/1471-2180-7-97 - DOI - PMC - PubMed
    1. Bhatt S., Edwards A. N., Nguyen H. T., Merlin D., Romeo T., Kalman D. (2009). The RNA binding protein CsrA is a pleiotropic regulator of the locus of enterocyte effacement pathogenicity island of enteropathogenic Escherichia coli. Infect. Immun. 77, 3552–3568. 10.1128/IAI.00418-09 - DOI - PMC - PubMed

LinkOut - more resources