. 2015 Jun;2(6):636-47.
doi: 10.1002/acn3.201. Epub 2015 Apr 24.

Alzheimer's loci: epigenetic associations and interaction with genetic factors

Affiliations

Alzheimer's loci: epigenetic associations and interaction with genetic factors

Lori B Chibnik et al. Ann Clin Transl Neurol. 2015 Jun.

Abstract

Objective: We explore the role of DNA methylation in Alzheimer's disease (AD). To elucidate where DNA methylation falls along the causal pathway linking risk factors to disease, we examine causal models to assess its role in the pathology of AD.

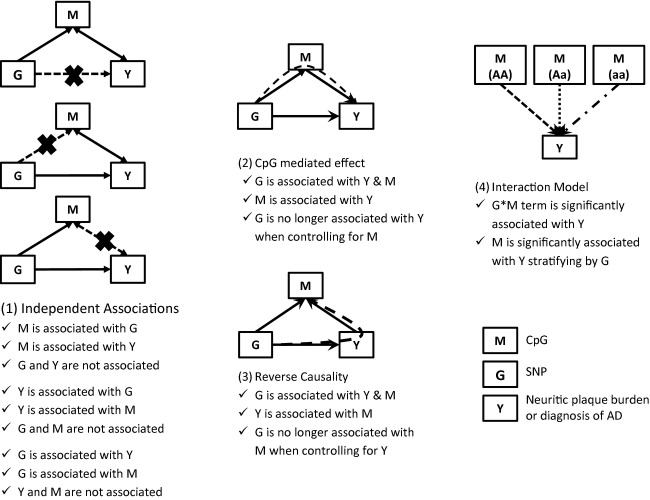
Methods: DNA methylation profiles were generated in 740 brain samples using the Illumina HumanMet450K beadset. We focused our analysis on CpG sites from 11 AD susceptibility gene regions. The primary outcome was a quantitative measure of neuritic amyloid plaque (NP), a key early element of AD pathology. We tested four causal models: (1) independent associations, (2) CpG mediating the association of a variant, (3) reverse causality, and (4) genetic variant by CpG interaction.

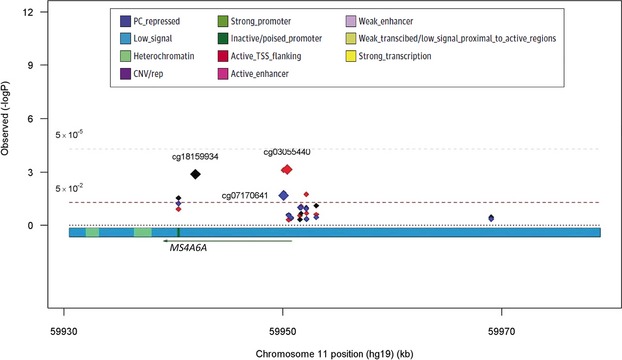
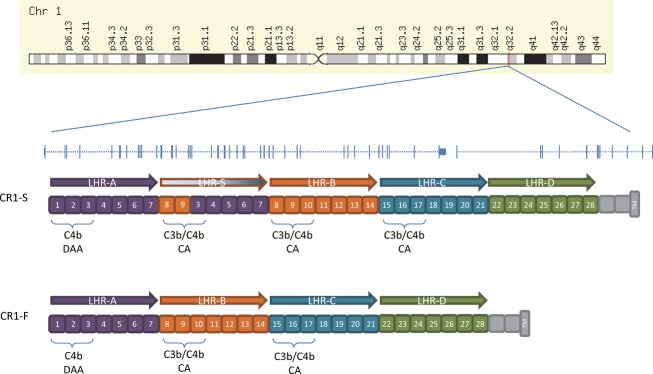
Results: Six genes regions (17 CpGs) showed evidence of CpG associations with NP, independent of genetic variation - BIN1 (5), CLU (5), MS4A6A (3), ABCA7 (2), CD2AP (1), and APOE (1). Together they explained 16.8% of the variability in NP. An interaction effect was seen in the CR1 region for two CpGs, cg10021878 (P = 0.01) and cg05922028 (P = 0.001), in relation to NP. In both cases, subjects with the risk allele rs6656401(AT) (/) (AA) display more methylation being associated with more NP burden, whereas subjects with the rs6656401(TT) protective genotype have an inverse association with more methylation being associated with less NP.

Interpretation: These observations suggest that, within known AD susceptibility loci, methylation is related to pathologic processes of AD and may play a largely independent role by influencing gene expression in AD susceptibility loci.


Figures

Figure 1
Figure 1
Proposed models incorporating the role of DNA methylation in Alzheimer’s disease (AD) susceptibility. Four possible models are tested: (1) Independent associations of CpG and genetic variants with the outcome measure, (2) CpG-mediated effect in which DNA methylation mediates the effect of a genetic variant, (3) Reverse causality in which the outcome measure (such as AD) leads to DNA methylation changes, and (4) interaction model in which the association of a CpG varies based on a genetic variant. Note that models (2) and (3) can only be tested when all three components of the models are associated with one another: in our data, only the CR1 and APOE loci are tested. Dashed lines represent hypothesized associations tested in each model and solid lines are significant associations required to test the model.
Figure 2
Figure 2
AD susceptibility loci BIN1 displays multiple, independent associations of CpG methylation with neuritic plaque (NP) burden. The figure represents the results of analyses for the BIN1 region, with the physical position presented on the x axis and −log10 P-values presented in the y axis. Diamonds represent the individual CpGs across the gene region that were tested in the analysis. The state of the chromatin in the dorsolateral prefrontal cortex of a cognitively nonimpaired individual is presented below the x axis; this map is based on the derivation of chromatin state in 200 bp segments using data generated from the immunoprecipitation of chromatin marks. The chromatin states are defined in a box at the top right of the figure. The red diamonds report the results of the primary model relating CpG methylation and NP burden using a model adjusted for age at death, sex, batch, study, and bisulfite conversion fraction. The black diamonds report the results of the primary model with the additional adjustment for the top CpG, cg22883280, to identify secondary, independent associations such as cg04019522. The blue diamonds report the primary model adjusted for both cg22883290 and cg04019522 showing a third independently associated CpG, cg08663425. All P-values are reported in Table S1.
Figure 3
Figure 3
AD susceptibility loci MS4A6A displays multiple, independent associations of CpG methylation with neuritic plaque (NP) burden. The figure represents the results of analyses for the MS4A6A region, with the physical position presented on the x axis and −log10 P-values presented in the y axis. Diamonds represent the individual CpGs across the gene region that were tested in the analysis. The state of the chromatin in the dorsolateral prefrontal cortex of a cognitively nonimpaired individual is presented below the x axis; this map is based on the derivation of chromatin state in 200 bp segments using data generated from the immunoprecipitation of chromatin marks. The chromatin states are defined in a box at the top right of the figure. The red diamonds are from the primary model testing for NP association using a model adjusted for age at death, sex, batch, study, and bisulfite conversion fraction. The black diamonds report the results of the primary model with the additional adjustment for the top CpG, cg03055440 and the blue diamonds show the results from the primary model adjusted for the top two independent CpGs, cg03055440 and cg1815993, showing a third independently associated CpG, cg07170641. All P-values are reported in Table S1.
Figure 4
Figure 4
AD susceptibility loci CLU displays multiple, independent associations of CpG methylation with neuritic plaque (NP) burden. The figure represents the results of analyses for the CLU region, with the physical position presented on the x axis and −log10 P-values presented in the y axis. Diamonds represent the individual CpGs across the gene region that were tested in the analysis. The state of the chromatin in the dorsolateral prefrontal cortex of a cognitively nonimpaired individual is presented below the x axis; this map is based on the derivation of chromatin state in 200 bp segments using data generated from the immunoprecipitation of chromatin marks. The chromatin states are defined in a box at the top right of the figure. The red diamonds are from the primary model testing for NP association. The black diamonds report the results of the primary model with the additional adjustment for the top CpG, cg16292768. All P-values are reported in Table S1.
Figure 5
Figure 5
Genomic architecture of the CR1 locus in relation to the major CR1 isoforms.

References

    1. Lambert JC, Heath S, Even G, et al. Genome-wide association study identifies variants at CLU and CR1 associated with Alzheimer’s disease. Nat Genet. 2009;41:1094–1099. - PubMed
    1. Hollingworth P, Harold D, Sims R, et al. Common variants at ABCA7, MS4A6A/MS4A4E, EPHA1, CD33 and CD2AP are associated with Alzheimer’s disease. Nat Genet. 2011;43:429–435. - PMC - PubMed
    1. Carrasquillo MM, Zou F, Pankratz VS, et al. Genetic variation in PCDH11X is associated with susceptibility to late-onset Alzheimer’s disease. Nat Genet. 2009;41:192–198. - PMC - PubMed
    1. Harold D, Abraham R, Hollingworth P, et al. Genome-wide association study identifies variants at CLU and PICALM associated with Alzheimer’s disease. Nat Genet. 2009;41:1088–1093. - PMC - PubMed
    1. Naj AC, Jun G, Beecham GW, et al. Common variants at MS4A4/MS4A6E, CD2AP, CD33 and EPHA1 are associated with late-onset Alzheimer’s disease. Nat Genet. 2011;43:436–441. - PMC - PubMed

LinkOut - more resources