. 2015 Jun 30;13(6):e1002177.
doi: 10.1371/journal.pbio.1002177. eCollection 2015 Jun.

Dynamically Allocated Hub in Task-Evoked Network Predicts the Vulnerable Prefrontal Locus for Contextual Memory Retrieval in Macaques

Affiliations

Dynamically Allocated Hub in Task-Evoked Network Predicts the Vulnerable Prefrontal Locus for Contextual Memory Retrieval in Macaques

Takahiro Osada et al. PLoS Biol. .

Abstract

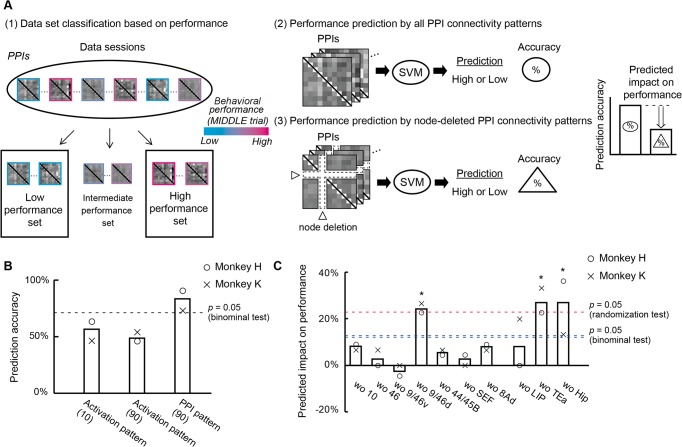
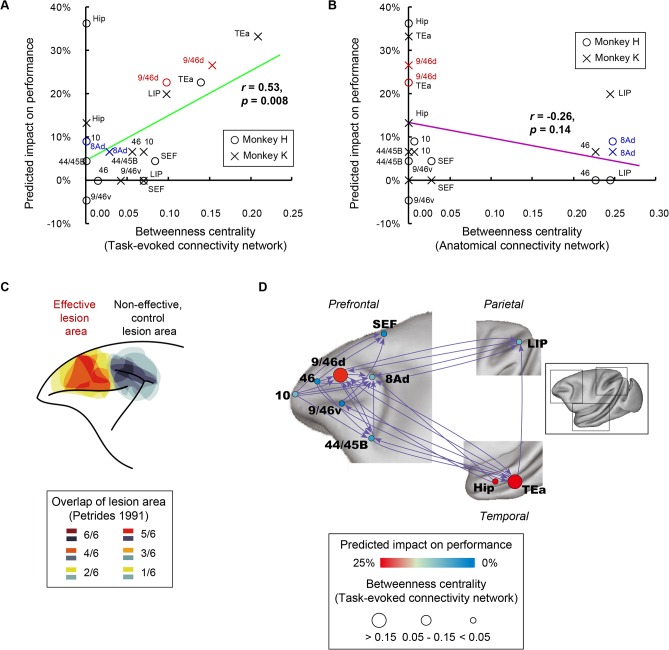
Neuroimaging and neurophysiology have revealed that multiple areas in the prefrontal cortex (PFC) are activated in a specific memory task, but severity of impairment after PFC lesions is largely different depending on which activated area is damaged. The critical relationship between lesion sites and impairments has not yet been given a clear mechanistic explanation. Although recent works proposed that a whole-brain network contains hubs that play integrative roles in cortical information processing, this framework relying on an anatomy-based structural network cannot account for the vulnerable locus for a specific task, lesioning of which would bring impairment. Here, we hypothesized that (i) activated PFC areas dynamically form an ordered network centered at a task-specific "functional hub" and (ii) the lesion-effective site corresponds to the "functional hub," but not to a task-invariant "structural hub." To test these hypotheses, we conducted functional magnetic resonance imaging experiments in macaques performing a temporal contextual memory task. We found that the activated areas formed a hierarchical hub-centric network based on task-evoked directed connectivity, differently from the anatomical network reflecting axonal projection patterns. Using a novel simulated-lesion method based on support vector machine, we estimated severity of impairment after lesioning of each area, which accorded well with a known dissociation in contextual memory impairment in macaques (impairment after lesioning in area 9/46d, but not in area 8Ad). The predicted severity of impairment was proportional to the network "hubness" of the virtually lesioned area in the task-evoked directed connectivity network, rather than in the anatomical network known from tracer studies. Our results suggest that PFC areas dynamically and cooperatively shape a functional hub-centric network to reallocate the lesion-effective site depending on the cognitive processes, apart from static anatomical hubs. These findings will be a foundation for precise prediction of behavioral impacts of damage or surgical intervention in human brains.


Conflict of interest statement

The authors have declared that no competing interests exist.

Figures

Fig 1
Fig 1. Temporal-order judgment task and behavioral performance of monkeys.
(A) Trial structure in the temporal-order judgment task. In each trial, monkeys pulled a joystick to initiate the trial (Warning), after which a list of stimuli was presented serially (Cue). After a delay (Delay), two stimuli from the list were presented simultaneously (Choice). The monkeys were required to select the stimulus that had been presented more recently in the list. The time parameters and trial structure for monkey H are shown here. The stimuli were selected from a 1,200-picture pool of natural and artificial objects (from Microsoft Clip Art or HEMERA Photo-Object database) in a pseudorandom order. The images provided in this figure are representations only and were not used in the experiment. (B) Percentages of correct responses (upper) and reaction times (lower) for each monkey during scanning sessions. The dashed line indicates the chance level. Error bars indicate standard deviation (SD) across sessions. * p < 10−4, t-test. † p < 10−4, †† p < 10−5, ††† p < 10−7, paired t-test.
Fig 2
Fig 2. Brain regions active for temporal-order judgment.
(A) Activity related to temporal-order judgment revealed by the contrast of MIDDLE minus BOTH-END. An activation map is superimposed on the inflated brain: top, lateral view; bottom, anterior view. Inset shows the atlas of the macaque prefrontal cortex based on Petrides (2005) [4] and Petrides (1994) [46]. ps, principal sulcus; as sup, superior branch of arcuate sulcus; as inf, inferior branch of arcuate sulcus. (B–D) Activation map is superimposed on transverse sections (B), coronal sections (C), and sagittal sections (D). LIP, lateral intraparietal area; SEF, supplementary eye field; Hip, hippocampus; ips, intraparietal sulcus; sts, superior temporal sulcus.
Fig 3
Fig 3. Hub-centric cortical network for temporal-order judgment.
(A) PPI (MIDDLE > BOTH-END). Color t-map of PPI is superimposed on the inflated brain. Upper and lower panels show the PPI maps for the seeds in areas 10 and 9/46d, respectively. (B, C) Two bar plots in each column show z-values for PPIs from area 10 (B) or area 9/46d (C) to other ipsilateral homotopic areas (gray) and PPIs from other homotopic areas to area 10 (B) or area 9/46d (C) (white). Dashed lines indicate significant z-value (p = 0.05 [FDR correction]). * p < 0.05 (FDR correction). (D) PPI matrix among the ten homotopic areas. Rows and columns indicate seed and target areas, respectively. Significant connectivities are enclosed by thick black lines (p < 0.05 [FDR correction]). (E) Betweenness centralities of each area calculated based on (D). The dashed line indicates the significance at p = 0.05 (randomization test [comparison with the distribution of the randomized network]). * p < 0.05. (F) PPI matrix among the ten homotopic areas without assumptions of directionality. The weight of the connection between A and B is evaluated as the mean value of PPIA->B and PPIB->A. (G) Betweenness centralities of each area calculated based on (F). The dashed line indicates significance at p = 0.05 (randomization test). * p < 0.05. (H) Anatomical connectivity matrix among the ten homotopic areas. Rows and columns indicate seed and target areas, respectively. A white (black) square indicates the presence (absence) of anatomical connection from row to column. Anatomical information is based on the CoCoMac database [41,47,48]. The projections to/from areas 8Ad, SEF, and LIP listed in the matrix are categorized as those to/from areas 8A, 6DR, and POa in CoCoMac, respectively. (I) Betweenness centralities of each area calculated based on (H). The dashed line indicates significance at p = 0.05 (randomization test). * p < 0.05.
Fig 4
Fig 4. Dynamic reallocation of functional hub in response to demands of the delayed matching-to-sample task.
(A) Trial structure in the DMS task. The monkeys were required to select the stimulus that had been presented as a sample stimulus. The stimuli of natural and artificial objects were chosen from Microsoft Clip Art or HEMERA Photo-Object database. The images provided in this figure are representations only and were not used in the experiment. (B) Percentages of correct responses (upper) and reaction times (lower) for each monkey. Behavioral performance of all the trials in the DMS task (yellow) is compared with that in the temporal-order judgment task (gray). The dashed line indicates the chance level. Error bars indicate SD across sessions. * p < 0.0003, † p < 0.002, t-test. (C) Brain regions active for the DMS task. Activation map is superimposed on coronal sections. (D) PPI matrix among the 15 homotopic areas identified in the DMS task. Rows and columns indicate seed and target regions, respectively. Significant connectivities are enclosed by thick black lines (p < 0.05 [FDR correction]). (E) Betweenness centralities of each area calculated based on (D). The dashed line indicates the significance at p < 0.05 (randomization test). * p < 0.05. (F) Anatomical connectivity matrix among the homotopic areas. Rows and columns indicate seed and target areas, respectively. A white (black) square indicates the presence (absence) of anatomical connection from row to column. Anatomical information is based on CoCoMac database. The areas to which the same labels are given in CoCoMac database area merged respectively. (G) Betweenness centralities of each area calculated based on (F). The dashed line indicates significance at p = 0.05 (randomization test). * p < 0.05.
Fig 5
Fig 5. Prediction of behavioral performance and behavioral impairment after lesioning based on connectivity pattern.
(A) Schematic of SVM-based MVPA prediction. (1) First, the whole data session set was divided into three classes based on behavioral performance in the MIDDLE trials (high, intermediate, and low performance sets). (2) Second, performance levels (high or low) in each session were predicted from the PPI connectivity pattern. (3) Finally, using node-deleted PPI connectivity patterns, SVM prediction was conducted. By comparing the prediction accuracies between (2) and (3), the predicted impact on performance after removal of a certain area was assessed. (B) Accuracy of behavioral performance prediction using activation patterns among the ten areas with ten features (left), activation patterns with 90 features (middle), and PPI connectivity patterns (right). The dashed line indicates accuracy significantly higher than chance (p = 0.05, binominal test, for group). Each circle and cross represents data for monkey H and monkey K, respectively. The number of features is shown in the brackets. (C) Predicted impact on performance after removal of the indicated areas is plotted. The red dashed line indicates significant predicted impact on performance (p = 0.05, randomization test, for group). * p < 0.05. The blue double dashed lines indicate prediction accuracy significantly higher than chance (p = 0.05, binominal test, for group). Bars below the blue double dashed lines indicate prediction accuracies still significantly better than chance after removal of the area.
Fig 6
Fig 6. Relationship of betweenness centrality and predicted behavioral impairment after lesioning.
(A) Betweenness centrality calculated based on task-evoked connectivity (horizontal axis) and predicted impact on performance (vertical axis) for each area for each monkey are plotted as a scattergram. The green line was fitted (r = 0.53, p = 0.008). (B) Betweenness centrality calculated based on anatomical connectivity (horizontal axis) and predicted impact on performance (vertical axis) for each area for each monkey are plotted as a scattergram. The purple line was fitted (r = -0.26, p = 0.14). (C) Areas where lesions induced impairment in temporal-order judgment; data were compiled from Petrides (1991) [18]. Red-yellow color code and gray code indicate the overlap of the lesion area among six hemispheres for mid-dorsolateral prefrontal area (effective lesion area) and periarcuate area (noneffective, control lesion area), respectively. (D) Schematic illustration of interareal connections. PPIs with p < 0.01 (FDR correction) are displayed as directed edges for display purpose. Node color indicates predicted impact on performance. Node diameter represents betweenness centrality. Note that causality cannot be inferred from PPI directionality.

Comment in

Similar articles

Cited by

References

    1. Milner B, Petrides M. (1984) Behavioural effects of frontal-lobe lesions in man. Trends Neurosci 7(11): 403–407.
    1. Shimamura AP, Janowsky JS, Squire LR (1991) What is the role of frontal lobe damage in memory disorders? In Levin HS, Eisenberg HM, Benton AL, editors. Frontal Lobe Functioning and Dysfunction. New York: Oxford University Press; pp. 173–195.
    1. Miyashita Y. (2004) Cognitive memory: Cellular and network machineries and their top-down control. Science 306(5695): 435–440. - PubMed
    1. Petrides M. (2005) Lateral prefrontal cortex: Architectonic and functional organization. Philos Trans R Soc Lond B Biol Sci 360: 781–795. - PMC - PubMed
    1. Osada T, Adachi Y, Kimura HM, Miyashita Y. (2008) Towards understanding of the cortical network underlying associative memory. Philos Trans R Soc Lond B Biol Sci 363(1500): 2187–2199. 10.1098/rstb.2008.2271 - DOI - PMC - PubMed

Publication types