

Identification of Personalized Chemoresistance Genes in Subtypes of Basal-Like Breast Cancer Based on Functional Differences Using Pathway Analysis
- PMID: 26126114
- PMCID: PMC4488356
- DOI: 10.1371/journal.pone.0131183
Identification of Personalized Chemoresistance Genes in Subtypes of Basal-Like Breast Cancer Based on Functional Differences Using Pathway Analysis
Abstract
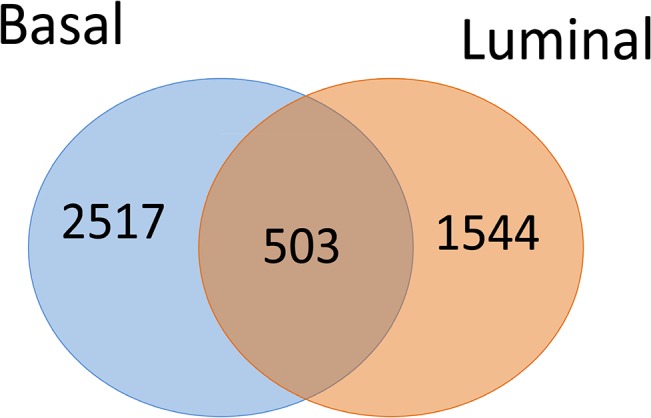
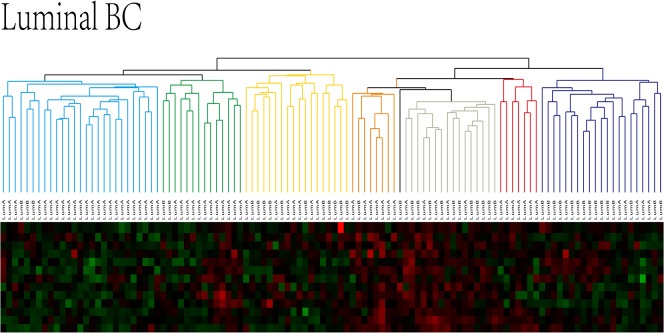
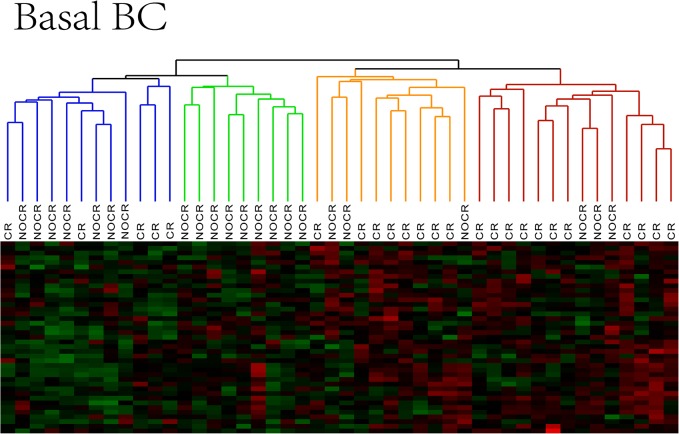
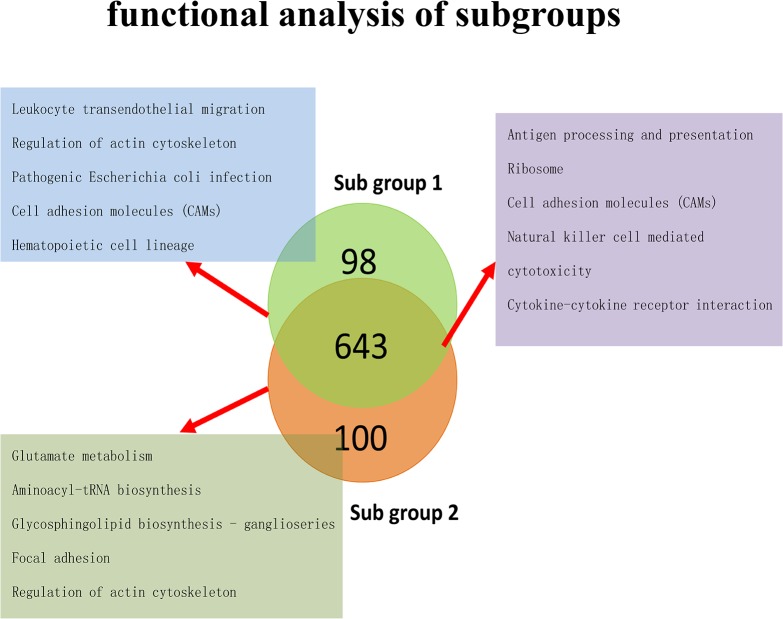
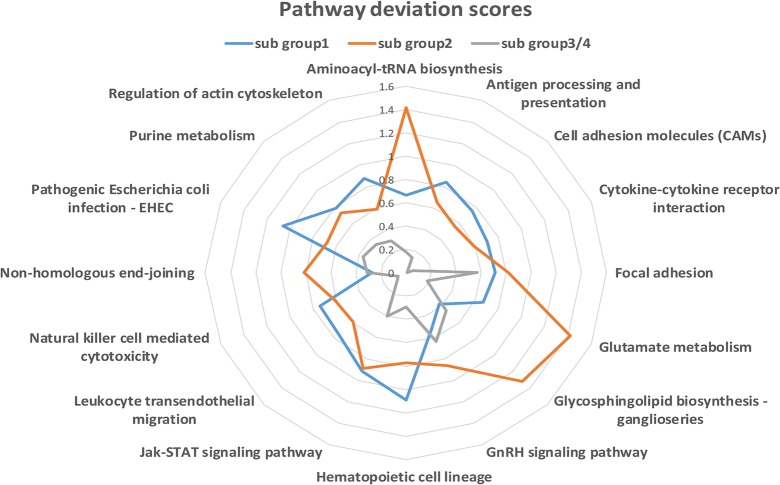
Breast cancer is a highly heterogeneous disease that is clinically classified into several subtypes. Among these subtypes, basal-like breast cancer largely overlaps with triple-negative breast cancer (TNBC), and these two groups are generally studied together as a single entity. Differences in the molecular makeup of breast cancers can result in different treatment strategies and prognoses for patients with different breast cancer subtypes. Compared with other subtypes, basal-like and other ER+ breast cancer subtypes exhibit marked differences in etiologic factors, clinical characteristics and therapeutic potential. Anthracycline drugs are typically used as the first-line clinical treatment for basal-like breast cancer subtypes. However, certain patients develop drug resistance following chemotherapy, which can lead to disease relapse and death. Even among patients with basal-like breast cancer, there can be significant molecular differences, and it is difficult to identify specific drug resistance proteins in any given patient using conventional variance testing methods. Therefore, we designed a new method for identifying drug resistance genes. Subgroups, personalized biomarkers, and therapy targets were identified using cluster analysis of differentially expressed genes. We found that basal-like breast cancer could be further divided into at least four distinct subgroups, including two groups at risk for drug resistance and two groups characterized by sensitivity to pharmacotherapy. Based on functional differences among these subgroups, we identified nine biomarkers related to drug resistance: SYK, LCK, GAB2, PAWR, PPARG, MDFI, ZAP70, CIITA and ACTA1. Finally, based on the deviation scores of the examined pathways, 16 pathways were shown to exhibit varying degrees of abnormality in the various subgroups, indicating that patients with different subtypes of basal-like breast cancer can be characterized by differences in the functional status of these pathways. Therefore, these nine differentially expressed genes and their associated functional pathways should provide the basis for novel personalized clinical treatments of basal-like breast cancer.
Conflict of interest statement
Figures
Similar articles
-
p53 status identifies triple-negative breast cancer patients who do not respond to adjuvant chemotherapy.Breast. 2015 Jun;24(3):294-7. doi: 10.1016/j.breast.2015.01.007. Epub 2015 Feb 16. Breast. 2015. PMID: 25698149 Clinical Trial.
-
Exploring novel targets of basal-like breast carcinoma by comparative gene profiling and mechanism analysis.Breast Cancer Res Treat. 2013 Aug;141(1):23-32. doi: 10.1007/s10549-013-2664-1. Epub 2013 Aug 10. Breast Cancer Res Treat. 2013. PMID: 23933801
-
Identification of selective cytotoxic and synthetic lethal drug responses in triple negative breast cancer cells.Mol Cancer. 2016 May 10;15(1):34. doi: 10.1186/s12943-016-0517-3. Mol Cancer. 2016. PMID: 27165605 Free PMC article.
-
Molecular Phenotype, Multigene Assays, and the Locoregional Management of Breast Cancer.Semin Radiat Oncol. 2016 Jan;26(1):9-16. doi: 10.1016/j.semradonc.2015.08.002. Semin Radiat Oncol. 2016. PMID: 26617205 Review.
-
Extended adjuvant chemotherapy in endocrine non-responsive disease.Breast. 2013 Aug;22 Suppl 2:S161-4. doi: 10.1016/j.breast.2013.07.031. Breast. 2013. PMID: 24074780 Review.
Cited by
-
Immunoglobulin superfamily genes are novel prognostic biomarkers for breast cancer.Oncotarget. 2017 Jan 10;8(2):2444-2456. doi: 10.18632/oncotarget.13683. Oncotarget. 2017. PMID: 27911271 Free PMC article.
-
Integrative and Comprehensive Pan-Cancer Analysis of Lymphocyte-Specific Protein Tyrosine Kinase in Human Tumors.Int J Mol Sci. 2022 Nov 13;23(22):13998. doi: 10.3390/ijms232213998. Int J Mol Sci. 2022. PMID: 36430477 Free PMC article.
-
Transcriptomic Analysis of Subtype-Specific Tyrosine Kinases as Triple Negative Breast Cancer Biomarkers.Cancers (Basel). 2023 Jan 7;15(2):403. doi: 10.3390/cancers15020403. Cancers (Basel). 2023. PMID: 36672350 Free PMC article.
-
An aberrant DNA methylation signature for predicting the prognosis of head and neck squamous cell carcinoma.Cancer Med. 2021 Sep;10(17):5936-5947. doi: 10.1002/cam4.4142. Epub 2021 Jul 27. Cancer Med. 2021. PMID: 34313009 Free PMC article.
-
DDRS: Detection of drug response SNPs specifically in patients receiving drug treatment.Comput Struct Biotechnol J. 2021 Jun 18;19:3650-3657. doi: 10.1016/j.csbj.2021.06.026. eCollection 2021. Comput Struct Biotechnol J. 2021. PMID: 34257842 Free PMC article.
References
-
- Schwentner L, Wolters R, Koretz K, Wischnewsky MB, Kreienberg R, Rottscholl R, et al. Triple-negative breast cancer: the impact of guideline-adherent adjuvant treatment on survival—a retrospective multi-centre cohort study. Breast Cancer Res Treat 2012;132: 1073–1080. 10.1007/s10549-011-1935-y - DOI - PubMed
Publication types
MeSH terms
Substances
LinkOut - more resources
Full Text Sources
Other Literature Sources
Medical
Research Materials
Miscellaneous
