. 2015 Sep 15;309(6):E511-22.
doi: 10.1152/ajpendo.00594.2014. Epub 2015 Jun 30.

Characterization of lipid metabolism in a novel immortalized human hepatocyte cell line

Affiliations

Characterization of lipid metabolism in a novel immortalized human hepatocyte cell line

Charlotte J Green et al. Am J Physiol Endocrinol Metab. .

Abstract

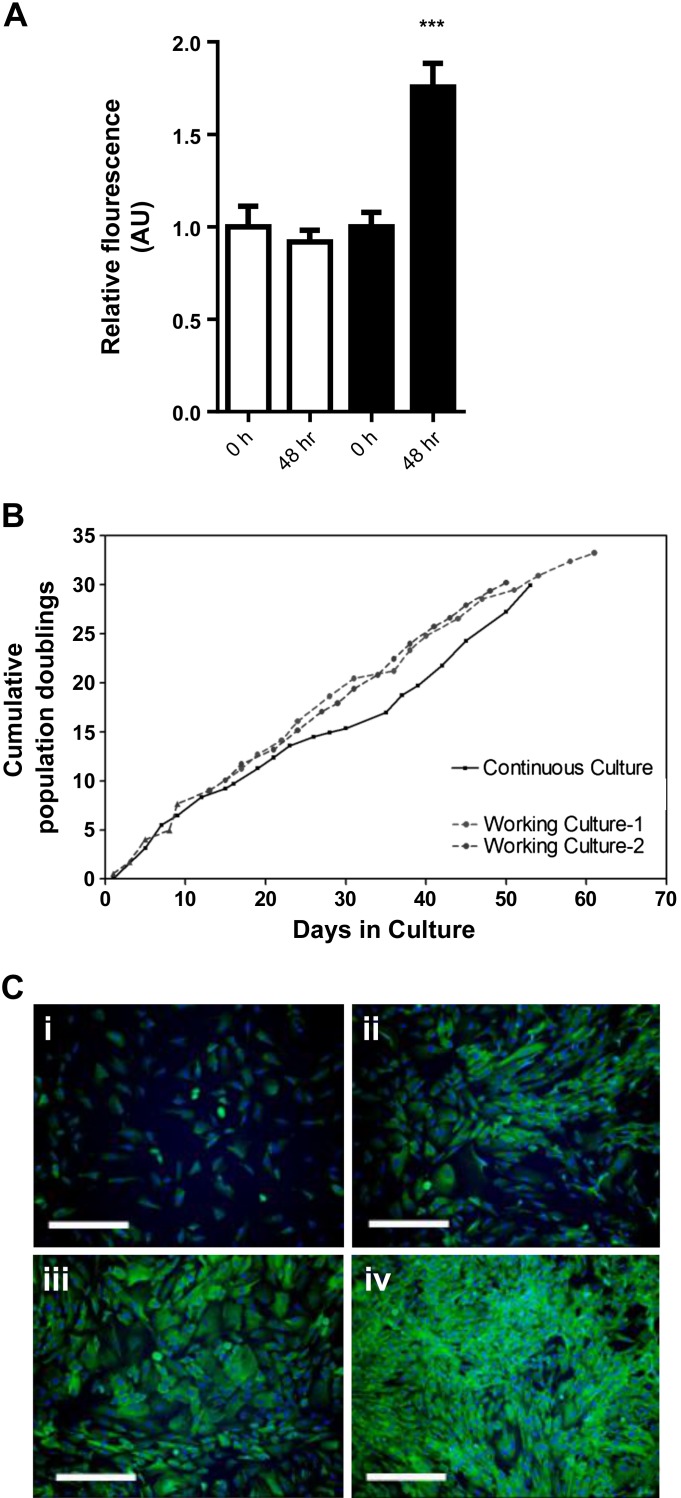
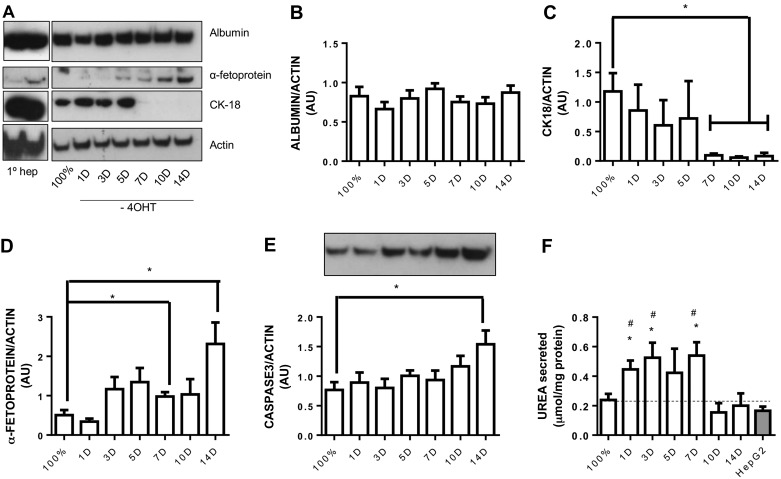
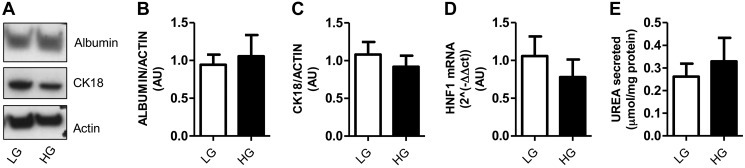
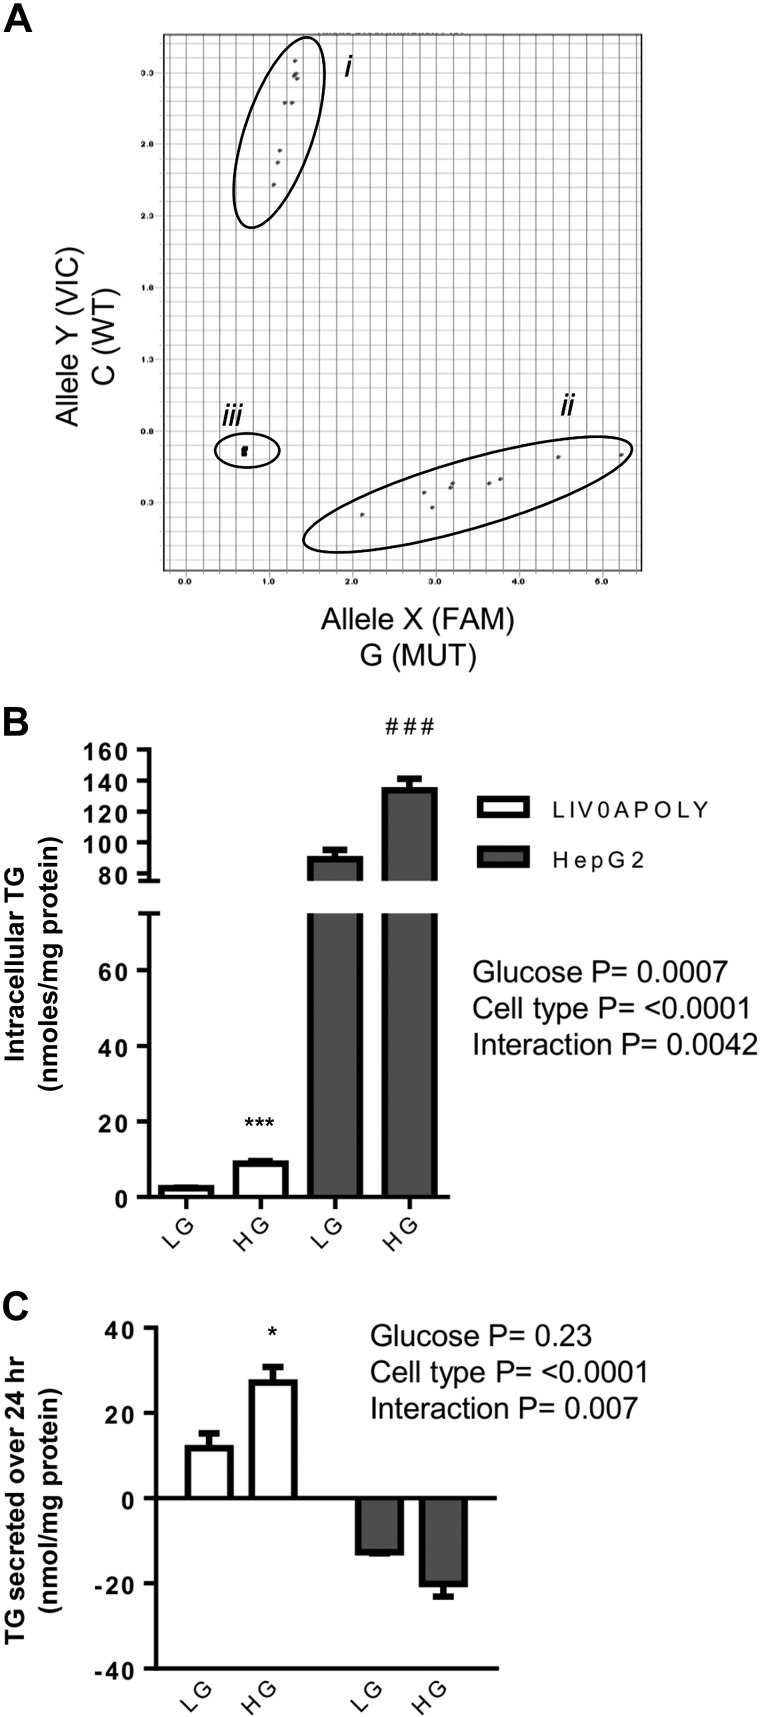
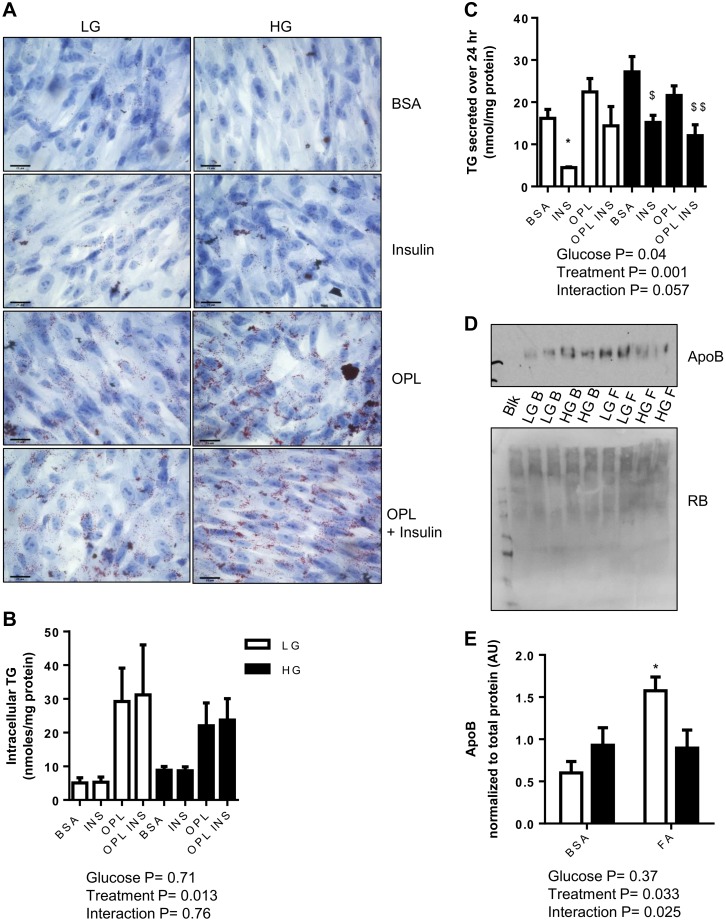
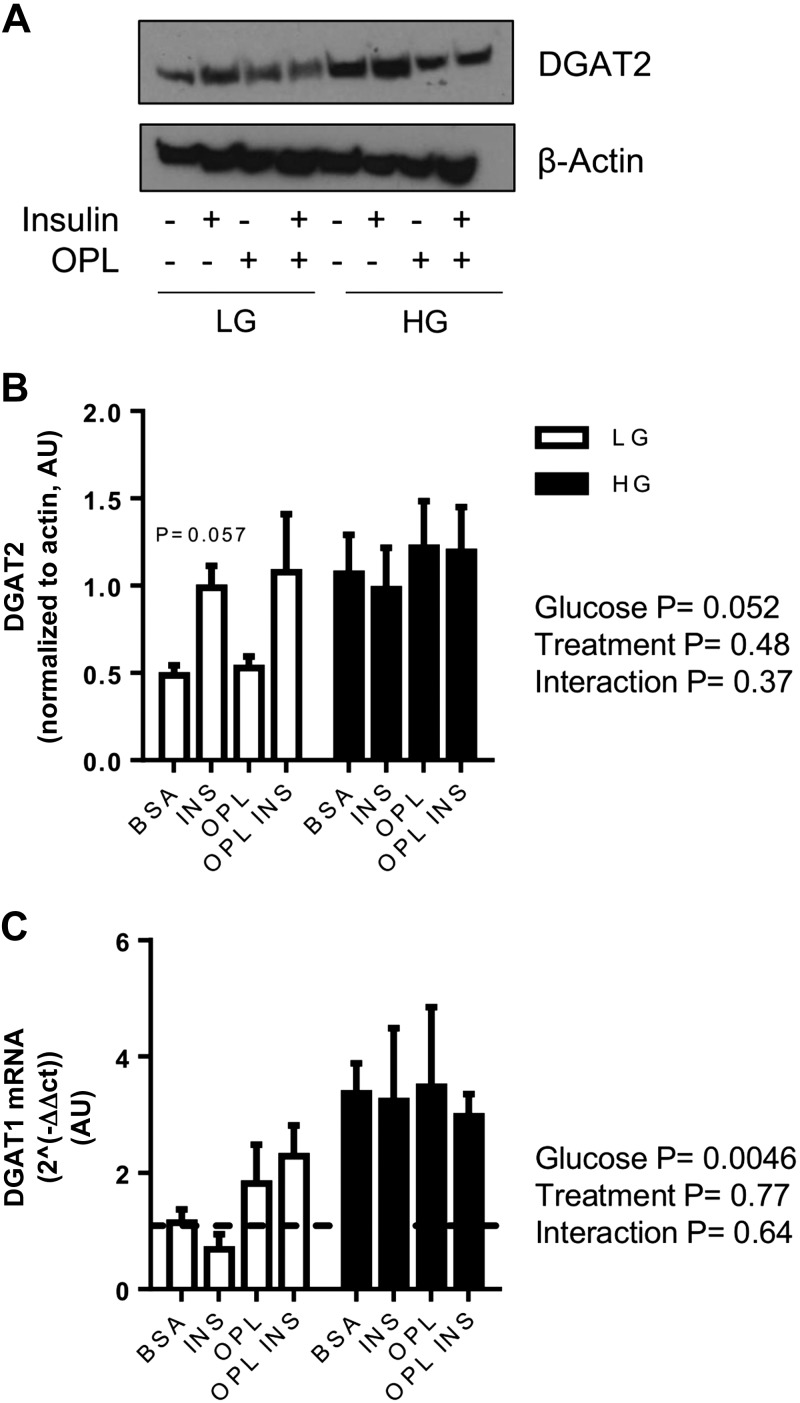
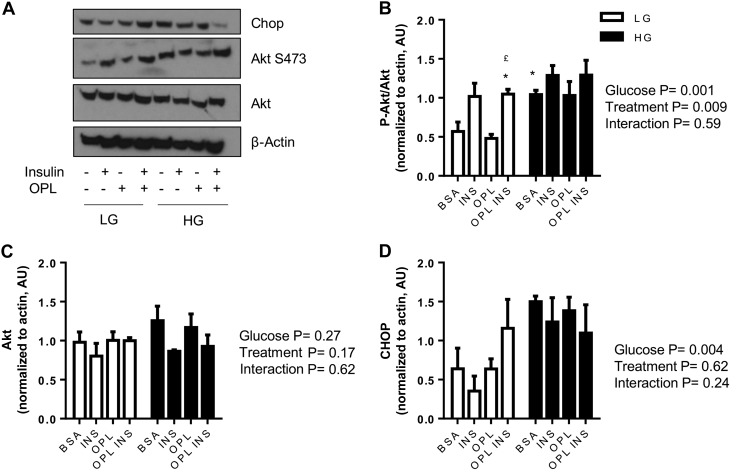
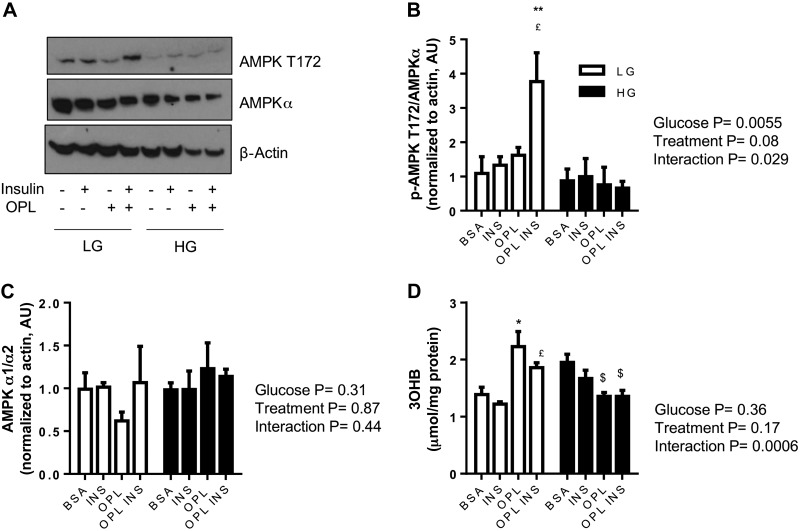
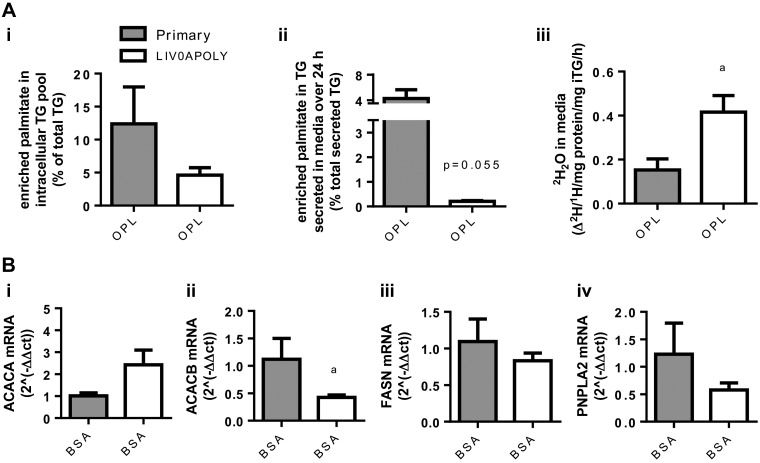
The development of hepatocyte cell models that represent fatty acid partitioning within the human liver would be beneficial for the study of the development and progression of nonalcoholic fatty liver disease (NAFLD). We sought to develop and characterize a novel human liver cell line (LIV0APOLY) to establish a model of lipid accumulation using a physiological mixture of fatty acids under low- and high-glucose conditions. LIV0APOLY cells were compared with a well-established cell line (HepG2) and, where possible, primary human hepatocytes. LIV0APOLY cells were found to proliferate and express some mature liver markers and were wild type for the PNPLA3 (rs738409) gene, whereas HepG2 cells carried the Ile(148)Met variant that is positively associated with liver fat content. Intracellular triglyceride content was higher in HepG2 than in LIV0APOLY cells; exposure to high glucose and/or exogenous fatty acids increased intracellular triglyceride in both cell lines. Triglyceride concentrations in media were higher from LIV0APOLY compared with HepG2 cells. Culturing LIV0APOLY cells in high glucose increased a marker of endoplasmic reticulum stress and attenuated insulin-stimulated Akt phosphorylation whereas low glucose and exogenous fatty acids increased AMPK phosphorylation. Although LIV0APOLY cells and primary hepatocytes stored similar amounts of exogenous fatty acids as triglyceride, more exogenous fatty acids were partitioned toward oxidation in the LIV0APOLY cells than in primary hepatocytes. LIV0APOLY cells offer the potential to be a renewable cellular model for studying the effects of exogenous metabolic substrates on fatty acid partitioning; however, their usefulness as a model of lipoprotein metabolism needs to be further explored.

Keywords: NAFLD; PNPLA3; hepatocyte; human; triglyceride.


Figures

Fig. 1.
Fig. 1.
Growth characterization of the novel human liver cell line LIV0APOLY. A: CYQUANT analysis of cell growth (n = 4). B: cumulative population doublings of LIV0APOLY cells that had been cryopreserved, thawed, and passaged 3 times [working cultures 1 and 2 (dotted line, ●)] compared with LIV0APOLY cells that were continuously cultured and not cryopreserved (solid line, ■). C: imunoflourescent staining for albumin (×10 objective; scale bar, 50 μm) in LIV0APOLY cells seeded at different densities: i) 2,000, ii) 5,000, iii) 10,000, iv) 15,000. Data are means ± SE. ***P < 0.001, Time 0 h vs. 48 h.
Fig. 2.
Fig. 2.
Differentiation time course in LIV0APOLY cells. A: immunoblots of albumin, α-fetoprotein, and cytokeratin (CK)18, equal gel loading ascertained by immunoblotting against β-actin. Primary hepatocytes (promocell, 10 μg) were immunoblotted as control for antibodies. Expressions of albumin (B), CK18 (C), α-fetoprotein (D), and caspase-3 (E) were quantified relative to β-actin (n = 4) and expressed as arbitrary units (AU). F: Urea secreted from LIV0APOLY and HepG2 cells over 24 h into cell culture medium (n = 4). G: Data are means ± SE. *P < 0.05 significantly different from confluent cells (100%); #P < 0.05 significantly different from HepG2 cells.
Fig. 3.
Fig. 3.
Effect of glucose concentration on expression of liver markers in LIV0APOLY cells. Cells were cultured under low-glucose (LG; 5.5 mM) or high-glucose (HG; 22.5 mM) conditions. A: immunoblots of albumin and CK18, equal gel loading ascertained by immunoblotting with an antibody against β-actin. Expression of albumin (B) and CK18 (C) were quantified relative to β-actin (n = 3) and expressed as AU. D: expression of HNF1α (hepatic nuclear factor 1α) was measured (n = 3). Housekeeping gene used was HPRT1 (hypoxanthine-guanine phosphoribosyltransferase). E: amount of urea in cell culture medium over 24 h (n = 3). Data are means ± SE.
Fig. 4.
Fig. 4.
PNPLA3 genotype and triglyceride (TG) profile of LIV0APOLY and HepG2 cells under HG and LG conditions. A: PNPLA3 rs738409 genotype i = LIV0APOLY, ii = HepG2, and iii = no template control. x-Axis represents wild-type allele; y-axis mutant allele. TG contents of cells (B) and media (C) (24 h) were measured (n = 3) in cells cultured in LG (5.5 mM) or HG (22.5 mM) media. Data are means ± SE. *P < 0.05, ***P < 0.001 LG vs. HG in LIV0APOLY cells; ###P < 0.001 LG vs. HG in HepG2 cells.
Fig. 5.
Fig. 5.
Neutral lipid accumulation and secretion in LIV0APOLY cells under HG and LG conditions. Cells were cultured under LG (5.5 mM) or HG (22.5 mM) and treated with insulin (INS; 100 nM) in the absence or presence of OPL (50 μM oleic, 33 μM palmitic, and 27 μM linoleic acid) for 24 h. A: representative images (×40 objective) of neutral lipid, scale bar 25 μm. Total TG of cells (B) and in media (C) (24 h). D: immunoblot of apoB in media and reactive brown (RB, total protein; Blk, blank; B, BSA; F, OPL). E: expression of apoB was quantified relative to protein concentration. Data are means ± SE (n = 3). *P < 0.05 significantly different from LG-BSA; $P < 0.05, $$P < 0.01 significantly different from HG-BSA.
Fig. 6.
Fig. 6.
Effect of glucose and exogenous fatty acids on diacylglycerol acyltransferases (DGATs). Cells were cultured under LG (5.5 mM) or HG (22.5 mM) and treated with insulin (100 nM) in the absence or presence of OPL for 24 h. A: immunoblot of DGAT2. Equal gel loading was ascertained by immunoblotting against β-actin. B: expression of DGAT2 quantified relative to β-actin (n = 3) and expressed as AU. C: mRNA expression of DGAT1 (n = 3). Housekeeping gene was HPRT1. Data are means ± SE.
Fig. 7.
Fig. 7.
Effect of glucose and exogenous fatty acids on insulin signaling and endoplasmic reticulum (ER) stress in LIV0APOLY cells. Cells were cultured under LG (5.5 mM) or HG (22.5 mM) and treated with insulin (100 nM) in the absence or presence of OPL for 24 h. Immunoblots of CCAAT/enhancer-binding protein homologous protein (CHOP), Akt, and Ser473 Akt, equal gel loading ascertained by immunoblotting against β-actin. Expressions of Akt Ser473 (B), Akt (C), and CHOP (D) were quantified relative to β-actin (n = 3) and expressed as AU. Data are means ± SE. *P < 0.05 significantly different from BSA-LG; £P < 0.05 significantly different from OPL-LG.
Fig. 8.
Fig. 8.
Effect of glucose and exogenous fatty acids on markers of fatty acid oxidation in LIV0APOLY cells. Cells were cultured under LG (5.5 mM) or HG (22.5 mM) and treated with insulin (100 nM) in the absence or presence of OPL for 24 h. A: immunoblots of total and Thr172 AMPKα, equal gel loading ascertained by immunoblotting against β-actin. Expressions of Thr172 (B) and AMPKα (C) were quantified relative to β-actin (n = 3) and expressed as AU. D: 3-hydroxybutyrate (3-OHB) secretion from LIV0APOLY cells. Data are means ± SE (n = 3). *P < 0.05; **P < 0.01, significantly different from BSA-LG; £P < 0.05 significantly different from LG-INS; $P < 0.05 significantly different from HG-BSA.
Fig. 9.
Fig. 9.
Fatty acid partitioning and gene expression in human primary hepatocytes and LIV0APOLY cells. LIV0APOLY (5.5 mM glucose) and primary hepatocytes were grown in the absence or presence of OPL for 24 h. A: percentage of enriched palmitate in i) intracellular TG pool, ii) secreted TG, and iii) quantification of 2H2O in media. C: mRNA expressions of i) ACACA, ii) ACACB, iii) FASN, and iv) PNPLA2. Housekeeping genes used were HPRT1 and GAPDH. Data are means ± SE (n = 3). aP < 0.05 primary human hepatocytes vs. LIV0APOLY cells.

References

    1. Abelev GI. Alpha-fetoprotein in ontogenesis and its association with malignant tumors. Adv Cancer Res 14: 295–358, 1971. - PubMed
    1. Adiels M, Westerbacka J, Soro-Paavonen A, Hakkinen AM, Vehkavaara S, Caslake MJ, Packard C, Olofsson SO, Yki-Jarvinen H, Taskinen MR, Boren J. Acute suppression of VLDL1 secretion rate by insulin is associated with hepatic fat content and insulin resistance. Diabetologia 50: 2356–2365, 2007. - PubMed
    1. Ampuero J, Del Campo JA, Rojas L, Garcia-Lozano JR, Sola R, Andrade R, Pons JA, Navarro JM, Calleja JL, Buti M, Gonzalez-Escribano MF, Forns X, Diago M, Garcia-Samaniego J, Romero-Gomez M. PNPLA3 rs738409 causes steatosis according to viral & IL28B genotypes in hepatitis C. Ann Hepatol 13: 356–363, 2014. - PubMed
    1. Angulo P, Lindor KD. Non-alcoholic fatty liver disease. J Gastroenterol Hepatol 17 Suppl: S186–S190, 2002. - PubMed
    1. Anstee QM, Day CP. The genetics of NAFLD. Nat Rev Gastroenterol Hepatol 10: 645–655, 2013. - PubMed

Publication types

LinkOut - more resources