. 2015 Jun 30;6(4):e00749.
doi: 10.1128/mBio.00749-15.

The Pseudomonas aeruginosa Transcriptional Landscape Is Shaped by Environmental Heterogeneity and Genetic Variation

Affiliations

The Pseudomonas aeruginosa Transcriptional Landscape Is Shaped by Environmental Heterogeneity and Genetic Variation

Andreas Dötsch et al. mBio. .

Abstract

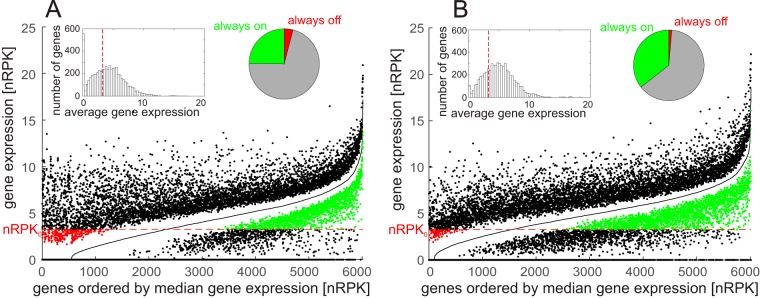
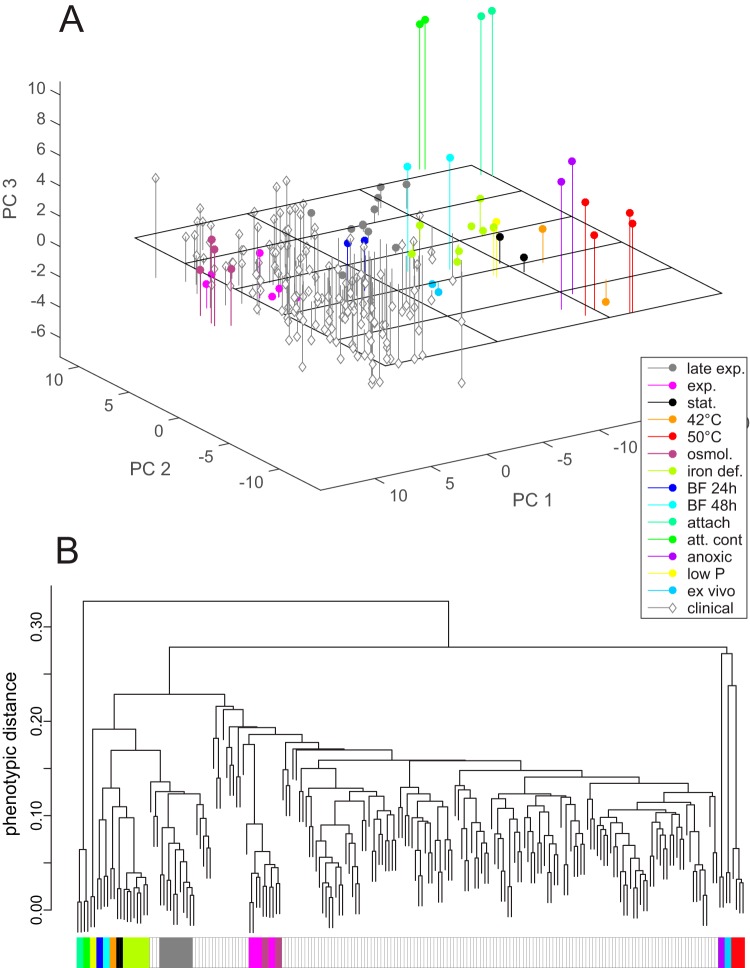
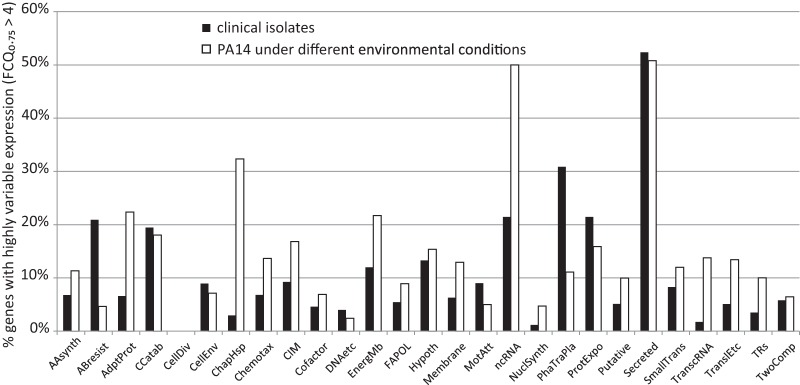
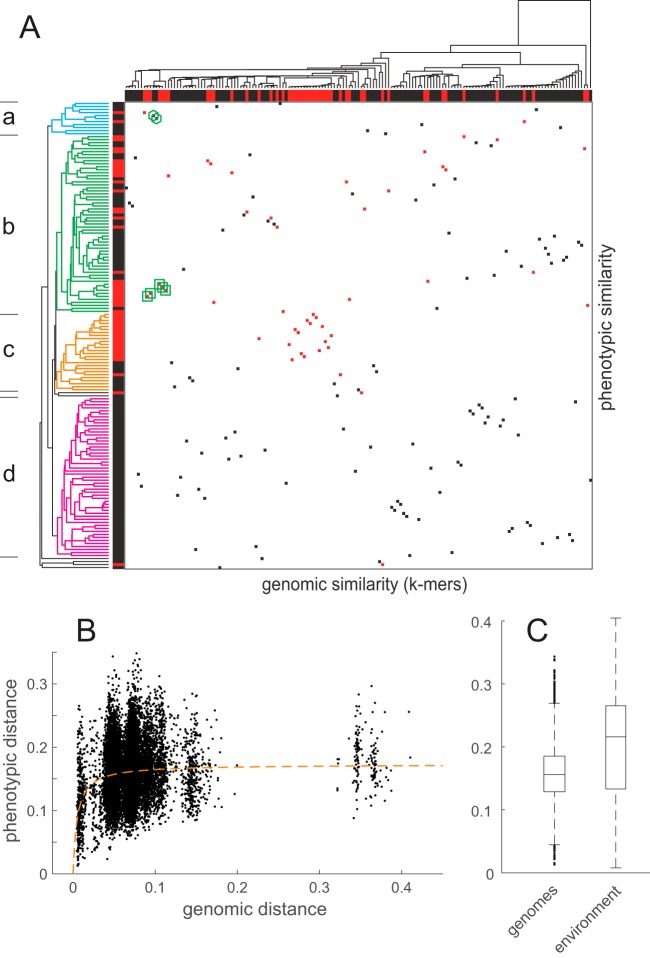
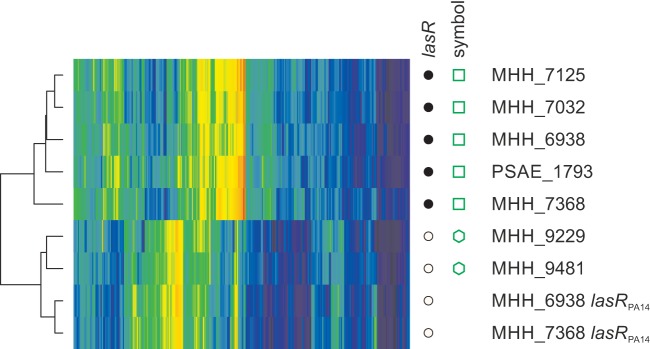
Phenotypic variability among bacteria depends on gene expression in response to different environments, and it also reflects differences in genomic structure. In this study, we analyzed transcriptome sequencing (RNA-seq) profiles of 151 Pseudomonas aeruginosa clinical isolates under standard laboratory conditions and of one P. aeruginosa type strain under 14 different environmental conditions. Our approach allowed dissection of the impact of the genetic background versus environmental cues on P. aeruginosa gene expression profiles and revealed that phenotypic variation was larger in response to changing environments than between genomically different isolates. We demonstrate that mutations within the global regulator LasR affect more than one trait (pleiotropy) and that the interaction between mutations (epistasis) shapes the P. aeruginosa phenotypic plasticity landscape. Because of pleiotropic and epistatic effects, average genotype and phenotype measures appeared to be uncorrelated in P. aeruginosa.

Importance: This work links experimental data of unprecedented complexity with evolution theory and delineates the transcriptional landscape of the opportunistic pathogen Pseudomonas aeruginosa. We found that gene expression profiles are most strongly influenced by environmental cues, while at the same time the transcriptional profiles were also shaped considerably by genetic variation within global regulators. The comprehensive set of transcriptomic and genomic data of more than 150 clinical P. aeruginosa isolates will be made publically accessible to all researchers via a dedicated web interface. Both Pseudomonas specialists interested in expression and regulation of specific genes and researchers from other fields with more global interest in the phenotypic and genotypic variation of this important model species can access all information on various levels of detail.


Figures

FIG 1
FIG 1
Distribution of transcriptional activity throughout all samples. (A and B) The genes were ordered from left to right by their median gene expression (black line) for the genome data set (A) and environment data set (B). Dots above and below the median indicate the observed maximum and minimum gene expression for a particular gene. Red dots indicate the genes that were always below the sensitivity limit (red dotted line; nRPK0 = 3.26), and green dots indicate the genes that were always above the sensitivity limit. Inserts show the histogram of gene expression (nRPK values) for all genes annotated in reference strain PA14 and a pie chart indicating the fractions of genes that are always above (always on) and always below (always off) the nRPK0 limit.
FIG 2
FIG 2
Global comparison of transcriptional activity. (A) Principal component analysis of the combined data set, including the 151 clinical isolates (genome data set) and the 51 samples of strain PA14 under 14 different environmental conditions (environment data set). The analysis was based on the expression of the 1,121 genes that showed highly variable expression in at least one of the two data sets. The first three principal components (PC1 to PC3) displayed account for ~47% of the total variance of the data. The environmental conditions used for cultivation were as follows: late exponential phase (late exp.), exponential growth phase (exp.), stationary growth phase (stat.), heat shock at 42°C or 50°C, low osmolarity (osmol.), iron deficiency (iron def.), 24-h-old static biofilm (BF 24h), 48-h-old biofilm (BF 48h), attached cells (attach), nonattached population in attachment experiment (att. cont), anoxic cultivation, minimal phosphate concentration (low P), and mouse tumor infection model (ex vivo). (B) Hierarchical clustering of the combined data set, including both the genome and environment data sets. Branches representing samples of the environment data set are drawn in red with thick black lines. The colored boxes in panel B correspond to the colors used in panel A and reflect the different culture conditions. Clinical isolates are indicated by white boxes with gray outlines.
FIG 3
FIG 3
Assignment of genes that varied among the transcriptomes to different functional categories. Bars indicate the percentage of genes that exhibited highly variable gene expression (FC75 of >4) within each functional category. Values for the genome data set of 151 clinical isolates and values for the environment data set of reference strain PA14 samples grown under 14 different culture conditions are shown. Functional categories were assigned according to the annotation for strain PA14 available from the Pseudomonas genome database (43, 44). The PseudoCAP functional classes are abbreviated as follows: AAsynth, amino acid biosynthesis and metabolism; ABresist, antibiotic resistance and susceptibility; AdptProt, adaptation and protection; CCatab, carbon compound catabolism; CellDiv, cell division; CellEnv, Cell wall/lipopolysaccharide (LPS)/capsule; ChapHsp, chaperones and heat shock proteins; Chemotax, chemotaxis; CIM, central intermediary metabolism; Cofactor, biosynthesis of cofactors, prosthetic groups, and carriers; DNAetc, DNA replication, recombination, modification, and repair; EnergMb, energy metabolism; FAPOL, fatty acid and phospholipid metabolism; Hypoth, hypothetical, unclassified, and unknown; membrane, membrane proteins; MotAtt, motility and attachment; ncRNA, noncoding RNA (rRNA and tRNA were excluded in this study); NuclSynth, nucleotide biosynthesis and metabolism; PhaTraPla, related to phage, transposon, or plasmid; ProtExpo, protein secretion/export apparatus; Putative, putative enzymes; Secreted, secreted factors (toxins, enzymes, alginate); SmallTrans, transport of small molecules; TranscRNA, transcription, RNA processing and degradation; TranslEtc, translation, posttranslational modification, degradation; TRs, transcriptional regulators; TwoComp, two-component regulatory systems.
FIG 4
FIG 4
Comparison of the genomic and phenotypic tree. (A) Correlation matrix comparing gene expression profiles (the phenotype) and the genotypic relatedness of the clinical isolates. Each square reflects the position of an individual isolate on the two axes. The horizontal dimension represents the genomic relatedness calculated by a hierarchical clustering of the similarity of k-mer profiles of each isolate’s RNA-seq data. The vertical dimension represents the hierarchical clustering of gene expression data based on normalized expression of the 592 genes that were classified as highly variable (FC75 of >4) in the data set of clinical isolates. Clusters of similar expression profiles (a to d) are indicated by colored subtrees within the dendrogram. Clinical isolates that harbor a loss-of-function mutation in lasR are marked with red squares in the matrix and by red bars alongside the two axes. The seven isolates that were included in an in-depth analysis of the genotype as shown in Fig. 5B are marked by green symbols. (B) The phenotypic distance is calculated as the Pearson correlation distance between the normalized expression profiles of the 592 genes that were classified as highly variable (FC75 of >4) in the genome data set. Genomic distance is the difference in the k-mer profiles of each isolate’s RNA-seq data. Each dot represents a pairwise comparison between two transcriptomic profiles. The orange dashed line represents the fit of a saturation function (analogous to Michaelis-Menten and Monod-type kinetics) to represent the approximate average phenotypic distance in response to genotypic distance. (C) Boxplots showing the phenotypic distances of all pairwise comparisons in the genome and environment data sets. The difference between the two distributions is highly significant (P < 10−200 by Mann-Whitney U test).
FIG 5
FIG 5
Pleiotropic effects of a mutation in the lasR gene. Heatmap of the gene expression profiles of the clonal subgroup of isolates selected for further analysis. Only the 592 genes classified as highly variable (FC75 of >4) in the data set of clinical isolates were used to create the heatmap. The lasR genotype of each of the isolates and the two complemented strains (labeled “lasRPA14”) is indicated by white (wild type) or black (17-bp deletion) circles in the lasR column. Green symbols in the symbol column indicate different subclusters within this group of isolates as defined by their location in the genomic/phenotypic correlation matrix (Fig. 4A).

References

    1. Lewontin RC. 1957. The adaptations of populations to varying environments. Cold Spring Harb Symp Quant Biol 22:395–408. doi:10.1101/SQB.1957.022.01.037. - DOI - PubMed
    1. Elena SF, Lenski RE. 2003. Evolution experiments with microorganisms: the dynamics and genetic bases of adaptation. Nat Rev Genet 4:457–469. doi:10.1038/nrg1088. - DOI - PubMed
    1. Philippe N, Crozat E, Lenski RE, Schneider D. 2007. Evolution of global regulatory networks during a long-term experiment with Escherichia coli. Bioessays 29:846–860. doi:10.1002/bies.20629. - DOI - PubMed
    1. Dekel E, Mangan S, Alon U. 2005. Environmental selection of the feed-forward loop circuit in gene-regulation networks. Phys Biol 2:81–88. doi:10.1088/1478-3975/2/2/001. - DOI - PubMed
    1. Fusco G, Minelli A. 2010. Phenotypic plasticity in development and evolution: facts and concepts. Philos Trans R Soc Lond B Biol Sci 365:547–556. doi:10.1098/rstb.2009.0267. - DOI - PMC - PubMed

Publication types