. 2015 Jul 1:5:11703.
doi: 10.1038/srep11703.

Beta-cell regeneration from vimentin+/MafB+ cells after STZ-induced extreme beta-cell ablation

Affiliations

Beta-cell regeneration from vimentin+/MafB+ cells after STZ-induced extreme beta-cell ablation

Yu Cheng et al. Sci Rep. .

Abstract

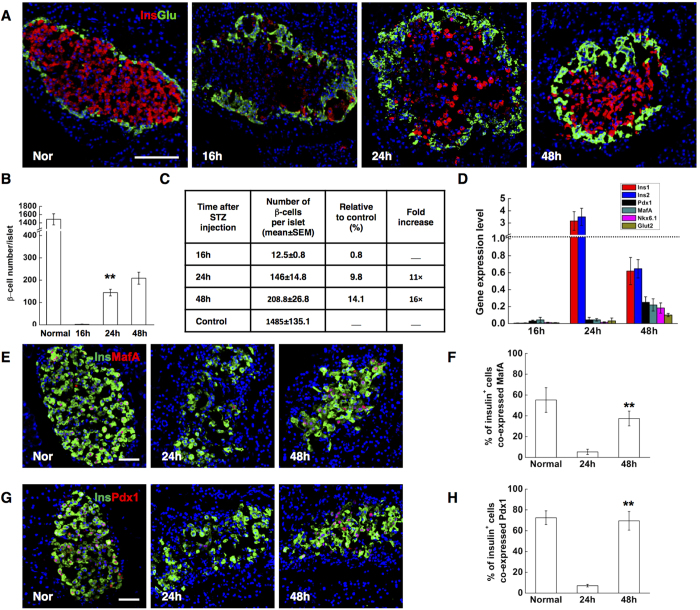
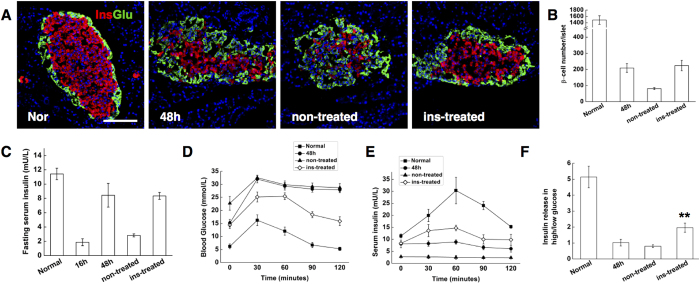
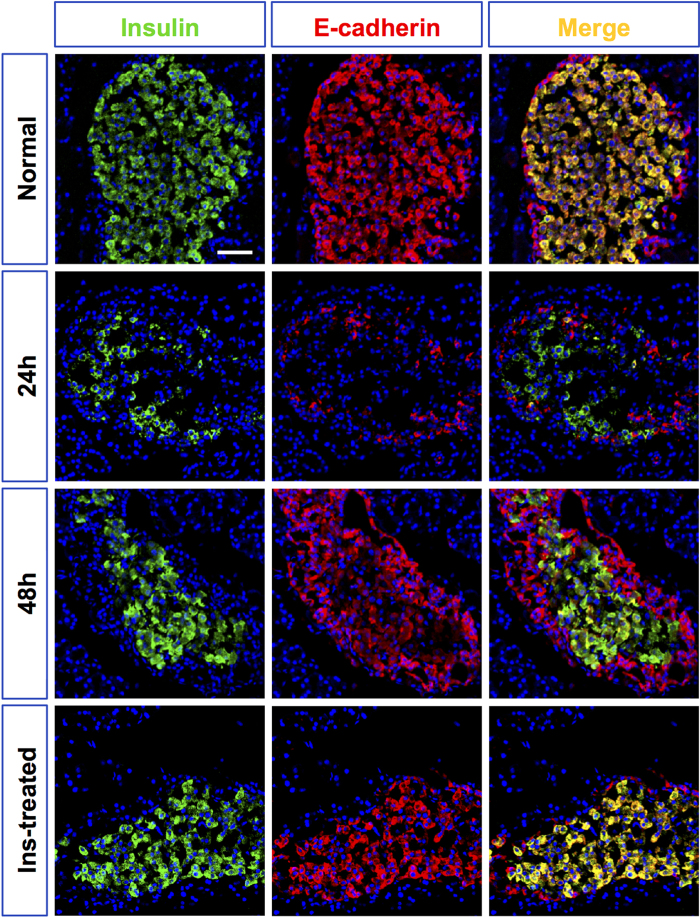
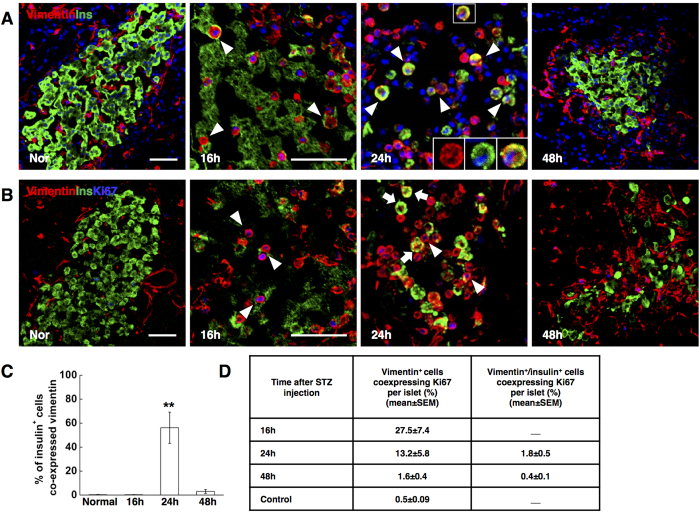
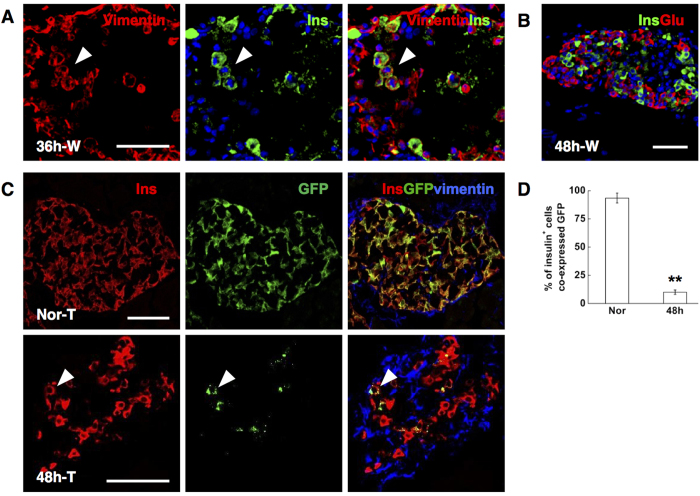
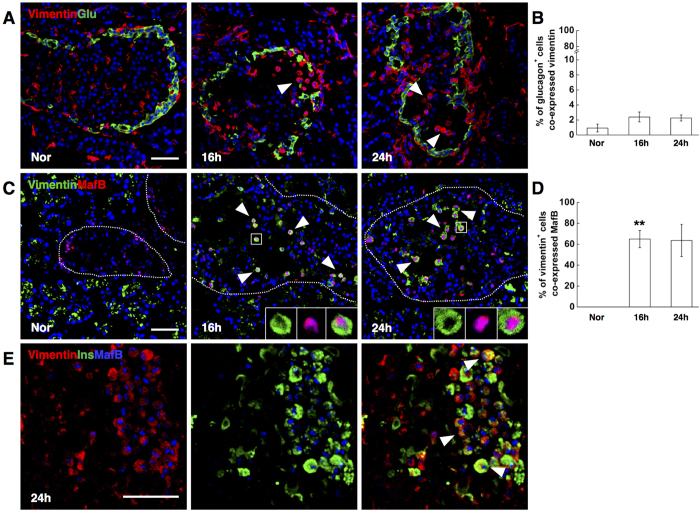
Loss of functional beta-cells is fundamental in both type 1 and type 2 diabetes. In situ beta-cell regeneration therefore has garnered great interest as an approach to diabetes therapy. Here, after elimination of pre-existing beta cells by a single high-dose of streptozotocin (STZ), we demonstrated that a considerable amount of beta-like-cells was generated within 48 hrs. But the newly formed insulin producing cells failed to respond to glucose challenge at this time and diminished afterwards. Insulin treatment to normalize the glucose level protected the neogenic beta-like cells and the islet function was also gradually matured. Strikingly, intermediate cells lacking epithelial marker E-cadherin but expressing mesenchymal cell-specific marker vimentin appeared within 16 hrs following STZ exposure, which served as the major source of insulin-producing cells observed at 24 hrs. Moreover, these intermediate cells strongly expressed alpha-cell-specific marker MafB. In summary, the data presented here identified a novel intermediate cell type as beta-cell progenitors, showing mesenchymal cell feature as well as alpha-cell marker MafB. Our results might have important implications for efforts to stimulate beta-cell regeneration.


Figures

Figure 1
Figure 1. STZ treatment induced rapid beta-cell neogenesis in adult rat pancreas
(A) Representative islets stained with antibodies against insulin (red) and glucagon (green) of normal control SD rats (Nor), and STZ-treated rats at indicated time points (16 h, 24 h, 48 h,). Nuclei were labeled with DAPI. Scale bars, 100 μm. (B,C) Quantification of beta-cell number. (D) Expression of beta-cell enriched genes in isolated islets of normal control and STZ-treated rats at indicated time points (16 h, 24 h, and 48 h). (E) Photomicrographs double stained with anti-insulin (green) and anti-MafA (red) antibodies from normal control rats (Nor), and STZ-treated rats (24 h, 48 h). Nuclei were labeled with DAPI. Scale bars, 50 μm. (F) Quantification of insulin positive cells co-expressing MafA. (G) Photomicrographs double stained with anti-insulin (green) and anti-Pdx1 (red) antibodies. Nuclei were labeled with DAPI. Scale bars, 50 μm. (H) Quantification of insulin positive cells co-expressing Pdx1. Data are shown as means ± SEM, n = 5–6 rats per group; *P < 0.05 and **P < 0.01.
Figure 2
Figure 2. Neogenic beta-cells survived and acquired functionality after insulin treatment.
(A) Representative islets stained with antibodies against insulin (red) and glucagon (green) of normal control SD rats (Nor), STZ-treated rats after 48 hrs (48 h), ins-treated rats after 7 days’ insulin treatment with a one-day washout (insulin-treated), and concurrent non-treated control rats (non-treated). Nuclei were labeled with DAPI. Scale bars, 100 μm. (B) Quantification of beta-cell number. (C) Fasting serum insulin levels in normal control SD rats (Nor), STZ-treated rats after 16 and 48 hrs (16 h, 48 h), insulin-treated rats by day 7 (insulin-treated) and concurrent non-treated control rats (non-treated). (D and E) Plasma glucose and insulin during an IP-GTT. (F) GSIS in vitro, measured as the ratio of insulin release in high glucose to insulin release in low glucose. Data are shown as means ± SEM, n = 6 rats per group; **P < 0.01.
Figure 3
Figure 3. Temporal changes of E-cadherin expression in insulin+ cells following STZ treatment.
The photomicrographs in the left column showed representative islets stained with anti-insulin (green), and the middle column with anti-E-cadherin (red) antibodies from normal control SD rats (Nor), STZ-treated rats at different time points (24 h, 48 h), and insulin-treated rats by day 7 (insulin-treated). The right column showed the merged images of the left and middle column. Nuclei were labeled with DAPI. Scale bars, 50 μm.
Figure 4
Figure 4. Neogenic beta-cells manifested vimentin expression.
(A) Photomicrographs double stained with anti-insulin (green) and anti-vimentin (red) antibodies from normal control rats (Nor), and STZ-treated rats at different time points (16 h, 24 h, 48 h). Nuclei were labeled with DAPI. Scale bars, 50 μm. The isosceles triangle: insulin+ cells co-expressing vimentin. The boxed regions showed the high power photomicrograph at the bottom right of the image. (B) Photomicrographs triple stained with anti-vimentin (red), anti-insulin (green) and anti-Ki67 (blue) antibodies. The isosceles triangle: vimentin+ cells co-expressing Ki67. The arrows: vimentin+/insulin+ cells showing negative Ki67 expression. Scale bars, 50 μm. (C) Quantification of insulin positive cells co-expressing vimentin. (D) Quantification of vimentin+ and vimentin+/insulin+ cells co-expressing Ki67. Data are shown as means ± SEM, n = 5–6 per group; *P < 0.05 and **P < 0.01.
Figure 5
Figure 5. Conditional beta-cell lineage tracing.
(A) Representative islets stained with antibodies against insulin (green) and vimentin (red) of wild-type mice at 36 hrs post STZ injection (36h-W). Nuclei were labeled with DAPI. Scale bars, 50 μm. The isosceles triangle: round-shaped vimentin+ cells gaining insulin expression at 36 hrs. (B) Photomicrographs double stained with anti-insulin (green) and anti-glucagon (red) antibodies of wild-type mice at 48 hrs after STZ injection (48h-W). Nuclei were labeled with DAPI. Scale bars, 50 μm. (C) Representative islets stained with antibodies against insulin (red) and vimentin (blue) of transgenic mice at 48 hrs post STZ injection (48h-T). The isosceles triangle: insulin+ cells showing GFP expression. Scale bars, 50μm. (D) Proportion of GFP+ beta-cells, as a percentage of insulin+ cells. Data are shown as means ± SEM, n = 3 per group; **P < 0.01.
Figure 6
Figure 6. Round-shaped vimentin+ cells showed strong MafB expression.
(A) Photomicrographs double stained with anti-vimentin (red) and anti-glucagon (green) antibodies. Nuclei were labeled with DAPI. Scale bars, 50 μm. The isosceles triangle: round-shaped vimentin+ cells showing negative glucagon expression. (B) Quantification of glucagon-positive cells co-expressing vimentin. (C) Photomicrographs double stained with anti-vimentin (green) and anti-MafB (red) antibodies. Nuclei were labeled with DAPI. Scale bars, 50 μm. The isosceles triangle: round-shaped vimentin+ cells coexpressing MafB. The boxed regions showed the high powered photomicrograph at the bottom right of each image. (D) Quantification of vimentin-positive cells co-expressing MafB. (E) Photomicrographs triple stained with anti-vimentin (red), anti-insulin (green) and anti-MafB (blue) antibodies. Scale bars, 50 μm. The isosceles triangle: cells co-expressing vimentin, insulin and MafB. Data are shown as means ± SEM, n = 5–6 per group. *P < 0.05 and **P < 0.01.

References

    1. Matveyenko A. V. & Butler P. C. Relationship between beta-cell mass and diabetes onset. Diabetes Obes Metab 10, Suppl 4 23–31 (2008). - PMC - PubMed
    1. Butler A. E. et al. Beta-cell deficit and increased beta-cell apoptosis in humans with type 2 diabetes. Diabetes 52, 102–110 (2003). - PubMed
    1. Renaud Desgraz C. B. a. P. L. H. β-Cell regeneration the pancreatic intrinsic faculty. Trends Endocrinol Metab 22, 34–43 (2010). - PubMed
    1. Zhou Q. & Melton D. A. Extreme makeover: converting one cell into another. Cell Stem Cell 3, 382–388 (2008). - PubMed
    1. Shen J., Cheng Y., Han Q., Mu Y. & Han W. Generating insulin-producing cells for diabetic therapy: existing strategies and new development. Ageing Res Rev 12, 469–478,(2013). - PubMed

Publication types

MeSH terms

LinkOut - more resources