. 2015 Jul 1:6:7286.
doi: 10.1038/ncomms8286.

A Rac/Cdc42 exchange factor complex promotes formation of lateral filopodia and blood vessel lumen morphogenesis

Affiliations

A Rac/Cdc42 exchange factor complex promotes formation of lateral filopodia and blood vessel lumen morphogenesis

Sabu Abraham et al. Nat Commun. .

Abstract

During angiogenesis, Rho-GTPases influence endothelial cell migration and cell-cell adhesion; however it is not known whether they control formation of vessel lumens, which are essential for blood flow. Here, using an organotypic system that recapitulates distinct stages of VEGF-dependent angiogenesis, we show that lumen formation requires early cytoskeletal remodelling and lateral cell-cell contacts, mediated through the RAC1 guanine nucleotide exchange factor (GEF) DOCK4 (dedicator of cytokinesis 4). DOCK4 signalling is necessary for lateral filopodial protrusions and tubule remodelling prior to lumen formation, whereas proximal, tip filopodia persist in the absence of DOCK4. VEGF-dependent Rac activation via DOCK4 is necessary for CDC42 activation to signal filopodia formation and depends on the activation of RHOG through the RHOG GEF, SGEF. VEGF promotes interaction of DOCK4 with the CDC42 GEF DOCK9. These studies identify a novel Rho-family GTPase activation cascade for the formation of endothelial cell filopodial protrusions necessary for tubule remodelling, thereby influencing subsequent stages of lumen morphogenesis.


Figures

Figure 1
Figure 1. Rac GEF DOCK4 controls lateral remodelling and lumen formation
(a) Cluster formation (arrowheads) following DOCK4 depletion (EV, empty vector; ot, on-target plus siRNA; sh, shRNA1; sp, smartpool siRNA) in HUVEC 3 days after seeding onto CFs. Scale bar, 100 μm. Scatter plot: cluster quantification, n=number of time-lapse movies (EV, n=17; non silencing, n=12; DOCK4 sh1, n=18; mock, n=6; nontargeting, n=6; DOCK4 sp, n=6; DOCK4 ot, n=6) from independent experiments (EV, n=3; DOCK4 sh1, n=3; non silencing, n=2; mock, n=2; nontargeting, n=2; DOCK4 sp, n=2; DOCK4 ot, n=2); lines represent the mean. Knockdown quantified by quantitative PCR (DOCK4 sp, ot) or immunoblot (DOCK4 sh; shown in Supplementary Fig. 1k). (b) VE-cadherin expression following DOCK4 depletion 2 days after seeding HUVEC onto CFs. (i) and (ii): magnifications of outlined boxes. Scale bar, 50 μm. (c) Branch formation (arrows) following DOCK4 depletion as in b 7 days after seeding HUVEC onto CFs. Scale bar, 100 μm. Histogram: branch point index. For each value, the number of branches divided by tubule length±s.e.m.; n=number of organotypic cocultures (EV, n=8; non silencing, n=11; DOCK4 sh1, n=8; DOCK4 sh2, n=11) from independent experiments (EV, n=3; non silencing, n=4; DOCK4 sh1, n=3; DOCK4 sh2, n=4). (d) VE-cadherin expression 7 days after seeding HUVEC with DOCK4 depletion as in b. Scale bar 25 μm. (e) Lumen formation (asterisk) following DOCK4 depletion as in c 14 days after seeding onto CFs. 3D reconstructions are from confocal Z-stacks (Supplementary Movies 1 and 2). Scale bar, 25 μm. Scatter plot: lumenized length as percentage of total length, n=number of organotypic cocultures (DOCK4 sh1, n=11; DOCK4 sh2, n=6; EV, n=15; non silencing, n=7) from independent experiments (DOCK4 sh1, n=2; DOCK4 sh2, n=2; EV, n=3; non silencing, n=2); lines represent the mean. (f) Images from Supplementary Movies 3 and 4 of tubule formation following DOCK4 depletion (shRNA1, sh; EV, empty vector) 4 days after seeding onto CFs. Arrowheads: white, protrusions persisting >5 h; red, elongating tip. Scale bar, 50 μM. Histogram: quantifications over 48 h of protrusions persisting >5 h±s.e.m.; n=number of time-lapse movies (DOCK4 sh, n=19; non silencing, n=11; EV, n=11) from independent experiments (DOCK4 sh, n=3; non silencing, n=2; EV, n=2). (g) Histogram: quantifications over 48 h of anastomoses±s.e.m.; n=number of time-lapse movies (non silencing, n=11; DOCK4 sh, n=19; EV, n=17) from independent experiments (non silencing, n=2; DOCK4 sh1, n=3; EV, n=3); NS, non significant by two-tailed t-test. Images from Supplementary Movies 5 and 6 showing anastomoses in Supplementary Fig. 1j. *P<0.05, **P<0.01, ***P<0.001; NS, non significant by two-tailed t test.
Figure 2
Figure 2. Rac activation controls tubule formation with RhoG and Cdc42
(a) Rac1 activation (GTP-bound Rac/total Rac) following DOCK4 depletion (si, smartpool siRNA) in HUVEC stimulated with VEGF (25 ng ml−1), bars indicate s.e.m.; n=4 independent experiments. Rac1 activation following shRNA-mediated DOCK4 depletion is shown in Supplementary Fig. 1k. (b) Images of organotypic cocultures (CD31 staining) show tubule morphology following Rho GTPase depletion (siRNA, si) in HUVEC 5 days after seeding onto CFs. Scale bar, 200 μm. Top histogram: quantification of total tubule length, number of tubules, number of branch points±s.e.m.; n=number of independent experiments (nontargeting, n=4; Rac1, n=3; RhoG, n=4; Cdc42, n=3); three cocultures quantified in each experiment. Table shows knockdown quantified by quantitative PCR. Lower histogram: branch point index. Bars represent junctions divided by tubule length±s.e.m.; n=number of independent experiments as in b. *P<0.05; **P<0.01 by two-tailed t-test compared with nontargeting control.
Figure 3
Figure 3. DOCK4 is required for lateral filopodia formation and Cdc42 activation
(a) Confocal images of filopodia in organotypic cocultures following VEGF stimulation (25 ng ml−1). HUVEC–EGFP were seeded onto CFs and after 4 days the culture media were replenished with VEGF-containing media. Cocultures were imaged after 24 h. Scale bar, 50 μM. (b) Confocal images of phalloidin staining of filopodia (yellow arrows) in the presence of VEGF (25 ng ml−1) 6 days after seeding HUVEC with DOCK4 depletion (EV, empty vector; sh, shRNA1) onto CFs. Scale bar, 25 μM. (c) Confocal images of filopodia as in b after depletion of Rac1 or DOCK4 (EV, empty vector; sh1, shRNA1). Images are maximum intensity projections of confocal Z-stacks. Scale bar, 50 μM. Histogram: filopodia quantifications, error bars indicate s.e.m.; n=number of organotypic cocultures (EV, n=8; Rac sh1, n=6; DOCK4 sh1, n=6) from independent experiments (EV, n=3; Rac sh1, n=2; DOCK4 sh1, n=3). Knockdown was quantified by immunoblot (Supplementary Figs 1k and 2a). (d) Confocal images show persisting tip filopodia (red arrow) in tubules with DOCK4 depletion as in b. Scale bar, 50 μM. (e) Treatment with 0.01 μg ml−1 Latrunculin B (LatB) blocks lateral filopodia. Cocultures were treated for 48 h starting at 6 days after seeding HUVEC onto CFs. Middle panel shows filopodia in single confocal Z-stack (asterisk, focus level). Scale bar, 50 μM. (f) Histogram: quantification of lumenized length 14 days after seeding HUVEC onto CFs and following 48 h 0.01 μg ml−1 LatB treatment at 3, 6 and 9 days (6 days total treatment) compared with untreated control. Each value represents the lumenized length as percentage of total length±s.e.m.; n=4 organotypic cocultures for each condition. Supplementary Figure 3c,d shows adherens junctions and thin tubule morphology with LatB treatment. (g) Immunoblots of Cdc42 activation with VEGF stimulation (25 ng ml−1) in HUVEC after depletion of Rac1 (ol1, siRNA oligonucleotide 1). Histogram: fold Cdc42 activation (GTP-bound Cdc42/total Cdc42) following Rac1 depletion (si, siRNA oligonucleotide 1), error bars indicate s.e.m.; n=3 independent experiments; Supplementary Fig. 3e shows Cdc42 activation with shRNA-mediated Rac1 knockdown. (h) Images of phalloidin-stained 293T cells following overexpression of EGFP–Rac1 and knockdown of Cdc42 (si, siRNA). Vector (EGFP) and EGFP–Rac1 (top panels) were co-transfected with nontargeting siRNA. Images of wider areas in Supplementary Fig. 3g. Scale bar, 25 μM. Histogram: filopodia quantifications, error bars indicate s.e.m.; n=30 cells from two independent experiments. (i) DOCK4→Rac1→Cdc42 signalling module regulates filopodia formation. *P<0.05, **P<0.01, ***P<0.001 by two-tailed t test.
Figure 4
Figure 4. RhoG and SGEF control Rac1 activation and lateral filopodia formation
(a) Immunoblots of Rac1 activation on VEGF stimulation (25 ng ml−1) in HUVEC following RhoG depletion (si, siRNA smartpool). Histogram: fold increase of Rac1 activation (GTP-bound Rac/total Rac) on VEGF stimulation. Error bars represent s.e.m.; n=independent experiments (15 min, n=3; 30 min and 60 min, n=5). Supplementary Figure 4a shows RhoG requirement for Rac activation following depletion with on-target oligonucleotides. (b) Immunoblots show levels of activated RhoG in HUVEC after 30 min VEGF stimulation (25 ng ml−1) and following depletion of Trio, SGEF or FLJ10665 (si, siRNA smartpool). Histogram: fold RhoG activation (GTP-bound RhoG/total RhoG) compared with VEGF-treated nontargeting control. Error bars represent s.e.m. (n=3 independent experiments). Supplementary Figure 4c shows blockade of VEGF-stimulated RhoG activation on SGEF depletion with on-target oligonucleotides. (c) Images show loss of filopodia by CD31 staining following RhoG or SGEF depletion (ot, on-target plus oligonucleotides; si, siRNA smartpool) in cocultures treated with VEGF (Supplementary Fig. 1a) 5 days after seeding HUVEC onto CFs. Arrows: tip filopodia; (i–iv): magnifications of outlined areas in main images. Scale bar, 100 μm. Histograms: upper panel, quantification of total filopodia; lower panel, quantification of lateral filopodia (red dots) and tip filopodia (white dots). Error bars s.e.m.; n=number of organotypic cocultures (Scr±VEGF, n=7; RhoG, n=5; SGEFot5, n=6; SGEFot6, n=6; DOCK4ot11, n=3; Trio ot5, n=6; Trio ot7, n=6) from independent experiments (Scr±VEGF, n=3; RhoG, n=2; SGEFot5, n=3; SGEFot6, n=3; DOCK4ot11, n=2; Trio ot5, n=3; Trio ot7, n=3). Table shows knockdown quantified by quantitative PCR. (d) Immunoblots in upper panels: Rac1 activation in HEK293T cells with RhoG overexpression; lower panels: RhoG and DOCK4 levels by western blot. (e) RhoG→DOCK4→Rac1 signalling module controls lateral filopodia formation. *P<0.05, **P<0.01, ***P<0.001 by two-tailed t-test compared with indicated controls.
Figure 5
Figure 5. DOCK4 is required for DOCK9-dependent activation of Cdc42 and filopodia formation
(a) Immunoblots of Cdc42 activation on VEGF stimulation (25 ng ml−1) in HUVEC following DOCK4 depletion (smartpool siRNA). Histogram: fold Cdc42 activation (GTP-bound Cdc42/total Cdc42) in HUVEC after DOCK4 depletion; error bars indicate s.e.m.; n=3 independent experiments). Supplementary Figure 5a shows blockade of Cdc42 activation on DOCK4 depletion with an on-target oligonucleotide. (b) Immunoblots show activated Cdc42 levels in HUVEC after 30 min VEGF stimulation (25 ng ml−1) and following depletion of DOCK9, DOCK10 or DOCK11 (si, siRNA smartpool). Histogram: fold Cdc42 activation (GTP-bound Cdc42/total Cdc42) compared with VEGF-treated nontargeting control. Error bars s.e.m. (n=3 independent experiments). (c) Images of tubules (CD31 staining) show filopodia formation following DOCK9 depletion (ot, on-target plus oligonucleotides; si, siRNA smartpool) in cocultures treated with VEGF (Supplementary Fig. 1a) 5 days after seeding onto CFs visualized by CD31 staining. Arrows: tip filopodia; (i–vi): magnifications of boxes in main images. Scale bar, 100 μm. Histograms: quantification of total filopodia (upper panel) and lateral or tip filopodia (lower panel). Error bars represent s.e.m.; n=number of organotypic cocultures (Scr±VEGF, n=6; DOCK9ot10, n=6; DOCK9 ot11, n=5) from independent experiments (Scr±VEGF, n=3; DOCK9ot10, n=3; DOCK9 ot11, n=2). Knockdown was quantified by quantitative PCR. (d) Immunoblots in upper panels: Cdc42 activation in 293T cells with Rac1 and RhoG overexpression; immunoblots in middle and lower panels: levels of Rac1, RhoG, DOCK4 and DOCK9. (e) SGEF→RhoG→DOCK4→Rac1→DOCK9→Cdc42 signalling module controls lateral filopodia formation. *P<0.05, **P<0.01, ***P<0.001 by two-tailed t-test compared with indicated controls.
Figure 6
Figure 6. Rac GEF DOCK4 and Cdc42 GEF DOCK9 are in a complex
(a) Mass spectrometry analysis following IP from 293T cells of overexpressed 3 × Flag–DOCK9 (DOCK9 interaction partners in Supplementary Table 3). (b) Upper panels show immunoblot of DOCK4 in DOCK9 or control IgG immunoprecipitated complexes (IPs) following GFP–DOCK4 and empty vector (GFP) overexpression and immunoprecipitated DOCK9 in the IPs. Lower panels show overexpressed GFP–DOCK4 and empty vector (GFP) in total lysate (TL). (c) Immunoblot of DOCK4 in DOCK9 IPs following VEGF stimulation (25 ng ml−1) and after Rac1 knockdown (Rac1 si, siRNA ol1). Fold increase of DOCK4–DOCK9 interaction compared with unstimulated control after normalization for DOCK9 in IP and DOCK4 in total lysate (TL). (d) Immunoblot of Flag-DOCK4 in DOCK9 IPs following overexpression of DOCK4 wildtype or deletion mutants in 293T shows the DOCK4-SH3 and DHR2 domains are required for interaction with DOCK9. (e) Immunoblot of DOCK9 in GST–SH3 pulldowns (PLs). Right hand panel: GST proteins visualized by Coomasie Brilliant Blue (CBB) staining. (f) Immunobots of DOCK9 (left panels) and DOCK4 (right panels) in GST–ELMO PLs following knockdown of DOCK4 and DOCK9, respectively, show DOCK4 is necessary for interaction of DOCK9 with ELMO. (g) Filopodia formation following zyxin depletion (si, siRNA smartpool) in cocultures treated with VEGF (Supplementary Fig. 1a) 5 days after seeding onto CFs visualized by CD31 staining. Arrow: tip filopodia. Scale bar, 100 μm. Histograms: quantification of total filopodia (upper panel) and lateral or tip filopodia (lower panel). Error bars s.e.m.; n=4 organotypic cocultures from two independent experiments. Knockdown was quantified by quantitative PCR. P<0.001 by two-tailed t-test compared to the indicated control.
Figure 7
Figure 7. DOCK4 controls lumen formation in tumours
(a) Images of sections immunostained with endomucin to visualize blood vessels in BE xenograft tumours following DOCK4 shRNA transduction of the vascular compartment. Scale bar, 50 μm. Histogram: counts of lumenized vessels as %total vessel count in individual tumours, error bars indicate s.e.m.; n=12 microscopic fields representing three different tumour levels. (b) CAIX staining of tumour sections to show hypoxic regions. Scale bar, 200 μm. (c) Lumen analysis in EO771 tumours implanted in Dock4 wildtype (WT) and heterozygous (Het) mice (three tumours from each condition). Left scatter plot: average lumen width; right scatter plot: frequency of lumen size; n=4 tiled images for each tumour representing two tumour levels, each image across a tumour section. *P<0.05, **P<0.01, ***P<0.001 by two-tailed t-test compared with indicated controls.
Figure 8
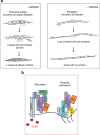
Figure 8. Model of regulation of filopodia formation and lumen morphogenesis by Rac GEF DOCK4
(a) Stages of tubule development and lumen formation in the presence or absence of DOCK4. Dynamic remodelling via lateral filopodia and protrusions leads to formation of lumens lined by apposing endothelial cells. In the absence of DOCK4, lack of dynamic protrusive activity and dynamic remodelling leads to thin tubules lacking lateral cell–cell contacts which do not form a lumen. (b) Signalling downstream of VEGF activates the SGEF→RhoG→DOCK4→Rac1→DOCK9→Cdc42 signalling pathway and promotes interaction of Rac GEF DOCK4 with Cdc42 DOCK9.

References

    1. Hanahan D. & Weinberg R. A. Hallmarks of cancer: the next generation. Cell 144, 646–674 (2011). - PubMed
    1. Goel S. et al. Normalization of the vasculature for treatment of cancer and other diseases. Physiol. Rev. 91, 1071–1121 (2011). - PMC - PubMed
    1. Eilken H. M. & Adams R. H. Dynamics of endothelial cell behavior in sprouting angiogenesis. Curr. Opin. Cell Biol. 22, 617–625 (2010). - PubMed
    1. Abraham S. et al. VE-Cadherin-mediated cell–cell interaction suppresses sprouting via signaling to MLC2 phosphorylation. Curr. Biol. 19, 668–674 (2009). - PubMed
    1. Gerhardt H. et al. VEGF guides angiogenic sprouting utilizing endothelial tip cell filopodia. J. Cell Biol. 161, 1163–1177 (2003). - PMC - PubMed

Publication types

MeSH terms

Substances