

A statistical framework to model the meeting-in-the-middle principle using metabolomic data: application to hepatocellular carcinoma in the EPIC study
- PMID: 26130468
- PMCID: PMC5909887
- DOI: 10.1093/mutage/gev045
A statistical framework to model the meeting-in-the-middle principle using metabolomic data: application to hepatocellular carcinoma in the EPIC study
Abstract
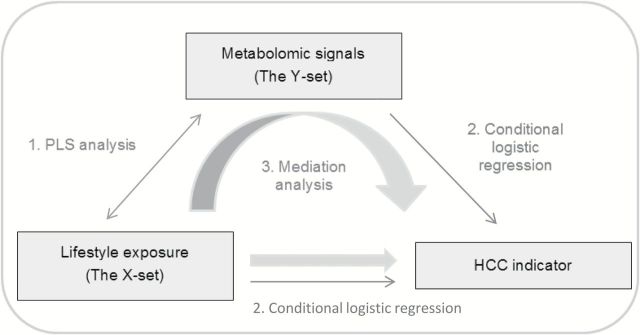
Metabolomics is a potentially powerful tool for identification of biomarkers associated with lifestyle exposures and risk of various diseases. This is the rationale of the 'meeting-in-the-middle' concept, for which an analytical framework was developed in this study. In a nested case-control study on hepatocellular carcinoma (HCC) within the European Prospective Investigation into Cancer and nutrition (EPIC), serum (1)H nuclear magnetic resonance (NMR) spectra (800 MHz) were acquired for 114 cases and 222 matched controls. Through partial least square (PLS) analysis, 21 lifestyle variables (the 'predictors', including information on diet, anthropometry and clinical characteristics) were linked to a set of 285 metabolic variables (the 'responses'). The three resulting scores were related to HCC risk by means of conditional logistic regressions. The first PLS factor was not associated with HCC risk. The second PLS metabolomic factor was positively associated with tyrosine and glucose, and was related to a significantly increased HCC risk with OR = 1.11 (95% CI: 1.02, 1.22, P = 0.02) for a 1SD change in the responses score, and a similar association was found for the corresponding lifestyle component of the factor. The third PLS lifestyle factor was associated with lifetime alcohol consumption, hepatitis and smoking, and had negative loadings on vegetables intake. Its metabolomic counterpart displayed positive loadings on ethanol, glutamate and phenylalanine. These factors were positively and statistically significantly associated with HCC risk, with 1.37 (1.05, 1.79, P = 0.02) and 1.22 (1.04, 1.44, P = 0.01), respectively. Evidence of mediation was found in both the second and third PLS factors, where the metabolomic signals mediated the relation between the lifestyle component and HCC outcome. This study devised a way to bridge lifestyle variables to HCC risk through NMR metabolomics data. This implementation of the 'meeting-in-the-middle' approach finds natural applications in settings characterised by high-dimensional data, increasingly frequent in the omics generation.
© The Author 2015. Published by Oxford University Press on behalf of the UK Environmental Mutagen Society. All rights reserved. For permissions, please e-mail: journals.permissions@oup.com.
Figures
References
-
- Nicholson J. K. Holmes E. and Elliott P (2008) The metabolome-wide association study: a new look at human disease risk factors. J. Proteome Res., 7, 3637–3638. - PubMed
-
- Chadeau-Hyam M. Campanella G. Jombart T. Bottolo L. Portengen L. Vineis P. Liquet B. and Vermeulen R. C (2013) Deciphering the complex: methodological overview of statistical models to derive OMICS-based biomarkers. Environ. Mol. Mutagen., 54, 542–557. - PubMed
Publication types
MeSH terms
Substances
Grants and funding
LinkOut - more resources
Full Text Sources
Other Literature Sources
Medical
