. 2016 Apr;24(4):592-9.
doi: 10.1038/ejhg.2015.150. Epub 2015 Jul 1.

Evaluation of transethnic fine mapping with population-specific and cosmopolitan imputation reference panels in diverse Asian populations

Affiliations

Evaluation of transethnic fine mapping with population-specific and cosmopolitan imputation reference panels in diverse Asian populations

Xu Wang et al. Eur J Hum Genet. 2016 Apr.

Abstract

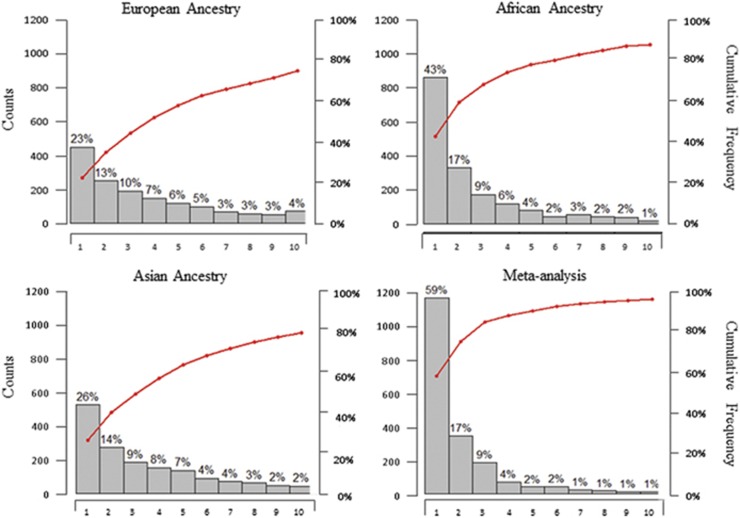
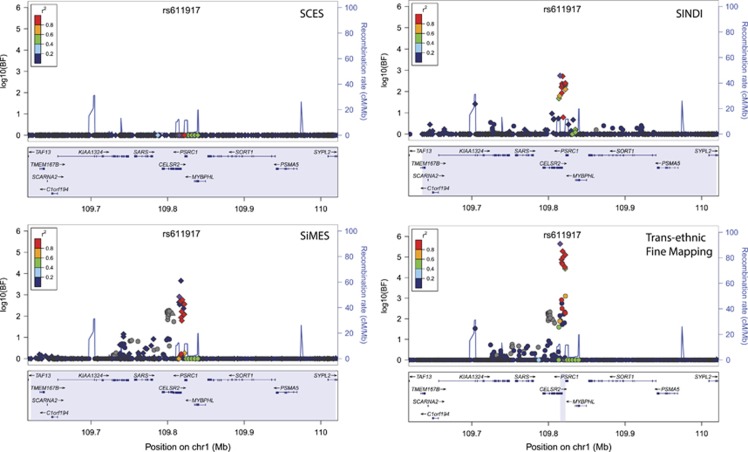
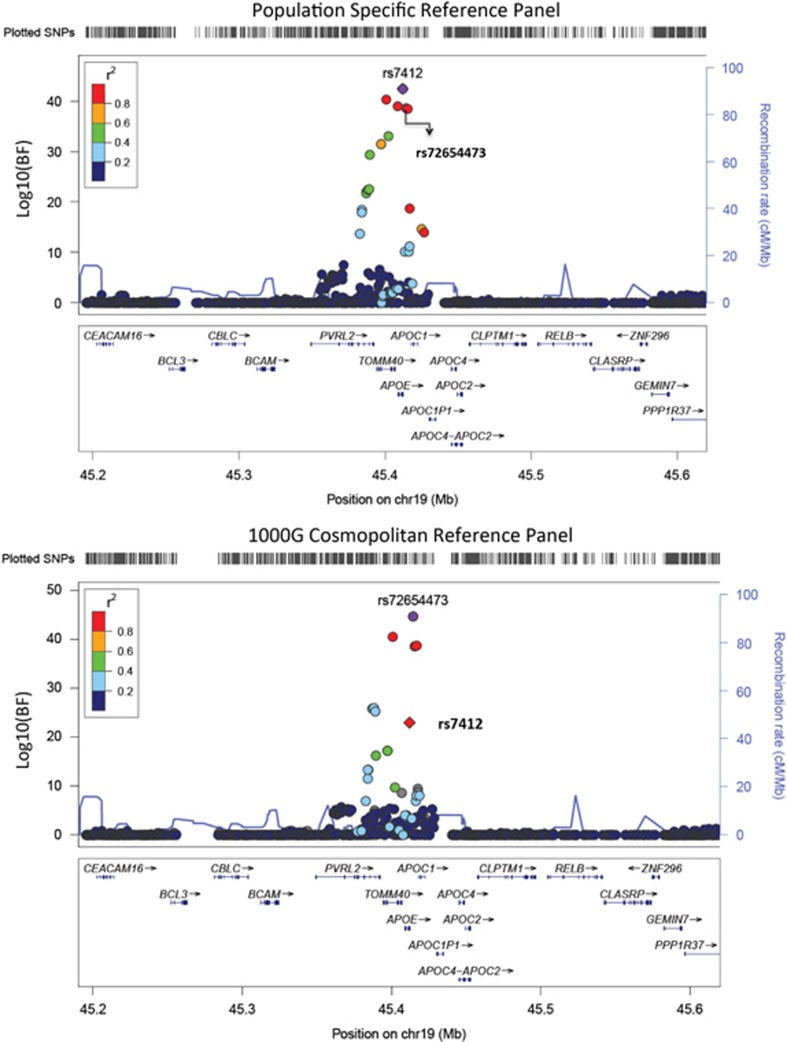
There has been limited success in identifying causal variants underlying association signals observed in genome-wide association studies (GWAS). The use of 1000 Genomes Project (1KGP) allows the imputation to estimate the genetic information at untyped variants. However, long stretches of high linkage disequilibrium within the genome prevent us from differentiating between causal variants and perfect surrogates, thus limiting our ability to identify causal variants. Transethnic strategies have been proposed as a possible solution to mitigate this. However, these studies generally rely on imputing genotypes from multiple ancestries from 1KGP but not against population-specific reference panels. Here, we perform the first transethnic fine-mapping study across three Asian cohorts from diverse ancestries at the loci implicated with eye and blood lipid traits, using population-specific reference panels that have been generated by whole-genome sequencing samples from the same ancestry groups. Our study outlines several challenges faced in a fine-mapping exercise where one simply aims to meta-analyse existing GWAS that have been imputed against reference haplotypes from the 1KGP.


Figures

Figure 1
Figure 1
Histograms (gray vertical bars) and cumulative frequencies (red lines) on the ranks of the simulated causal variants out of 2000 rounds of simulations. The horizontal axes indicate the rank of the association evidence at the rediscovered causal variant in comparison with all neighboring variants. Three of the display panels indicate the causal variant ranking when the analysis is performed with the data from a single ancestry panel, whereas the fourth display panel indicates the rank when data from three ancestry groups are combined in a transethnic fine-mapping.
Figure 2
Figure 2
Regional plots of SNPs at the LDL-C locus, CELSR2, for the Chinese (SCES), Malays (SiMES), Indians (SINDI) and the transethnic fine mapping of all three cohorts. The vertical axes measure the statistical evidence of association with the log10 BF, and each SNP is indicated by a colored circle, diamond or triangle. In each panel, the index SNP rs611917 is indicated by the purple diamond, whereas all remaining SNPs are assigned colors according to the extent of LD, with the lead SNP in six categories: (i) r2≥0.8 (red); (ii) 0.6≤r2<0.8 (gold); (iii) 0.4≤r2<0.6 (green); (iv) 0.2≤r2<0.4 (cyan); (v) (ii) r2<0.2 (blue); and (vi) unknown r2 (gray). Diamonds represent variants that are found within the ‘99% credible set' and function-altering variants are represented with triangles. Recombination rates estimated from the International HapMAp Project are superimposed with blue lines, and all gene annotations are obtained from the University of California Santa Cruz genome browser.
Figure 3
Figure 3
Regional plots of SNPs at the LDL-C locus TOMM40-APOE from two transethnic meta-analyses using either the population-specific reference panels or the cosmopolitan reference panel from the 1000 Genomes Project. In each panel, the index SNP is represented in purple with either a circle or a diamond, with the latter used if the variant is annotated to alter function by the University of California Santa Cruz genome browser. All remaining SNPs are assigned colors according to the extent of LD with the lead SNP in six categories: (i) r2≥0.8 (red); (ii) 0.6≤r2<0.8 (gold); (iii) 0.4≤r2<0.6 (green); (iv) 0.2≤r2<0.4 (cyan); (v) (ii) r2<0.2 (blue); and (vi) unknown r2 (gray).

Similar articles

  • Accuracy of genome-wide imputation of untyped markers and impacts on statistical power for association studies.
    Hao K, Chudin E, McElwee J, Schadt EE. Hao K, et al. BMC Genet. 2009 Jun 16;10:27. doi: 10.1186/1471-2156-10-27. BMC Genet. 2009. PMID: 19531258 Free PMC article.
  • Genotype-imputation accuracy across worldwide human populations.
    Huang L, Li Y, Singleton AB, Hardy JA, Abecasis G, Rosenberg NA, Scheet P. Huang L, et al. Am J Hum Genet. 2009 Feb;84(2):235-50. doi: 10.1016/j.ajhg.2009.01.013. Am J Hum Genet. 2009. PMID: 19215730 Free PMC article.
  • Discovery and fine mapping of serum protein loci through transethnic meta-analysis.
    Franceschini N, van Rooij FJ, Prins BP, Feitosa MF, Karakas M, Eckfeldt JH, Folsom AR, Kopp J, Vaez A, Andrews JS, Baumert J, Boraska V, Broer L, Hayward C, Ngwa JS, Okada Y, Polasek O, Westra HJ, Wang YA, Del Greco M F, Glazer NL, Kapur K, Kema IP, Lopez LM, Schillert A, Smith AV, Winkler CA, Zgaga L; LifeLines Cohort Study; Bandinelli S, Bergmann S, Boban M, Bochud M, Chen YD, Davies G, Dehghan A, Ding J, Doering A, Durda JP, Ferrucci L, Franco OH, Franke L, Gunjaca G, Hofman A, Hsu FC, Kolcic I, Kraja A, Kubo M, Lackner KJ, Launer L, Loehr LR, Li G, Meisinger C, Nakamura Y, Schwienbacher C, Starr JM, Takahashi A, Torlak V, Uitterlinden AG, Vitart V, Waldenberger M, Wild PS, Kirin M, Zeller T, Zemunik T, Zhang Q, Ziegler A, Blankenberg S, Boerwinkle E, Borecki IB, Campbell H, Deary IJ, Frayling TM, Gieger C, Harris TB, Hicks AA, Koenig W, O' Donnell CJ, Fox CS, Pramstaller PP, Psaty BM, Reiner AP, Rotter JI, Rudan I, Snieder H, Tanaka T, van Duijn CM, Vollenweider P, Waeber G, Wilson JF, Witteman JC, Wolffenbuttel BH, Wright AF, Wu Q, Liu Y, Jenny NS, North KE, Felix JF, Alizadeh BZ, Cupples LA, Perry JR, Morris AP. Franceschini N, et al. Am J Hum Genet. 2012 Oct 5;91(4):744-53. doi: 10.1016/j.ajhg.2012.08.021. Epub 2012 Sep 27. Am J Hum Genet. 2012. PMID: 23022100 Free PMC article.
  • Increasing the resolution and precision of psychiatric genome-wide association studies by re-imputing summary statistics using a large, diverse reference panel.
    Chatzinakos C, Lee D, Cai N, Vladimirov VI, Webb BT, Riley BP, Flint J, Kendler KS, Ressler KJ, Daskalakis NP, Bacanu SA. Chatzinakos C, et al. Am J Med Genet B Neuropsychiatr Genet. 2021 Jan;186(1):16-27. doi: 10.1002/ajmg.b.32834. Epub 2021 Feb 11. Am J Med Genet B Neuropsychiatr Genet. 2021. PMID: 33576176 Free PMC article. Review.
  • Genotype Imputation from Large Reference Panels.
    Das S, Abecasis GR, Browning BL. Das S, et al. Annu Rev Genomics Hum Genet. 2018 Aug 31;19:73-96. doi: 10.1146/annurev-genom-083117-021602. Epub 2018 May 23. Annu Rev Genomics Hum Genet. 2018. PMID: 29799802 Review.

Cited by

References

    1. McCarthy MI, Abecasis GR, Cardon LR et al: Genome-wide association studies for complex traits: consensus, uncertainty and challenges. Nat Rev Genet 2008; 9: 356–369. - PubMed
    1. Manolio TA, Collins FS, Cox NJ et al: Finding the missing heritability of complex diseases. Nature 2009; 461: 747–753. - PMC - PubMed
    1. Abecasis GR, Auton A, Brooks LD et al: An integrated map of genetic variation from 1,092 human genomes. Nature 2012; 491: 56–65. - PMC - PubMed
    1. Durbin RM, Abecasis GR, Altshuler DL et al: A map of human genome variation from population-scale sequencing. Nature 2010; 467: 1061–1073. - PMC - PubMed
    1. Jallow M, Teo YY, Small KS et al: Genome-wide and fine-resolution association analysis of malaria in West Africa. Nat Genet 2009; 41: 657–665. - PMC - PubMed

Publication types

LinkOut - more resources