

A DNA shape-based regulatory score improves position-weight matrix-based recognition of transcription factor binding sites
- PMID: 26130577
- PMCID: PMC4838056
- DOI: 10.1093/bioinformatics/btv391
A DNA shape-based regulatory score improves position-weight matrix-based recognition of transcription factor binding sites
Abstract
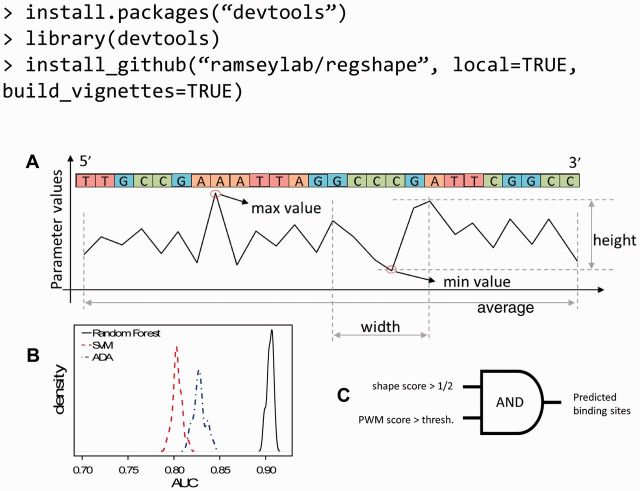
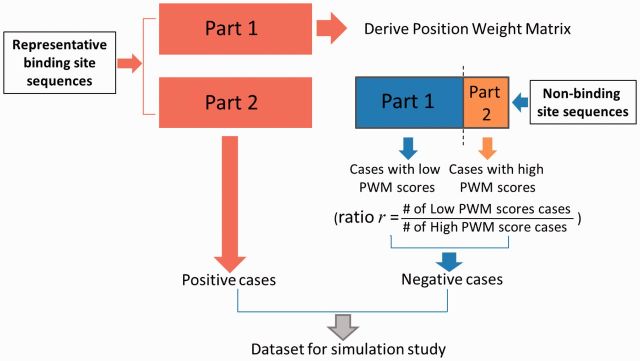
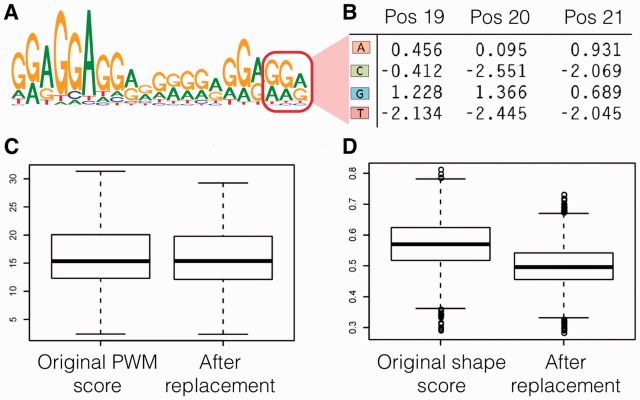
Motivation: The position-weight matrix (PWM) is a useful representation of a transcription factor binding site (TFBS) sequence pattern because the PWM can be estimated from a small number of representative TFBS sequences. However, because the PWM probability model assumes independence between individual nucleotide positions, the PWMs for some TFs poorly discriminate binding sites from non-binding-sites that have similar sequence content. Since the local three-dimensional DNA structure ('shape') is a determinant of TF binding specificity and since DNA shape has a significant sequence-dependence, we combined DNA shape-derived features into a TF-generalized regulatory score and tested whether the score could improve PWM-based discrimination of TFBS from non-binding-sites.
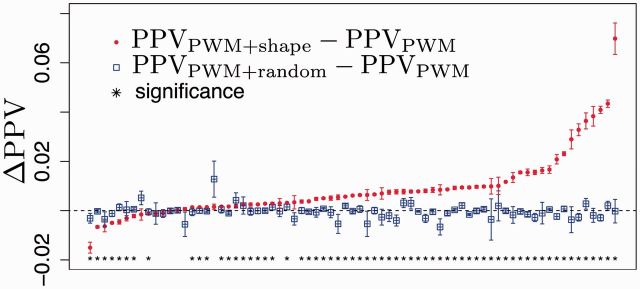
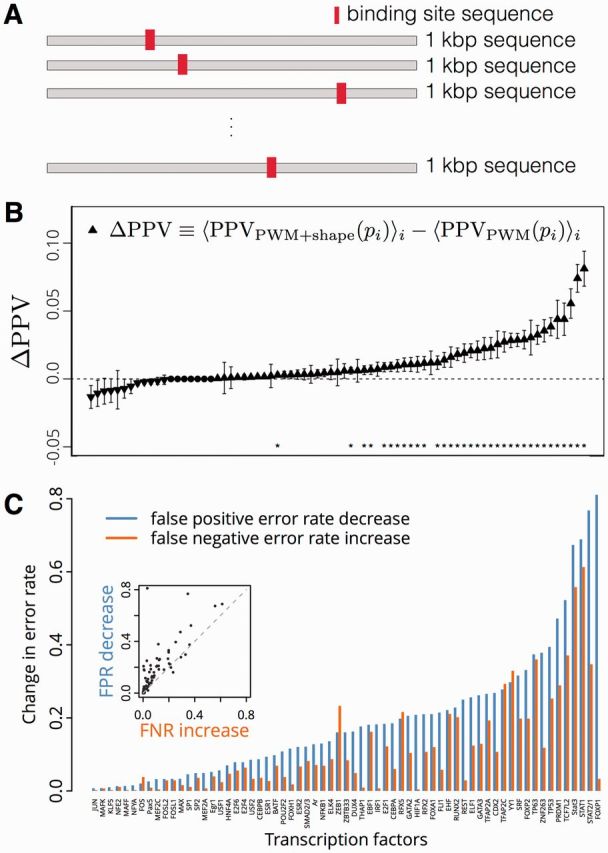
Results: We compared a traditional PWM model to a model that combines the PWM with a DNA shape feature-based regulatory potential score, for accuracy in detecting binding sites for 75 vertebrate transcription factors. The PWM+shape model was more accurate than the PWM-only model, for 45% of TFs tested, with no significant loss of accuracy for the remaining TFs.
Availability and implementation: The shape-based model is available as an open-source R package at that is archived on the GitHub software repository at https://github.com/ramseylab/regshape/.
Contact: stephen.ramsey@oregonstate.edu
Supplementary information: Supplementary data are available at Bioinformatics online.
© The Author 2015. Published by Oxford University Press. All rights reserved. For Permissions, please e-mail: journals.permissions@oup.com.
Figures
Similar articles
-
Transcription Factor Information System (TFIS): A Tool for Detection of Transcription Factor Binding Sites.Interdiscip Sci. 2017 Sep;9(3):378-391. doi: 10.1007/s12539-016-0168-5. Epub 2016 Apr 6. Interdiscip Sci. 2017. PMID: 27052996
-
Assessment of clusters of transcription factor binding sites in relationship to human promoter, CpG islands and gene expression.BMC Genomics. 2004 Feb 23;5(1):16. doi: 10.1186/1471-2164-5-16. BMC Genomics. 2004. PMID: 15053842 Free PMC article.
-
A general pairwise interaction model provides an accurate description of in vivo transcription factor binding sites.PLoS One. 2014 Jun 13;9(6):e99015. doi: 10.1371/journal.pone.0099015. eCollection 2014. PLoS One. 2014. PMID: 24926895 Free PMC article.
-
[Advances on bioinformatic research in transcription factor binding sites].Yi Chuan. 2009 Apr;31(4):365-73. doi: 10.3724/sp.j.1005.2009.00365. Yi Chuan. 2009. PMID: 19586888 Review. Chinese.
-
Building Transcription Factor Binding Site Models to Understand Gene Regulation in Plants.Mol Plant. 2019 Jun 3;12(6):743-763. doi: 10.1016/j.molp.2018.10.010. Epub 2018 Nov 15. Mol Plant. 2019. PMID: 30447332 Review.
Cited by
-
Quantitative modeling of gene expression using DNA shape features of binding sites.Nucleic Acids Res. 2016 Jul 27;44(13):e120. doi: 10.1093/nar/gkw446. Epub 2016 Jun 1. Nucleic Acids Res. 2016. PMID: 27257066 Free PMC article.
-
Predicting Variation of DNA Shape Preferences in Protein-DNA Interaction in Cancer Cells with a New Biophysical Model.Genes (Basel). 2017 Sep 18;8(9):233. doi: 10.3390/genes8090233. Genes (Basel). 2017. PMID: 28927002 Free PMC article.
-
A unified approach for quantifying and interpreting DNA shape readout by transcription factors.Mol Syst Biol. 2018 Feb 22;14(2):e7902. doi: 10.15252/msb.20177902. Mol Syst Biol. 2018. PMID: 29472273 Free PMC article.
-
Predicting DNA structure using a deep learning method.Nat Commun. 2024 Feb 9;15(1):1243. doi: 10.1038/s41467-024-45191-5. Nat Commun. 2024. PMID: 38336958 Free PMC article.
-
Sequence and chromatin determinants of transcription factor binding and the establishment of cell type-specific binding patterns.Biochim Biophys Acta Gene Regul Mech. 2020 Jun;1863(6):194443. doi: 10.1016/j.bbagrm.2019.194443. Epub 2019 Oct 19. Biochim Biophys Acta Gene Regul Mech. 2020. PMID: 31639474 Free PMC article. Review.
References
-
- Breiman L. (2001) Random forests. Machine Learn., 45, 5–32.
-
- Cartharius K., et al. (2005) MatInspector and beyond: promoter analysis based on transcription factor binding sites. Bioinformatics, 21, 2933–2942. - PubMed
Publication types
MeSH terms
Substances
Grants and funding
LinkOut - more resources
Full Text Sources
Other Literature Sources
Miscellaneous
