. 2015 Jul 9;523(7559):183-188.
doi: 10.1038/nature14610. Epub 2015 Jul 1.

Lenalidomide induces ubiquitination and degradation of CK1α in del(5q) MDS

Affiliations

Lenalidomide induces ubiquitination and degradation of CK1α in del(5q) MDS

Jan Krönke et al. Nature. .

Abstract

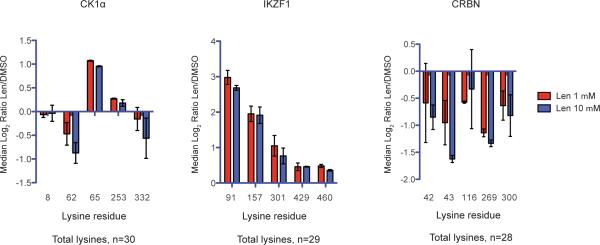
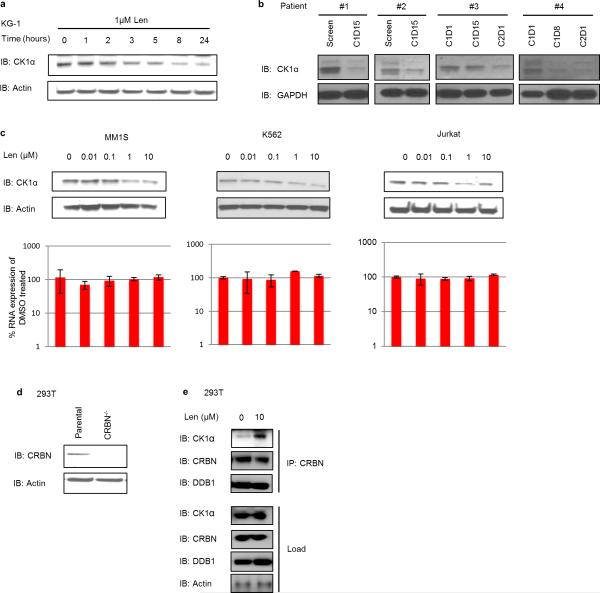
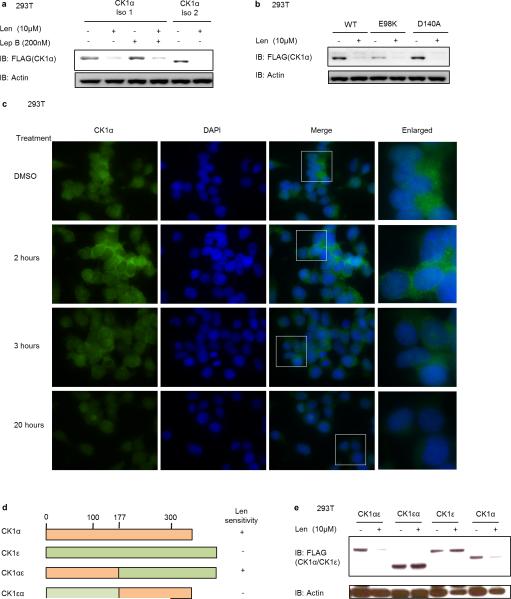
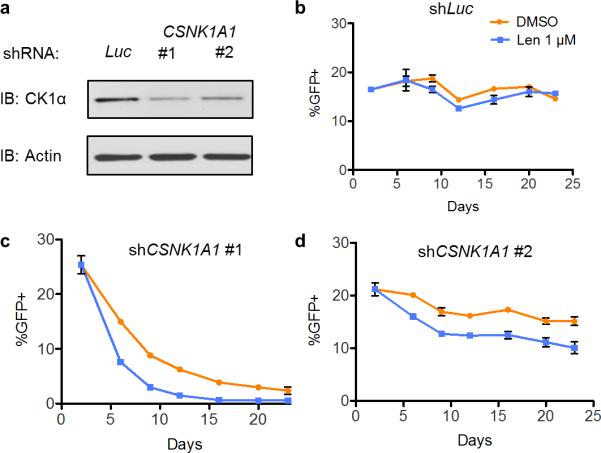
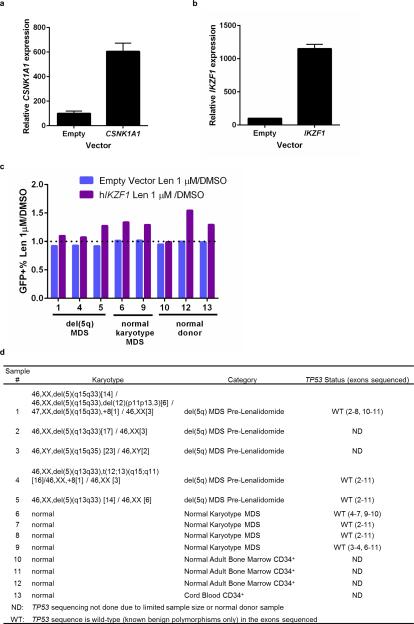
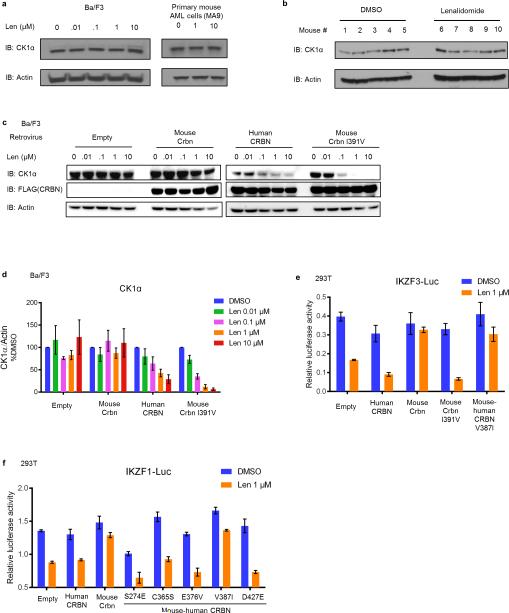
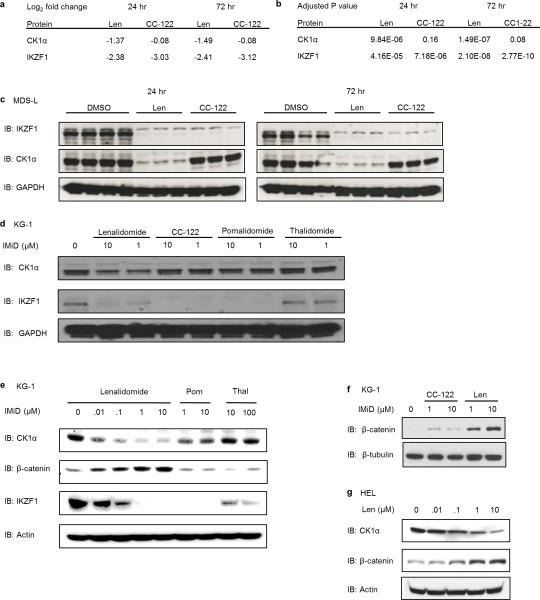
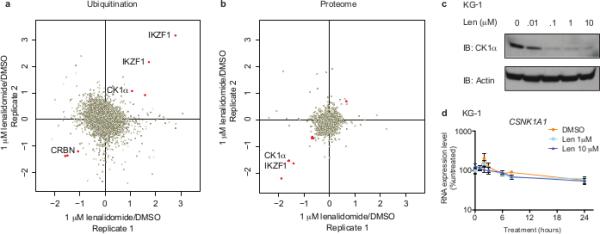
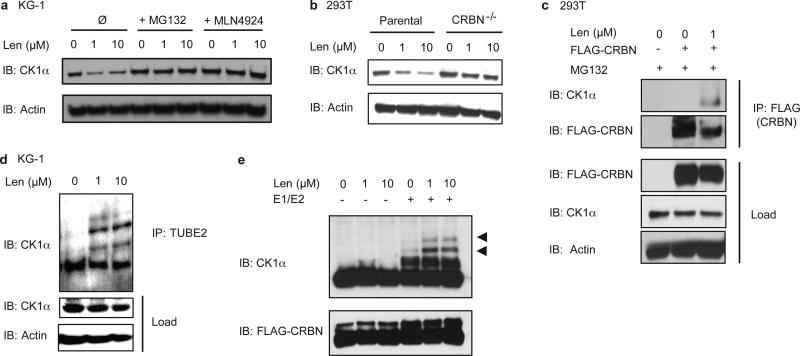
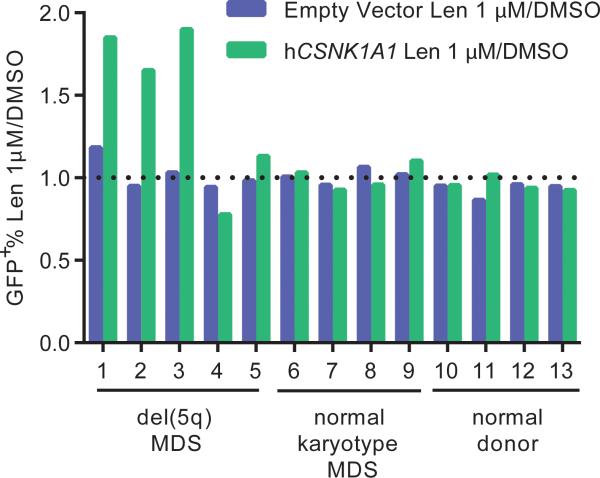
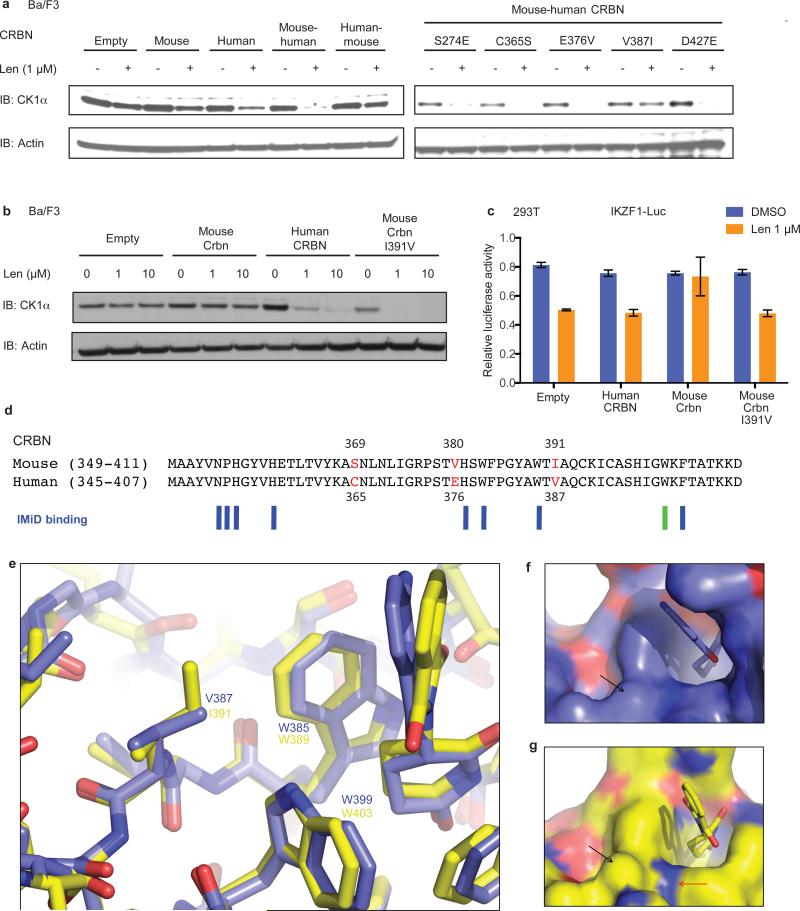
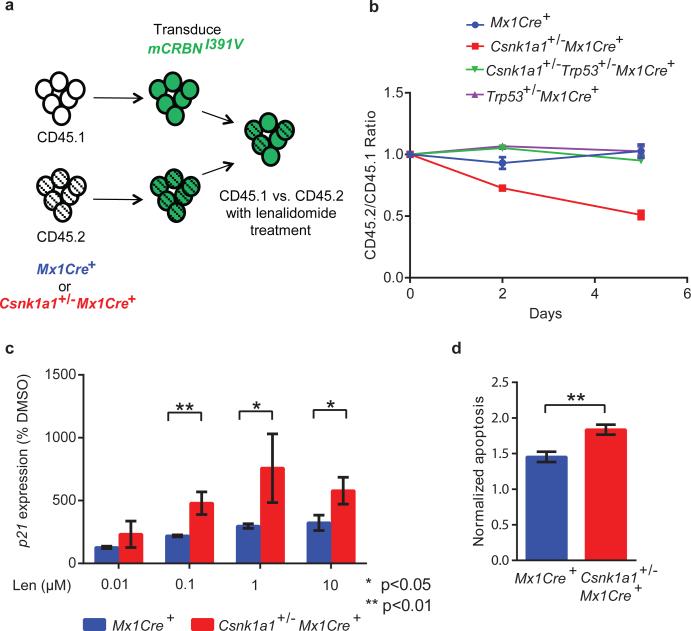
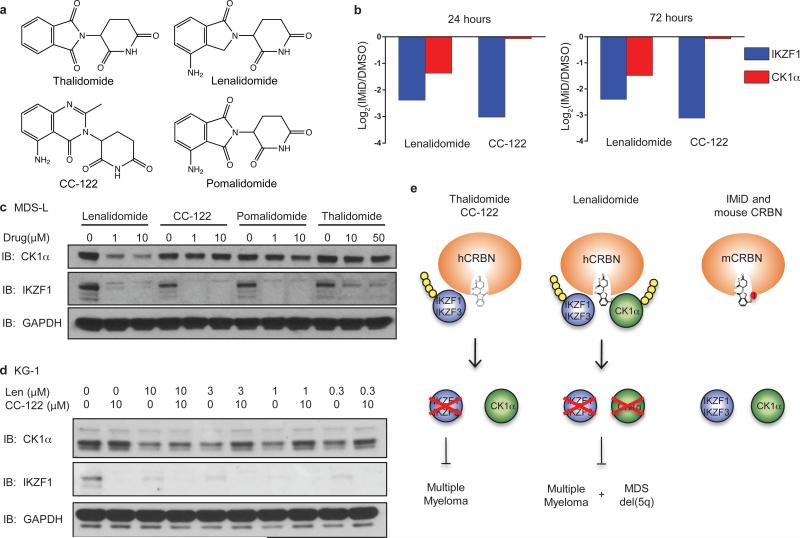
Lenalidomide is a highly effective treatment for myelodysplastic syndrome (MDS) with deletion of chromosome 5q (del(5q)). Here, we demonstrate that lenalidomide induces the ubiquitination of casein kinase 1A1 (CK1α) by the E3 ubiquitin ligase CUL4-RBX1-DDB1-CRBN (known as CRL4(CRBN)), resulting in CK1α degradation. CK1α is encoded by a gene within the common deleted region for del(5q) MDS and haploinsufficient expression sensitizes cells to lenalidomide therapy, providing a mechanistic basis for the therapeutic window of lenalidomide in del(5q) MDS. We found that mouse cells are resistant to lenalidomide but that changing a single amino acid in mouse Crbn to the corresponding human residue enables lenalidomide-dependent degradation of CK1α. We further demonstrate that minor side chain modifications in thalidomide and a novel analogue, CC-122, can modulate the spectrum of substrates targeted by CRL4(CRBN). These findings have implications for the clinical activity of lenalidomide and related compounds, and demonstrate the therapeutic potential of novel modulators of E3 ubiquitin ligases.


Figures

Extended Data Figure 1
Extended Data Figure 1. Effect of lenalidomide on specific ubiquitination sites
Median log2 ratios for different lysine residues in CK1α isoform 2, IKZF1 isoform 1, and CRBN isoform 2 for 1 or 10 μM lenalidomide treated KG-1 cells versus DMSO treated cells. SILAC experiments were performed in two biological replicates with flipped SILAC labeling. Only lysine residues detected in both replicates are shown. Error bars are range.
Extended Data Figure 2
Extended Data Figure 2. Effect of lenalidomide in human cells
a, Time course of effect of lenalidomide treatment on CK1α protein levels in KG-1 cells. b, Immunoblot of CK1α protein levels in the bone marrow (1,2) and peripheral blood (3,4) mononuclear cells of AML patients treated with lenalidomide as part of a clinical trial. Pre-treatment samples are taken at the screen or before the first treatment (C1D1). Subsequent time points are cycle 1 day 15 (C1D15), cycle 2 day 1 (C2D1) or cycle 1 day 8 (C1D8) of lenalidomide treatment. Further details about these patients (n=4) can be found in Extended Data Table 2. c, MM1S, K562, and Jurkat cells were treated with different concentrations of lenalidomide for 24 hours. CK1α protein levels were detected by western blot and CSNK1A1 mRNA expression levels were measured by RQ-PCR. Data are mean ± s.d., n=3 each with three technical replicates. d, Immunoblot confirming loss of CRBN expression in 293T cells with the CRBN gene disrupted by CRIPSR-Cas9 genome editing. e, Immunoprecipitation with a CRBN-specific antibody in 293T cells treated with DMSO or 10 μM lenalidomide for 5 hours in the presence of 10μM MG132. Results in a, c, d, and e are each representative of two independent experiments. Uncropped blots are shown in Supplementary Figure 1.
Extended Data Figure 3
Extended Data Figure 3. Sequence determinants of CK1α degradation
a, 293T cells were transfected with plasmids expressing FLAG-CK1α isoform 1 or isoform 2 together with an hCRBN-expressing plasmid. Cells were treated with DMSO or 10 μM lenalidomide for 16 hours. Cells expressing FLAG-CK1α isoform 1, which contains a nuclear localization domain, were incubated in the absence or presence of the nuclear export inhibitor leptomycin B. b, 293T cells expressing FLAG-CK1α isoform 2 wild-type or two different point mutations identified in patient samples were treated with DMSO or 10 μM lenalidomide for 16 hours. c, Immunofluorescence for CK1α after treatment with DMSO or 10 μM lenalidomide. Enlarged area is indicated by a box in Merge. FITC channel represents staining for CK1α. No changes in CK1α localization are seen upon lenalidomide treatment. Experiment was performed twice in biological duplicate. In each condition, at least 25 cells were assessed. d, Chimeric proteins of casein kinase 1A1 (CK1α) and casein kinase 1E (CK1ε), which shares significant homology with CK1α but is not responsive to lenalidomide, that were used in e to determine the lenalidomide-responsive region in CK1α. e, FLAG-tagged (chimeric) proteins from d were transfected in 293T cells together with a CRBN-expressing plasmid. Cells were treated with 1 μM lenalidomide for 24 hours and protein was detected with a FLAG-specific antibody. Data are representative of two (a, c), three (b) or four (e) independent experiments. Uncropped blots are shown in Supplementary Figure 1.
Extended Data Figure 4
Extended Data Figure 4. CSNK1A1 knockdown increases lenalidomide sensitivity in hematopoietic cells
a, Knockdown validation by western blot. b-d, CD34+ cells were transduced with GFP-labeled lentivirus expressing either control shRNA targeting luciferase (b) or shRNA targeting CSNK1A1 (c, d) and treated with DMSO or 1 μM lenalidomide. The percentage of GFP+ cells was assessed by flow cytometry over time. Results are representative of 3 independent experiments each with n=3 biological replicates.
Extended Data Figure 5
Extended Data Figure 5. Expression of CSNK1A1 and IKZF1 in patient samples
a, mRNA expression of CSNK1A1 in cord blood CD34+ cells infected with lentivirus expressing hCSNK1A1 or empty vector. CD34+ cells were infected with GFP-tagged lentivirus and GFP+ cells were sorted three days later. Values are mean ± s.d., n=4 biological replicates, each with 3 technical replicates. b, mRNA expression of IKZF1 in cord blood CD34+ cells infected with lentivirus expressing hIKZF1 or empty vector as in a. Values are mean ± s.d., n=3 biological replicates, each with 3 technical replicates. c, CD34+ cells derived from patient or control bone marrow were transduced with a lentivirus expressing IKZF1 and GFP or an empty control vector and treated with DMSO or 1 μM lenalidomide. The percentage of GFP+ cells was assessed by flow cytometry after five days for each vector-drug combination. Results are reported as a ratio of the percentage of GFP+ cells in the lenalidomide condition to the percentage of GFP+ cells in the DMSO condition. Results are combined from three experiments. d, Characteristics of patient samples used for CSNK1A1 and IKZF1 expression experiments. Results of TP53 sequencing, including exons with adequate coverage, is given in the rightmost column. All samples sequenced had wild-type TP53. ND, not done due to limited patient material. WT, TP53 exon sequence has only known benign polymorphisms.
Extended Data Figure 6
Extended Data Figure 6. Effect of lenalidomide on mouse cells
a, CK1α protein levels are unaffected in mouse Ba/F3 cells and primary mouse AML cells (MA9) treated with a range of lenalidomide doses. Data are representative of two independent experiments (n=2). b, CK1α expression in bone marrow cells of mice treated with DMSO (n=5) or lenalidomide (n=5). c, CK1α protein levels in Ba/F3 cells transduced with empty vector, mouse Crbn, human CRBN or mCrbnI391V and treated with lenalidomide d, Quantification of CK1α protein levels in Ba/F3 cells using ImageJ. Graphs show the fraction of normalized CK1α protein levels as compared to control (DMSO) treated cells of the respective line. Bars represent mean ± s.e.m. from three independent experiments as in c. e+f, Effect of lenalidomide on an IKZF3- (e) and IKZF1-luciferase fusion protein (f) in 293T cells expressing human, mouse or different chimeras or mutations of CRBN. Data are shown as mean ± s.e.m. (n=3, biological replicates) and are representative of three (f) or five (e) independent experiments. Uncropped blots are shown in Supplementary Figure 1.
Extended Data Figure 7
Difference electron density map of mouse residue I391 calculated in the absence of a sidechain showing the favored orientation of the residue. The density is contoured at 3.8 σ following a single round of Refmac5 refinement.
Extended Data Figure 8
Extended Data Figure 8. Comparison of the effects of thalidomide derivatives
a, Comparison of Log2 ratios for CK1α and IKZF1 in MDS-L cells after treatment with lenalidomide or CC-122 for 24 or 72 hours assessed by tandem mass tag (TMT) quantitative proteomics. Analysis was performed with n=4 for DMSO control and n=3 for each drug treatment time point. b, Adjusted P- values for CK1α and IKZF1 proteomic data in MDS-L cells. c, Western blot validation of IKZF1 and CK1α levels in DMSO (n=4), lenalidomide (n=3) and CC-122 (n=3) treated samples used for MDS-L proteomic analysis. d, Western blot validation of the effects of the different agents on CK1α and IKZF1 protein levels in KG-1 cells. e, Effect of lenalidomide, pomalidomide (Pom), and thalidomide (Thal) on protein levels of CK1α, β-catenin, and IKZF1 in KG-1 cells treated for 24 hours with the indicated drug concentrations. f, Effect of CC-122 and lenalidomide on β-catenin protein levels in KG-1 cells after 72 hours. g, Effect of lenalidomide on CK1α and β-catenin protein levels in HEL cells. Data are representative of two (e, g) or three (c, d) independent experiments. Uncropped blots are shown in Supplementary Figure 1.
Fig. 1
Fig. 1. Lenalidomide-induced changes in ubiquitination and protein levels
a, Log2 ratios for individual K-ε-GG sites of lenalidomide- (1 μM) versus DMSO-treated KG-1 cells for biological replicates 1 and 2. Each point represents a unique K-ε-GG site. Significantly regulated sites (p<0.05) are red. b, Log2 ratios of protein abundance for lenalidomide- (1 μM) versus DMSO-treated KG-1 cells for biological replicates 1 and 2. Each point represents a unique protein group. Significantly regulated proteins (p<0.05) are red. c, Effects of lenalidomide on endogenous CK1α protein levels in KG-1 cells after 24-hour treatment. Data are representative of 5 independent experiments (n=5). d, CSNK1A1 mRNA levels in KG-1 cells following lenalidomide treatment. Data are mean ± s.d., n=3 biological replicates.
Fig. 2
Fig. 2. Lenalidomide induces the ubiquitination of CK1α by CRL4CRBN
a, CK1α protein levels in KG-1 cells treated with DMSO or lenalidomide alone or in the presence of 10 μM MG132 or 1 μM MLN4924 for 6 hours. b, CK1α protein levels in CRBN knockout 293T cells treated with lenalidomide. c, Immunoprecipitation of FLAG-CRBN in 293T cells treated with DMSO or 1 μM lenalidomide in the presence of 1 μM MG132. d, Ubiquitination of endogenous CK1α in KG-1 cells treated with DMSO or lenalidomide analyzed by TUBE2 pull-down of ubiquitinated proteins followed by staining with a CK1α-specific antibody. Higher molecular weight bands represent ubiquitinated CK1α. e, Ubiquitination of CK1α by CRBN in vitro using lysine-free ubiquitin. Arrowheads indicate ubiquitinated CK1α. Results are representative of two (a, b, d, n=2) or three independent experiments (c, e, n=3). Uncropped blots shown in Supplementary Figure 1.
Fig. 3
Fig. 3. Ectopic CSNK1A1 overexpression reduces lenalidomide sensitivity in primary MDS del(5q) cells
CD34+ cells derived from patient or control bone marrow were transduced with a lentiviral vector overexpressing CSNK1A1 and GFP or an empty control vector and treated with DMSO or 1 μM lenalidomide. Results are reported as a ratio of the percentage of GFP+ cells in the lenalidomide condition to the percentage of GFP+ cells in the DMSO condition after 5 days of treatment. A ratio greater than 1 for the CSNK1A1 vector but not for the empty vector indicates that CSNK1A1 expression reduces lenalidomide sensitivity. Further information about the patients is given in Extended Data Fig. 5d.
Fig. 4
Fig. 4. Amino acid changes in CRBN explain species-specific lenalidomide effects
a, Effect of the expression of human CRBN (h), mouse Crbn (m), chimeras of human and mouse CRBN (m-h and h-m, breakpoint at residue 221 (human) / 225 (mouse)) and variants of the m-h chimera where single amino-acids in the C-terminus were mutated to their corresponding mouse residue on lenalidomide-dependent CK1α degradation in mouse Ba/F3 cells. b, Expression of mouse CrbnI391V restores lenalidomide-dependent CK1α degradation in mouse Ba/F3 cells. See also Extended Data Fig. 6d. c, Effect of hCRBN, mCrbn and mCrbnI391V on lenalidomide sensitivity of an IKZF1-luciferase fusion protein expressed in human 293T cells. Data are mean ± s.e.m. (n=3 biological replicates). d, Alignment of human and mouse CRBN IMiD binding region. Non-conserved amino acids are red. Amino acids involved in IMiD binding, are indicated by blue bars. Mouse W403 is indicated with a green bar. e, Superposition of the IMiD binding domains of human CRBN (blue, PDB accession 4TZ4) and mouse Crbn (yellow, PDB accession 4TZC). Residues are labeled according to human isoform 2 (blue numbers) and mouse isoform 2 (yellow numbers). f, The V387 residue is indicated on the surface of human CRBN with a black arrow. g, The corresponding mouse residue, I391, is indicated on the surface of mouse Crbn with a black arrow. Mouse W403 is indicated by a red arrow. Results are representative of 3 (a, b, c) independent experiments. Uncropped blots shown in Supplementary Figure 1.
Fig. 5
Fig. 5. Effects of lenalidomide treatment on Csnk1a1+/− mouse hematopoietic cells
a, Csnk1a1+/−Mx1Cre+ or Mx1Cre+ c-Kit+ hematopoietic stem and progenitor cells (CD45.2) and competitor cells (CD45.1) were transduced with mCrbnI391V, mixed in equal ratios, and treated with lenalidomide or DMSO. The relative percentage of CD45.1+ and CD45.2+ cells was followed by flow cytometry over 5 days. b, Effects of 0.1 μM lenalidomide on the chimerism of Csnk1a1+/− Mx1Cre+, Csnk1a1+/− Trp53+/− Mx1Cre+, Trp53+/− Mx1Cre+, or Mx1Cre+ cells (CD45.2) transduced with mCrbnI391V in comparison to CD45.1 competitor cells. Data are shown as mean ± s.e.m, n=3 biological replicates. c, Quantitative RT-PCR analysis of p21 expression in Csnk1a1+/− or control cells transduced with mCrbnI391V and treated with DMSO or lenalidomide. Data are normalized to DMSO and shown as mean ± s.d, n=3 biological replicates. d, Ratio of CD45.2+ cells and CD45.1+ cells in late apoptosis (Annexin V+ DAPI+) after transduction with mCrbnI391V and four day treatment with 0.1 μM lenalidomide. CD45.2+ cells are either Csnk1a1+/− Mx1Cre+ or Mx1Cre+. Data are normalized to DMSO treatment. Data are mean ± s.e.m, n=4 biological replicates. Results for b, c, and d are representative of three independent experiments with hCRBN or mCrbnI391V. P-values are from an unpaired two-sided t-test.
Fig. 6
Fig. 6. Substrate specificity of thalidomide analogues
a, Structures of thalidomide, lenalidomide, pomalidomide and CC-122. b, Protein levels of IKZF1 and CK1α assessed by tandem mass tag quantitative proteomics in MDS-L cells treated with DMSO, 10 μM lenalidomide, or 1 μM CC-122 for 24 hours (left panel) or 72 hours (right panel). n=3 (drug treatment) or n=4 (DMSO). c, Western blot analysis of CK1α and IKZF1 protein levels in MDS-L cells treated with DMSO or different concentrations of thalidomide, lenalidomide, pomalidomide, or CC-122. Results are representative of two independent experiments (n=2). d, KG-1 cells were treated with DMSO or lenalidomide in the absence or presence of different concentrations of CC-122. Results are representative of five independent experiments in various cell lines. e, Schematic presentation of the interaction of different thalidomide analogues with CRBN, substrates, and therapeutic indications.

Comment in

References

    1. Ito T, et al. Identification of a primary target of thalidomide teratogenicity. Science. 2010;327:1345–1350. - PubMed
    1. Krönke J, et al. Lenalidomide causes selective degradation of IKZF1 and IKZF3 in multiple myeloma cells. Science. 2014;343:301–305. - PMC - PubMed
    1. Lu G, et al. The myeloma drug lenalidomide promotes the cereblondependent destruction of Ikaros proteins. Science. 2014;343:305–309. - PMC - PubMed
    1. Gandhi AK, et al. Immunomodulatory agents lenalidomide and pomalidomide co-stimulate T cells by inducing degradation of T cell repressors Ikaros and Aiolos via modulation of the E3 ubiquitin ligase complex CRL4(CRBN.). Br J Haematol. 2014;164:811–821. - PMC - PubMed
    1. List A, et al. Lenalidomide in the myelodysplastic syndrome with chromosome 5q deletion. The New England journal of medicine. 2006;355:1456–1465. - PubMed

Publication types

MeSH terms