

Structure-Based Assignment of Ile, Leu, and Val Methyl Groups in the Active and Inactive Forms of the Mitogen-Activated Protein Kinase Extracellular Signal-Regulated Kinase 2
- PMID: 26132046
- PMCID: PMC4943881
- DOI: 10.1021/acs.biochem.5b00506
Structure-Based Assignment of Ile, Leu, and Val Methyl Groups in the Active and Inactive Forms of the Mitogen-Activated Protein Kinase Extracellular Signal-Regulated Kinase 2
Abstract
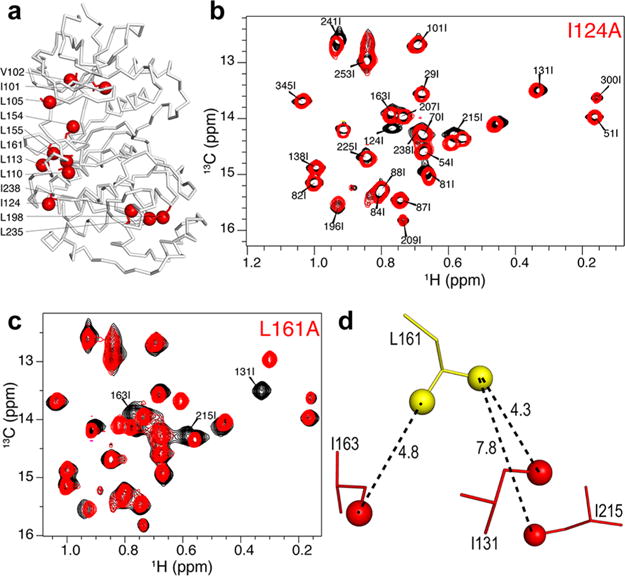
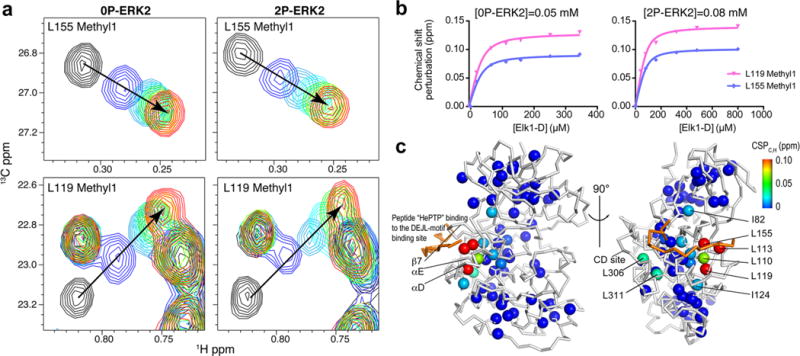
Resonance assignments are the first step in most NMR studies of protein structure, function, and dynamics. Standard protein assignment methods employ through-bond backbone experiments on uniformly (13)C/(15)N-labeled proteins. For larger proteins, this through-bond assignment procedure often breaks down due to rapid relaxation and spectral overlap. The challenges involved in studies of larger proteins led to efficient methods for (13)C labeling of side chain methyl groups, which have favorable relaxation properties and high signal-to-noise. These methyls are often still assigned by linking them to the previously assigned backbone, thus limiting the applications for larger proteins. Here, a structure-based procedure is described for assignment of (13)C(1)H3-labeled methyls by comparing distance information obtained from three-dimensional methyl-methyl nuclear Overhauser effect (NOE) spectroscopy with the X-ray structure. The Ile, Leu, or Val (ILV) methyl type is determined by through-bond experiments, and the methyl-methyl NOE data are analyzed in combination with the known structure. A hierarchical approach was employed that maps the largest observed "NOE-methyl cluster" onto the structure. The combination of identification of ILV methyl type with mapping of the NOE-methyl clusters greatly simplifies the assignment process. This method was applied to the inactive and active forms of the 42-kDa ILV (13)C(1)H3-methyl labeled extracellular signal-regulated kinase 2 (ERK2), leading to assignment of 60% of the methyls, including 90% of Ile residues. A series of ILV to Ala mutants were analyzed, which helped confirm the assignments. These assignments were used to probe the local and long-range effects of ligand binding to inactive and active ERK2.
Conflict of interest statement
The authors declare no competing financial interest.
Figures


Similar articles
-
Ile, Leu, and Val methyl assignments of the 723-residue malate synthase G using a new labeling strategy and novel NMR methods.J Am Chem Soc. 2003 Nov 12;125(45):13868-78. doi: 10.1021/ja030345s. J Am Chem Soc. 2003. PMID: 14599227
-
Alanine methyl groups as NMR probes of molecular structure and dynamics in high-molecular-weight proteins.J Am Chem Soc. 2010 Dec 29;132(51):18340-50. doi: 10.1021/ja1083656. Epub 2010 Dec 7. J Am Chem Soc. 2010. PMID: 21138300
-
A NMR experiment for simultaneous correlations of valine and leucine/isoleucine methyls with carbonyl chemical shifts in proteins.J Biomol NMR. 2014 Jan;58(1):1-8. doi: 10.1007/s10858-013-9803-1. Epub 2013 Dec 18. J Biomol NMR. 2014. PMID: 24346684 Free PMC article.
-
Phosphorylation releases constraints to domain motion in ERK2.Proc Natl Acad Sci U S A. 2014 Feb 18;111(7):2506-11. doi: 10.1073/pnas.1318899111. Epub 2014 Feb 3. Proc Natl Acad Sci U S A. 2014. PMID: 24550275 Free PMC article.
-
Practical aspects of NMR signal assignment in larger and challenging proteins.Prog Nucl Magn Reson Spectrosc. 2014 Apr;78:47-75. doi: 10.1016/j.pnmrs.2013.12.001. Epub 2013 Dec 15. Prog Nucl Magn Reson Spectrosc. 2014. PMID: 24534088 Free PMC article. Review.
Cited by
-
Automatic structure-based NMR methyl resonance assignment in large proteins.Nat Commun. 2019 Oct 29;10(1):4922. doi: 10.1038/s41467-019-12837-8. Nat Commun. 2019. PMID: 31664028 Free PMC article.
-
Conformation selection by ATP-competitive inhibitors and allosteric communication in ERK2.Elife. 2024 Mar 27;12:RP91507. doi: 10.7554/eLife.91507. Elife. 2024. PMID: 38537148 Free PMC article.
-
Modulating multi-functional ERK complexes by covalent targeting of a recruitment site in vivo.Nat Commun. 2019 Nov 19;10(1):5232. doi: 10.1038/s41467-019-12996-8. Nat Commun. 2019. PMID: 31745079 Free PMC article.
-
NMR assignments of sparsely labeled proteins using a genetic algorithm.J Biomol NMR. 2017 Apr;67(4):283-294. doi: 10.1007/s10858-017-0101-1. Epub 2017 Mar 13. J Biomol NMR. 2017. PMID: 28289927 Free PMC article.
-
Conformation Selection by ATP-competitive Inhibitors and Allosteric Communication in ERK2.bioRxiv [Preprint]. 2023 Nov 6:2023.09.12.557258. doi: 10.1101/2023.09.12.557258. bioRxiv. 2023. Update in: Elife. 2024 Mar 27;12:RP91507. doi: 10.7554/eLife.91507. PMID: 37745518 Free PMC article. Updated. Preprint.
References
-
- Ruschak AM, Kay LE. Methyl groups as probes of supra-molecular structure, dynamics and function. J Biomol NMR. 2010;46:75–87. - PubMed
-
- Ollerenshaw JE, Tugarinov V, Kay LE. Methyl TROSY: explanation and experimental verification. Magn Reson Chem. 2003;41:843–852.
-
- Plevin MJ, Boisbouvier J. Isotope-Labelling of Methyl Groups for NMR Studies of Large Proteins. In: Clore M, Potts J, editors. Recent Developments in Biomolecular NMR. Royal Society of Chemistry; London: 2012. pp. 1–24.
-
- Tzeng SR, Kalodimos CG. Protein dynamics and allostery: an NMR view. Curr Opin Struct Biol. 2011;21:62–67. - PubMed
-
- Rosenzweig R, Kay LE. Bringing dynamic molecular machines into focus by methyl-TROSY NMR. Annu Rev Biochem. 2014;83:291–315. - PubMed
Publication types
MeSH terms
Substances
Grants and funding
LinkOut - more resources
Full Text Sources
Other Literature Sources
Miscellaneous
