Review
. 2015 Jun 26;5(3):367-97.
doi: 10.3390/bios5030367.

Use of Time-Resolved Fluorescence to Monitor Bioactive Compounds in Plant Based Foodstuffs

Affiliations
Review

Use of Time-Resolved Fluorescence to Monitor Bioactive Compounds in Plant Based Foodstuffs

M Adília Lemos et al. Biosensors (Basel). .

Abstract

The study of compounds that exhibit antioxidant activity has recently received much interest in the food industry because of their potential health benefits. Most of these compounds are plant based, such as polyphenolics and carotenoids, and there is a need to monitor them from the field through processing and into the body. Ideally, a monitoring technique should be non-invasive with the potential for remote capabilities. The application of the phenomenon of fluorescence has proved to be well suited, as many plant associated compounds exhibit fluorescence. The photophysical behaviour of fluorescent molecules is also highly dependent on their microenvironment, making them suitable probes to monitor changes in pH, viscosity and polarity, for example. Time-resolved fluorescence techniques have recently come to the fore, as they offer the ability to obtain more information, coupled with the fact that the fluorescence lifetime is an absolute measure, while steady state just provides relative and average information. In this work, we will present illustrative time-resolved measurements, rather than a comprehensive review, to show the potential of time-resolved fluorescence applied to the study of bioactive substances. The aim is to help assess if any changes occur in their form, going from extraction via storage and cooking to the interaction with serum albumin, a principal blood transport protein.

Keywords: anthocyanin; betalain; chlorophyll; curcumin; fluorescence lifetime; lycopene.


Figures
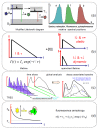
Figure 1
Figure 1
Graphical depiction of time-resolved measurement methods and an indication of the information obtainable. (a) A modified Jablonski diagram, plus a relative indication of the wavelength positions of the absorption, fluorescence and phosphorescence spectra; (b) Representation of a decay (log intensity scale) and variation of lifetime (τ, indicated by gradient of decay) and intensity (I) on addition of a quencher ([Q]); (c) Time-resolved emission spectra (TRES) illustrating time slicing at two points and production of decay associated spectra; (d) Representation of fluorescence anisotropy, which can provide the initial anisotropy (r0), the limiting anisotropy (r) and the rotational correlation time (τR).
Scheme 1
Scheme 1
Principal compounds that will be addressed here, showing their [origin] and main (sub type) along with the APPLICATION area in this work.
Figure 2
Figure 2
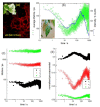
(a) Microscopy image, via filters of chloroplast emission from a leaf (Hedera—inset); (b) outcome of a kinetic TCSPC measurement showing both the variation of fluorescence intensity and average lifetime for a whole leaf (Ficus—inset). The excitation was at 478 nm and the emission was selected using a filter for large spectral coverage. Three exponential analysis of the kinetic TCSPC measurement, showing (c) the lifetime values and (d) their normalised pre-exponential contribution. Adapted from [45].
Figure 3
Figure 3
TRES measurement performed on a whole leaf (Ficus), showing (a) time-resolved emission spectra; (b) change in peak ratio of the principal emission bands with time after excitation and (c) decay associated spectra obtained via a global analysis of the TRES dataset. Adapted from [45].
Figure 4
Figure 4
Fluorescence excitation-emission spectra (EEM’s) for the samples, showing excitation wavelength (y-axis) emission wavelength (x-axis) and the intensity as rainbow scale (red—high, blue—low). The lycopene EEM (LYC) has also been scaled (LYC zoom) to show the lower intensity emission at ~550 nm. The scattering positions relating to Rayleigh, Raman and second order are also indicated. Adapted from [48].
Figure 5
Figure 5
Results of TRES measurements, showing (a) the equivalent steady state spectra and the decay associated spectra for (b) the untreated extract and (c) extract treated for 1 h. Excitation was at 378 nm. Adapted from [48].
Figure 6
Figure 6
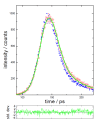
Representation of the decay of lycopene in hexane (red), also showing the IRF (of 36 ps—blue), fitted function (2 exponential green) and weighted residuals (green), close to the peak of the decay. The excitation wavelength was 409 nm (DD-405L) and the emission at 550 nm. Adapted from [48].
Figure 7
Figure 7
(a) absorption spectrum for a freshly made solution of the sample stored for 41 days in (50:50, v:v) methanol: water; (b) effect of laser irradiation during the time-resolved measurements, either at 531 nm or 478 nm on the same sample.
Figure 8
Figure 8
Time-resolved decays for the beetroot samples stored for different times; (a) using 478 nm excitation; (b) with 531 nm excitation. The IRF in both cases is also shown (FWHM of 77 ps at 478 nm and 52 ps at 531 nm).
Scheme 2
Scheme 2
Relationship between the different anthocyanin (AH+, A, B, Ccis, Ctrans) forms adapted from [100] and [colour] indications from [99].
Figure 9
Figure 9
Fluorescence camera intensity images with white light illumination of a free hand slice of raw (a,b) and microwaved (c,d) Purple Majesty; (a,c) taken using a beam splitter, (b) R,B,G composite picture; (d) using blue filter cube. The bar (given in (a)) represents ca. 200 μm. Adapted from [47].
Figure 10
Figure 10
Change in bioactive content in purple potato, relative to uncooked, seen using different cooking methods. TP—total phenolic compounds, TA—total anthocyanins and AOA—antioxidant activity. Adapted from [46].
Figure 11
Figure 11
(a) TRES “time slices” measured from a sample of baked potato. The intensities are shown normalised. Excitation was at 510 nm (DD-510L); (b) Comparison of longer wavelength emission [46] with relative (to uncooked) quantity of TA. Adapted from [46].
Figure 12
Figure 12
Binding of turmeric extract with serum albumin; (a) outcome of a two exponential analysis from a kinetic TSCPC dataset. 10,000 decay histograms were collected, each with an acquisition time of 10 ms; (b) representative decay histograms at different times at the beginning of the binding process. Adapted from [44].

References

    1. Ignat I., Volf I., Popa V.I. A critical review of methods for characterisation of polyphenolic compounds in fruits and vegetables. Food Chem. 2011;126:1821–1835. doi: 10.1016/j.foodchem.2010.12.026. - DOI - PubMed
    1. Thompson M.D., Thompson H.J., McGinley J.N., Neil E.S., Rush D.K., Holm D.G., Stushnoff C. Functional food characteristics of potato cultivars (Solanum tuberosum L.). Phytochemical composition and inhibition of 1-methyl-1-nitrosourea induced breast cancer in rats. J. Food Comp. Anal. 2009;22:571–576. doi: 10.1016/j.jfca.2008.09.002. - DOI
    1. Dziri S., Hassen I., Fatnassi S., Mrabet Y., Casabianca H., Hanchi B., Hosni K. Phenolic constituents, antioxidant and antimicrobial activities of rosy garlic (Allium roseum var. odoratissimum) J. Funct. Foods. 2012;4:423–432. doi: 10.1016/j.jff.2012.01.010. - DOI
    1. Sancho R.A.S., Pastore G.M. Evaluation of the effects of anthocyanins in type 2 diabetes. Rev. Food Res. Int. 2012;46:378–386. doi: 10.1016/j.foodres.2011.11.021. - DOI
    1. Negi P.S., Namitha K.K. Chemistry and biotechnology of carotenoids. Crit. Rev. Food Sci. Nutr. 2010;50:728–760. - PubMed

MeSH terms

LinkOut - more resources