. 2015 Jul 1;11(7):e1005291.
doi: 10.1371/journal.pgen.1005291. eCollection 2015 Jul.

mTOR Directs Breast Morphogenesis through the PKC-alpha-Rac1 Signaling Axis

Affiliations

mTOR Directs Breast Morphogenesis through the PKC-alpha-Rac1 Signaling Axis

Meghan M Morrison et al. PLoS Genet. .

Abstract

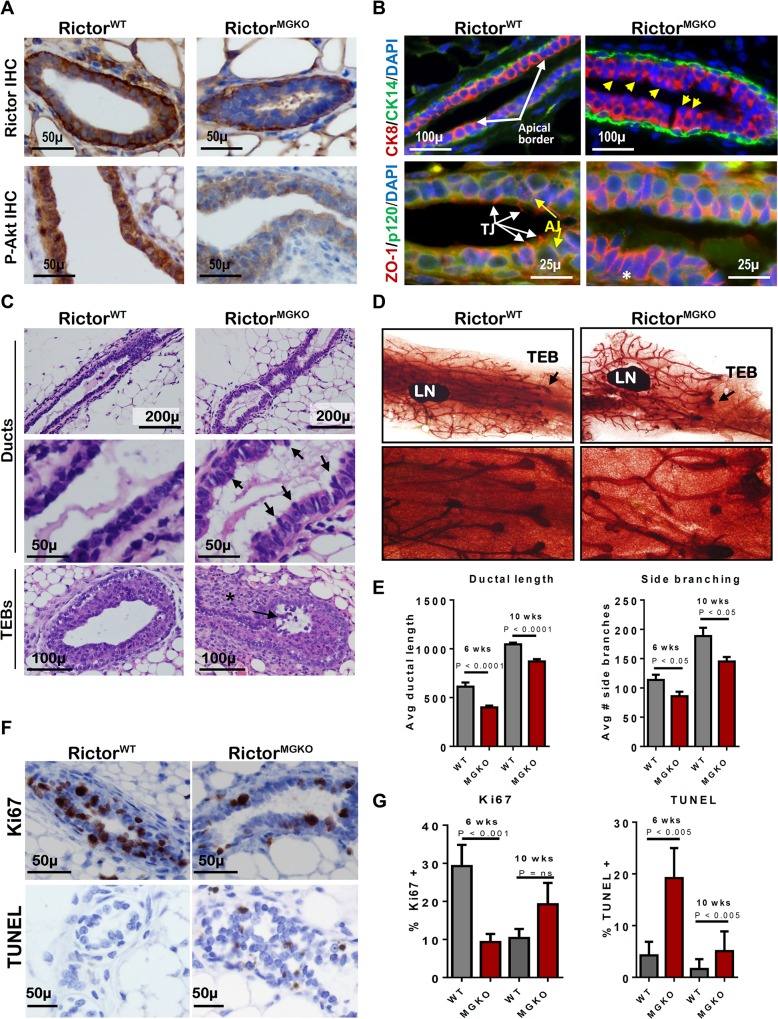
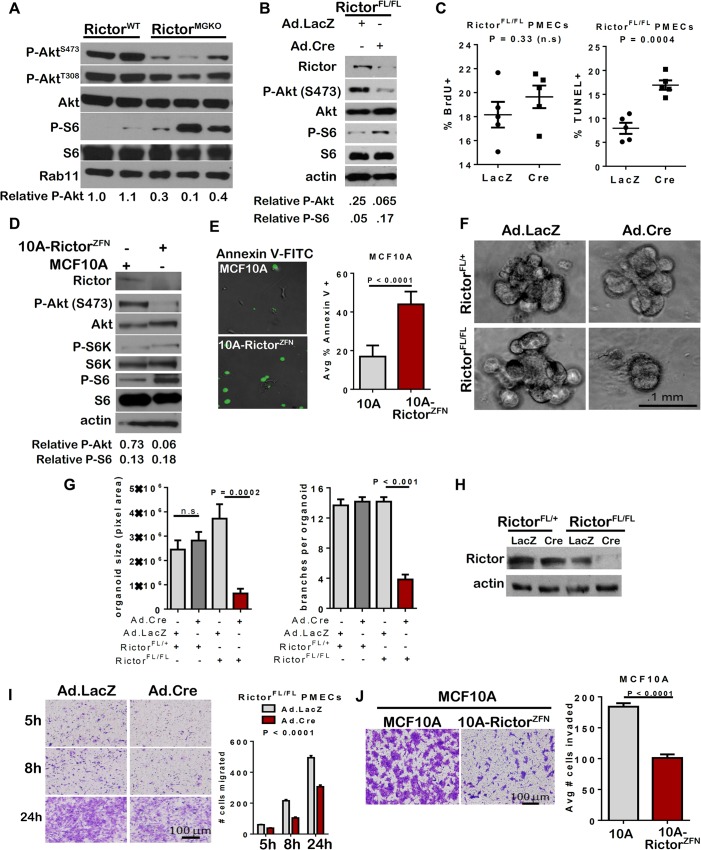
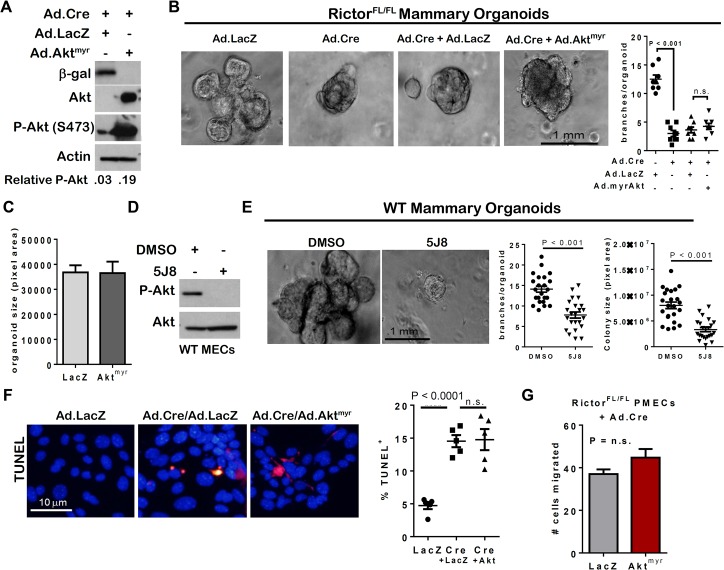
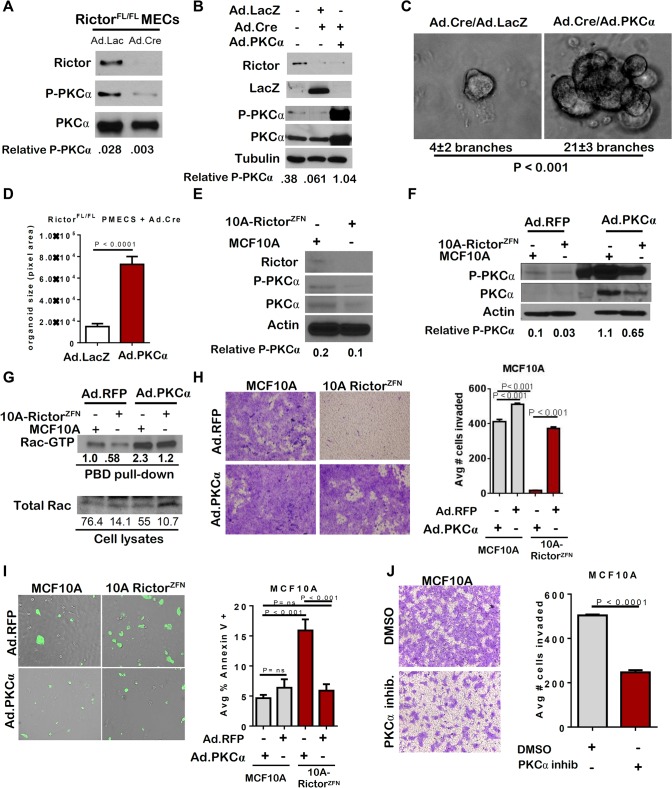
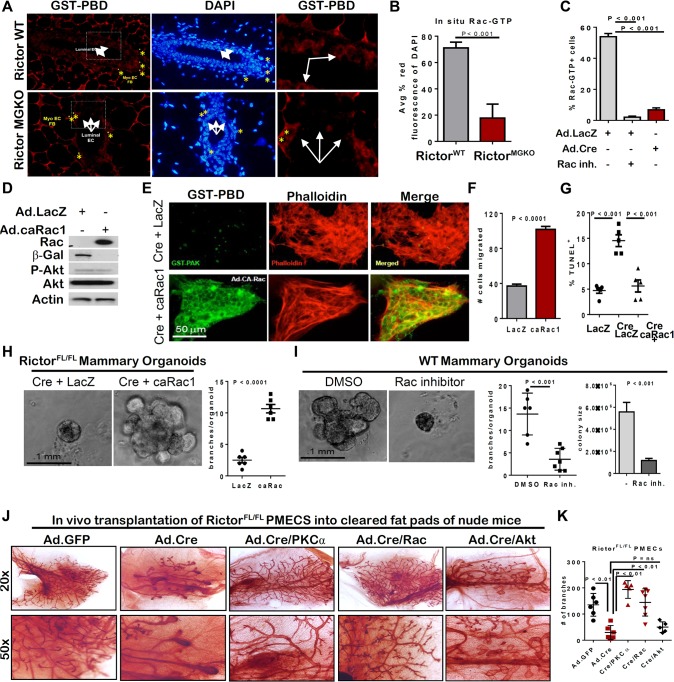
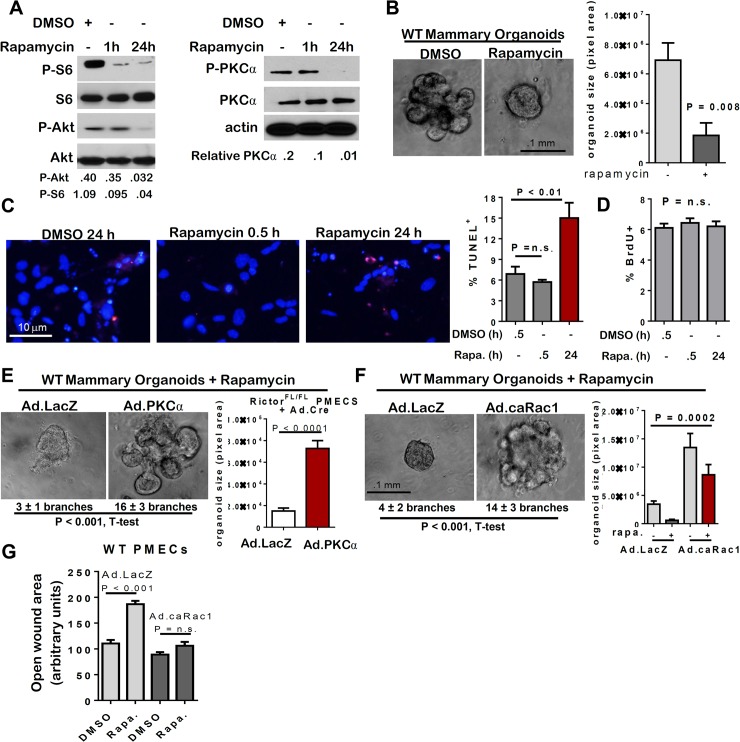
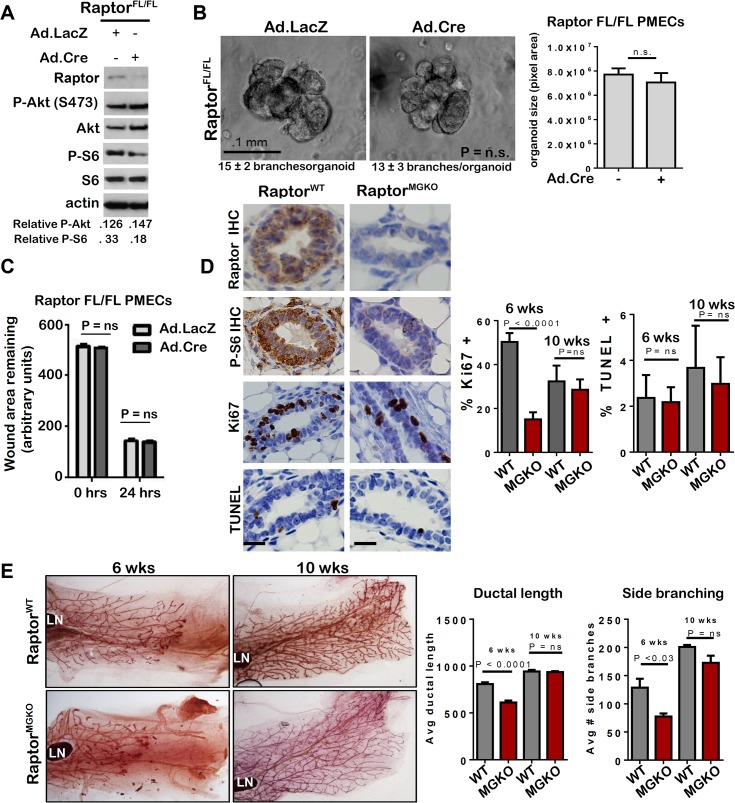
Akt phosphorylation is a major driver of cell survival, motility, and proliferation in development and disease, causing increased interest in upstream regulators of Akt like mTOR complex 2 (mTORC2). We used genetic disruption of Rictor to impair mTORC2 activity in mouse mammary epithelia, which decreased Akt phosphorylation, ductal length, secondary branching, cell motility, and cell survival. These effects were recapitulated with a pharmacological dual inhibitor of mTORC1/mTORC2, but not upon genetic disruption of mTORC1 function via Raptor deletion. Surprisingly, Akt re-activation was not sufficient to rescue cell survival or invasion, and modestly increased branching of mTORC2-impaired mammary epithelial cells (MECs) in culture and in vivo. However, another mTORC2 substrate, protein kinase C (PKC)-alpha, fully rescued mTORC2-impaired MEC branching, invasion, and survival, as well as branching morphogenesis in vivo. PKC-alpha-mediated signaling through the small GTPase Rac1 was necessary for mTORC2-dependent mammary epithelial development during puberty, revealing a novel role for Rictor/mTORC2 in MEC survival and motility during branching morphogenesis through a PKC-alpha/Rac1-dependent mechanism.


Conflict of interest statement

The authors have declared that no competing interests exist.

Figures

Fig 1
Fig 1. Loss of Rictor disrupts mammary branching morphogenesis in vivo.
A. IHC for Rictor (upper panels) and P-Akt S473 (lower panels) in mammary gland sections from 6 week-old virgin mice. B. IF for CK8, CK14, ZO-1 and P120 in mammary gland sections. Yellow arrows indicate apically mis-localized nuclei in RictorMGKO tissue in upper right panel. White arrows indicate tight junctions (TJ) and yellow arrows indicate adherens junctions (AJ) in lower left panel. C. Hematoxylin and eosin (H&E)-stained mammary sections. Black arrows indicate irregular apical border in middle right panel. Black arrow indicates body cells sloughing in the TEB lumen and (*) indicates stromal thickening at the neck between maturing duct and TEB. D. Whole mount hematoxylin-stained mammary glands from 6-week virgin mice; lymph nodes (LN); terminal end buds (TEBs, arrows). E. Average ductal length (microns) beyond the mammary lymph node (left) and average number of side branches (right), ± S.D. F. IHC for Ki67 (upper panels) and TUNEL (lower panels) in mammary glands from 6-week old mice. Representative images are shown. G. Average percent Ki67+ nuclei (left) or TUNEL+ nuclei (right) per total MEC nuclei, ± S.D. N = 10 mice for each genotype/time point, Student’s T-test.
Fig 2
Fig 2. Impaired survival and morphogenesis of mammary epithelial structures upon loss of Rictor ex vivo.
A. Western analysis of whole mammary lysates harvested from 10-week old female mice. B-C. Rictor FL/FL PMECs were infected with Ad.Cre or Ad.LacZ and cultured 7 days. B. Western analysis of PMEC lysates under serum starved conditions. Quantitation was performed using Image J software and numbers represent P-Akt or P-S6 bands normalized to total Akt or S6 levels. C. BrdU+ (left) and TUNEL+ (right) nuclei relative to total nuclei were quantified. N = 5 epithelial isolates, each analyzed in triplicate. Midline values indicate average, whiskers indicate S.D., Student’s T-test. D-E. MCF10A and MCF10A-RictorZFN cells were analyzed. D. Western analysis of MCF10A lysates. E. Cells were labeled with Annexin V-FITC for 6 hours then photographed. Percent Annexin V+ cells versus total was quantified, average ± S.D. shown. N = 3 independent experiments, each analyzed in quadruplicate, representative images shown, Student’s T-test. F-I. Rictor FL/FL PMECs and organoids were infected with Ad.Cre or Ad.LacZ. F. Organoids photographed after 10 days in Matrigel culture. Representative images are shown. G. Average organoid size, measured in pixel area using Image J software, ± S.D. (left panel) and average number of branches/organoid ± S.D. (right panel) are shown. N = 6 independent organoid isolates, analyzed in triplicate, Student’s T-test. H. Western analysis of PMEC lysates. I. Transwell invasion of adenovirus-infected Rictor FL/FL PMECs in response to serum. Cells migrating to the opposite side of the transwell filter were visualized with crystal violet and counted. N = 6 PMEC isolates/condition, one-way ANOVA. J. Transwell invasion of MCF10A and MCF10A-RictorZFN cells in response to serum is shown as average number of invading cells ± S.D. N = 3, independent experiments, each analyzed in triplicate, Student’s T-test.
Fig 3
Fig 3. Akt activation is insufficient to rescue Rictor-deficient MEC survival, branch formation and invasion.
A-C. PMECs and organoids from Rictor FL/FL mice were co-infected with Ad.Cre and either Ad.LacZ or Ad.Aktmyr. A. Western analysis of PMEC lysates. B. Organoids photographed after 10 days in Matrigel culture. Average number of branches/organoid ± S.D. (right panel) are shown. N = 20 independent organoids from 5 independent mice. Midline values indicate average (data points = averages from individual experiments), whiskers indicate S.D., Student’s T-test. C. Colony size of organoids measured in pixel area. N = 20 independent organoids from 5 independent mice, average ± S.D., Student’s T-test. D-E. PMECs and organoids from WT mice treated 3–7 days with 5J8 Akt inhibitor or DMSO. D. Western analysis of PMECs after 3 days treatment with 5J8. E. Organoids photographed after 10 days in DMSO or 5J8. Average number of branches/organoid ± S.D. (left panel) are shown. Midline values indicate average (data points = averages from individual experiments), whiskers indicate S.D., Student’s T-test. Organoid size measured in pixel area shown in right panel Student’s T-test. N = 23 independent organoids from 6 independent mice. F-G. PMECs from Rictor FL/FL mice were co-infected with Ad.Cre and either Ad.LacZ or Ad.Aktmyr. F. PMECs were assessed by TUNEL analysis. Representative images are shown. Average percent TUNEL+ nuclei (red) per total nuclei (DAPI, blue) was calculated. Individual cell isolates (N = 5, analyzed in duplicate) are represented by each data point. Midlines values are average percentage of TUNEL+ nuclei ±S.D., indicated by whiskers, Student’s T-test. G. PMECs migrating to the opposite side of Matrigel-coated transwell filters were visualized with crystal violet and counted. N = 6 independent cell isolates per condition, analyzed in duplicate, Student’s T-test.
Fig 4
Fig 4. Loss of PKC-alpha-mediated Rac activation in the absence of Rictor.
A-D. Rictor FL/FL PMECs and organoids were infected with the indicated adenoviruses. A-B. Western analysis of PMEC lysates. Quantitation was performed using Image J software and numbers represent P-PKC-alpha bands normalized to total PKC-alpha levels. C. Organoids photographed after 10 days in Matrigel culture. Average number of branches/organoid ±S.D. indicated below panels. N = 3 independent organoid isolates/condition analyzed in triplicate, Student’s T-test. D. Average colony size of organoids measured in pixel area ± S.D. N = 3 independent organoid isolates/condition, analyzed in triplicate, Student’s T-test. E. Western analysis of MCF10A parental and RictorZFN lysates. Quantitation was performed using Image J software and numbers represent P-PKC-alpha band normalized to actin for each sample. F-I. MCF10A parental and RictorZFN cells were infected with Ad.RFP or Ad.PKC-alpha. F. Western analysis of MCF10A parental and RictorZFN lysates, 48 hours post-infection. Quantitation was performed using Image J software and numbers represent P-PKC-alpha band normalized to actin for each sample. G. GST-Pak-PBD effector pull-downs followed by western analysis for Rac performed 48 hours post-infection. Quantitation was performed using Image J software. Numbers in upper panel represent Rac-GTP levels in MCF10A-RictorZFN compared to MCF10A parental control. Lower numbers represent Rac-GTP levels normalized to total Rac for each sample. H. Cells were assessed for invasion through Matrigel-coated transwell filters. Cells were stained with crystal violet after 24 hours, and then imaged. Number of cells invading was quantitated in Image J. Values shown represent the average ± S.D., Student’s T-test. N = 2 independent experiments, analyzed in triplicate. I. Cells were assessed for Annexin V-FITC. Number of Annexin V-FITC+ per total number of cells was quantitated in Image J, Student’s T-test. N = 2 independent experiments, analyzed in triplicate. J. MCF10A parental cells were assessed for invasion through Matrigel-coated transwell filters in the presence of PKC-alpha inhibitor GO6976. Cells were stained with crystal violet after 24 hours, and then imaged. Number of cells invading was quantitated in Image J. Values shown represent the average ± S.D., Student’s T-test. N = 2 independent experiments, analyzed in quadruplicate.
Fig 5
Fig 5. Rictor-mediated Rac activity is necessary and sufficient for mammary branching morphogenesis ex vivo.
A. In situ detection of GTP-bound Rac via IF detection of GST-PBD (red; nuclei stained with DAPI, blue) on mammary gland sections from 6-week old mice. N = 6 independent fields analyzed in sections from 3 independent mammary gland sections/genotype. B. Quantitation of average percent red fluorescence (Rac-GTP) relative to blue (DAPI) on mammary gland sections from 6 week old virgin Rictor WT and Rictor MGKO mice, ± S.D., Student’s T-test. C. Cells were probed with GST-PBD (red) and counterstained with DAPI (blue). GST alone (not conjugated to PBD) was used as a negative control. GST-PBD+ fraction of total PMECs was counted and average ± S.D. shown. N = 15 fields/condition, Student’s T-test. D-I Rictor FL/FL PMECs infected with Ad.Cre or Ad.LacZ (±Ad.caRac1) and analyzed. D. Western analysis of PMEC lysates. E. Cells were probed with GST-PBD (green) and counterstained with phalloidin (red). F. Transwell invasion assays were performed. Invading cells were visualized with crystal violet and counted ±S.D. N = 6 independent isolates, analyzed in duplicate, Student’s T-test. G. PMECs were assessed by TUNEL analysis. N = 3 independent cell isolates, analyzed in duplicate. Representative images shown. Average percent TUNEL+ nuclei per total epithelial nuclei quantified. Midline values indicate average, whiskers indicate S.D., Student’s T-test. H. Rictor FL/FL organoids were infected Ad.Cre or Ad.LacZ (±Ad.caRac1) prior to embedding, and were photographed after 10 days in Matrigel culture. Right panel shows average number of branches per organoid. Each data point is the average branches per colony from individual isolates, analyzed in triplicate. Midlines are the average of all isolates, whiskers indicate S.D., Student’s T-test. N = 6. I. WT organoids were cultured ±Rac inhibitor for 10 days. Number of branches per organoid quantified. Each data point is the average branches per colony from individual isolates, analyzed in triplicate. Midline values indicate average, whiskers indicate S.D., Student’s T-test. Student’s T-test. Right panel shows average organoid size ±S.D. J-K. PMECs from Rictor FL/FL mice were tranduced with control Ad.GFP versus Ad.Cre in the presence or absence of Ad.PKC-alpha, Ad.caRac, or Ad.Aktmyr. PMECs were transplanted into the cleared inguinal fat pads of 4 week old recipient female mice. Mammary glands were harvested six weeks post-transplantation and epithelial architecture and branching morphogenesis in whole-mount preparations was assessed. J. Whole-mount preparations from indicated transplanted glands. K. Quantitation of average number of branches ± S.D., Student’s T-test. Representative images shown from N = 2 independent experiments.
Fig 6
Fig 6. mTOR inhibition with rapamycin decreases MEC survival and branching.
A-G. WT PMECs and organoids were cultured in DMSO vehicle or rapamycin. PMECs were cultured 0, 0.5, or 24 hours. Organoids were cultured 10 days in Matrigel in the presence of DMSO or rapamycin. A. Western analysis of PMEC lysates. Quantitation was performed using Image J software and numbers represent P-Akt, P-S6, or P-PKC-alpha bands normalized to total Akt, S6, or PKC-alpha levels. B. WT organoids photographed after 10 days in Matrigel culture. Average organoid size scored as average pixel area ± S.D., Student’s T-test, N = 6 epithelial isolates, each analyzed in triplicate. C. TUNEL analysis of PMECs. Average percent TUNEL+ nuclei per total PMEC nuclei ± S.D. is shown, Student’s T-test. N = 3 independent cell isolates, analyzed in duplicate. D. PMECs were labeled with BrdU after initial pre-treatments with rapamycin for 0.5 hours or 24 hours. Average percent BrdU+ nuclei per total nuclei ± S.D. is shown, One-way ANOVA, N = 3 independent cell isolates, analyzed in triplicate. E-F. Organoids were infected with Ad.LacZ or Ad.PKC-alpha (panel E) or Ad.caRac1 (panel F) prior to embedding in Matrigel plus rapamycin or DMSO. Average number of branches/colony is shown below each image. Average organoid size scored as average pixel area ± S.D., Student’s T-test (E) and one way ANOVA (F), N = 6 epithelial isolates, each analyzed in triplicate. G. Confluent PMEC monolayers were scratch-wounded, cultured in rapamycin or DMSO, and imaged at 24 hours. Total wounded area remaining after 24 hours was measured. Values shown are the average wound area remaining ± S.D. N = 3 independent cell isolates, analyzed in triplicate.
Fig 7
Fig 7. Unlike mTORC2, mTORC1 is dispensable for MEC survival and branching morphogenesis.
A-C. Raptor FL/FL PMECs and organoids were infected with Ad.Cre and Ad.LacZ, and cultured 10 days. A. Western analysis of PMECs cultured in the absence of serum. Quantitation was performed using Image J software and numbers represent P-Akt or P-S6 bands normalized to total Akt or S6 levels. B. Organoids were infected with Ad.Cre or Ad.LacZ photographed after 10 days in Matrigel culture. Representative images are shown. Average number of branches/organoid for each group is shown below the image. Average organoid size (pixels) ± S.D. is shown, Student’s T-test. N = 6 independent organoid isolates, analyzed in triplicate. C. PMECs from Raptor Fl/FL mice were infected with Ad.LacZ or Ad.Cre, grown to confluence and scratch-wounded. Monolayers were imaged. Total wound area remaining was measured 24 hours after wounding. Values shown are the avg ± S.D. N = 6 per time point, Student’s T-test. D-E. Mammary glands from virgin female RaptorWT and RaptorMGKO at 6 and 10 weeks of age were analyzed. N = 10 mice per genotype at each time point. Statistical analysis performed with Student’s T-test. D. IHC for Raptor, P-S6, Ki67+, and TUNEL+ nuclei in mammary glands of 6-week old mice. Representative images are shown. Scale bars = 50 microns. Average percent Ki67+ nuclei and TUNEL+ nuclei (± S.D) per total epithelial nuclei was determined E. Whole mount hematoxylin staining of mammary glands. Representative images are shown. LN = lymph node. The ductal length beyond the mammary lymph node was measured in whole mounted mammary glands. Average length (in microns) ± S.D. is shown. The number of T-shaped side branches was enumerated in whole mounted mammary glands. Values shown represent average number of side branches ± S.D.

References

    1. Gjorevski N. and Nelson C.M., Integrated morphodynamic signalling of the mammary gland. Nat Rev Mol Cell Biol, 2011. 12(9): p. 581–93. 10.1038/nrm3168 - DOI - PubMed
    1. McNally S. and Martin F., Molecular regulators of pubertal mammary gland development. Ann Med, 2011. 43(3): p. 212–34. 10.3109/07853890.2011.554425 - DOI - PubMed
    1. Laplante M. and Sabatini D.M., mTOR signaling in growth control and disease. Cell, 2012. 149(2): p. 274–93. 10.1016/j.cell.2012.03.017 - DOI - PMC - PubMed
    1. Phung T.L., et al., Pathological angiogenesis is induced by sustained Akt signaling and inhibited by rapamycin. Cancer Cell, 2006. 10(2): p. 159–70. - PMC - PubMed
    1. Sarbassov D.D., et al., Prolonged rapamycin treatment inhibits mTORC2 assembly and Akt/PKB. Mol Cell, 2006. 22(2): p. 159–68. - PubMed

Publication types

MeSH terms

Substances