A multiparental cross population for mapping QTL for agronomic traits in durum wheat (Triticum turgidum ssp. durum)
- PMID: 26132599
- PMCID: PMC11388855
- DOI: 10.1111/pbi.12424
A multiparental cross population for mapping QTL for agronomic traits in durum wheat (Triticum turgidum ssp. durum)
Abstract
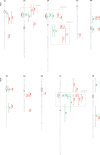
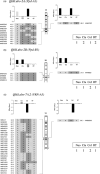
Multiparental cross designs for mapping quantitative trait loci (QTL) provide an efficient alternative to biparental populations because of their broader genetic basis and potentially higher mapping resolution. We describe the development and deployment of a recombinant inbred line (RIL) population in durum wheat (Triticum turgidum ssp. durum) obtained by crossing four elite cultivars. A linkage map spanning 2664 cM and including 7594 single nucleotide polymorphisms (SNPs) was produced by genotyping 338 RILs. QTL analysis was carried out by both interval mapping on founder haplotype probabilities and SNP bi-allelic tests for heading date and maturity date, plant height and grain yield from four field experiments. Sixteen QTL were identified across environments and detection methods, including two yield QTL on chromosomes 2BL and 7AS, with the former mapped independently from the photoperiod response gene Ppd-B1, while the latter overlapped with the vernalization locus VRN-A3. Additionally, 21 QTL with environment-specific effects were found. Our results indicated a prevalence of environment-specific QTL with relatively small effect on the control of grain yield. For all traits, functionally different QTL alleles in terms of direction and size of genetic effect were distributed among parents. We showed that QTL results based on founder haplotypes closely matched functional alleles at known heading date loci. Despite the four founders, only 2.1 different functional haplotypes were estimated per QTL, on average. This durum wheat population provides a mapping resource for detailed genetic dissection of agronomic traits in an elite background typical of breeding programmes.
Keywords: QTL; SNP; Triticum turgidum; agronomic traits; founder haplotypes; multiparental cross.
© 2015 Society for Experimental Biology, Association of Applied Biologists and John Wiley & Sons Ltd.
Conflict of interest statement
The authors have no conflict of interest to declare.
Figures


References
-
- Bandillo, N. , Raghavan, C. , Muyco, P.A. , Sevilla, M.A.L. , Lobina, I.T. , Dilla‐Ermita, C.J. , Tung, C. , McCouch, S. , Thomson, M. , Mauleon, R. , Singh, R.K. , Gregorio, G. , Redoña, E. and Leung, H. (2013) Multi‐parent advanced generation inter‐cross (MAGIC) populations in rice: progress and potential for genetics research and breeding. Rice, 6, 11. - PMC - PubMed
-
- Barrett, J.C. , Fry, B. , Maller, J. and Daly, M.J. (2005) Haploview: analysis and visualization of LD and haplotype maps. Bioinformatics, 21, 263–265. - PubMed
-
- Bradbury, P.J. , Zhang, Z. , Kroon, D.E. , Casstevens, T.M. , Ramdoss, Y. and Buckler, E.S. (2007) TASSEL: software for association mapping of complex traits in diverse samples. Bioinformatics, 23, 2633–2635. - PubMed
-
- Broman, K.W. , Wu, H. , Sen, S. and Churchill, G.A. (2003) R/qtl: QTL mapping in experimental crosses. Bioinformatics, 19, 889–890. - PubMed
Publication types
MeSH terms
Substances
LinkOut - more resources
Full Text Sources

