. 2016 Jan 20;24(3):157-70.
doi: 10.1089/ars.2014.6120. Epub 2015 Sep 16.

AMPK Phosphorylation Modulates Pain by Activation of NLRP3 Inflammasome

Affiliations

AMPK Phosphorylation Modulates Pain by Activation of NLRP3 Inflammasome

Pedro Bullón et al. Antioxid Redox Signal. .

Abstract

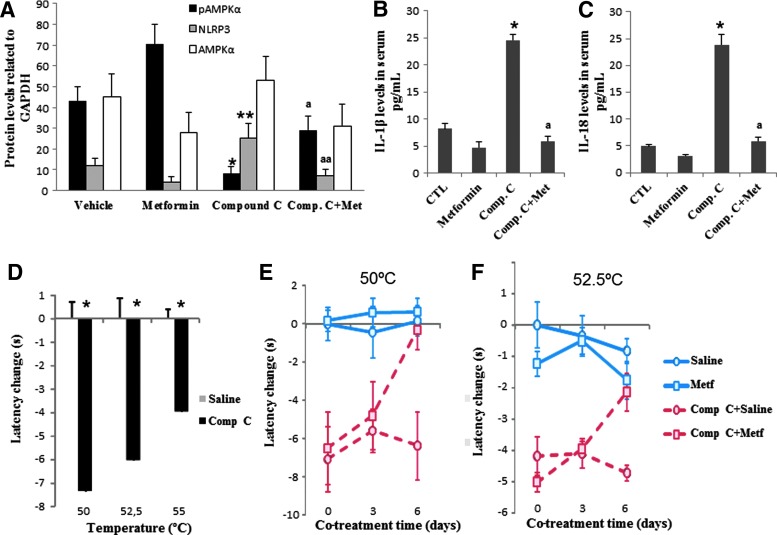
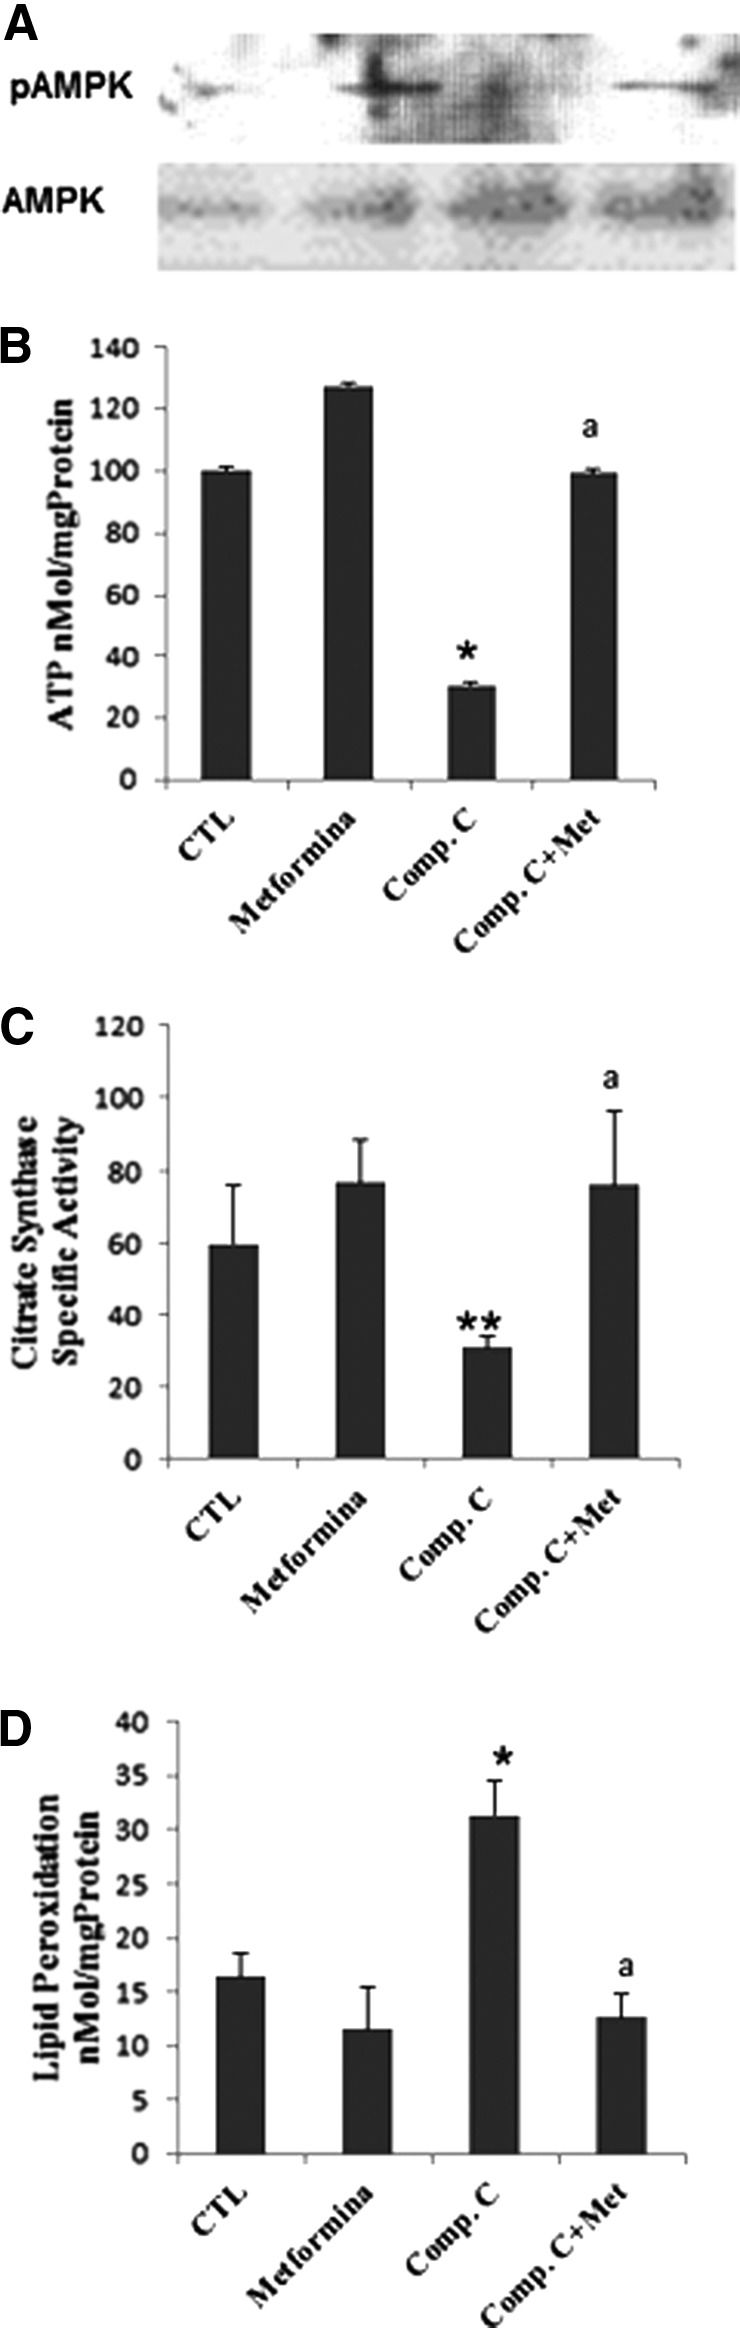
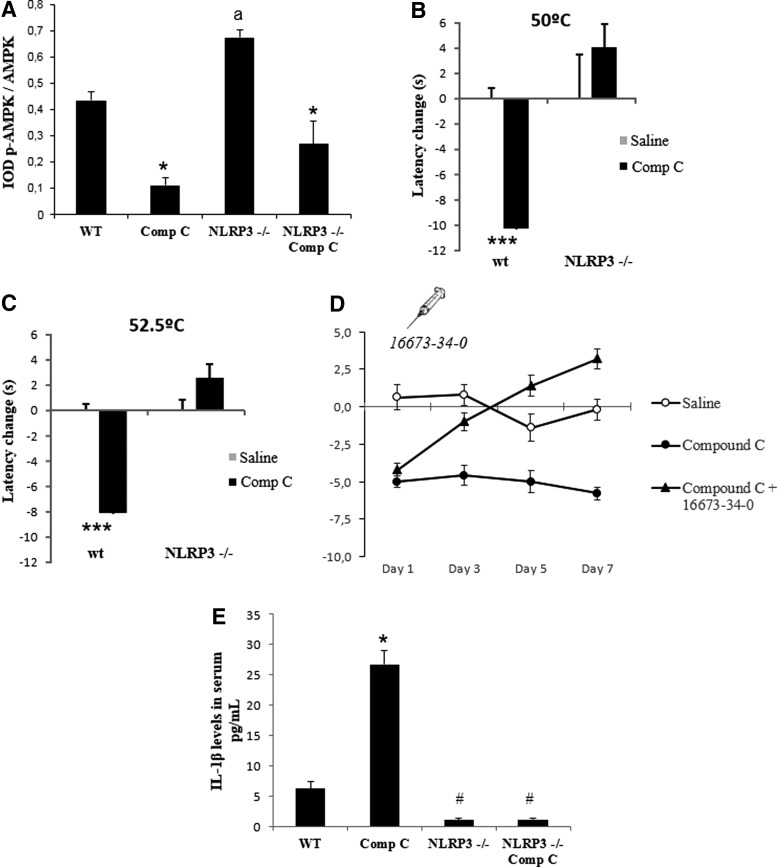
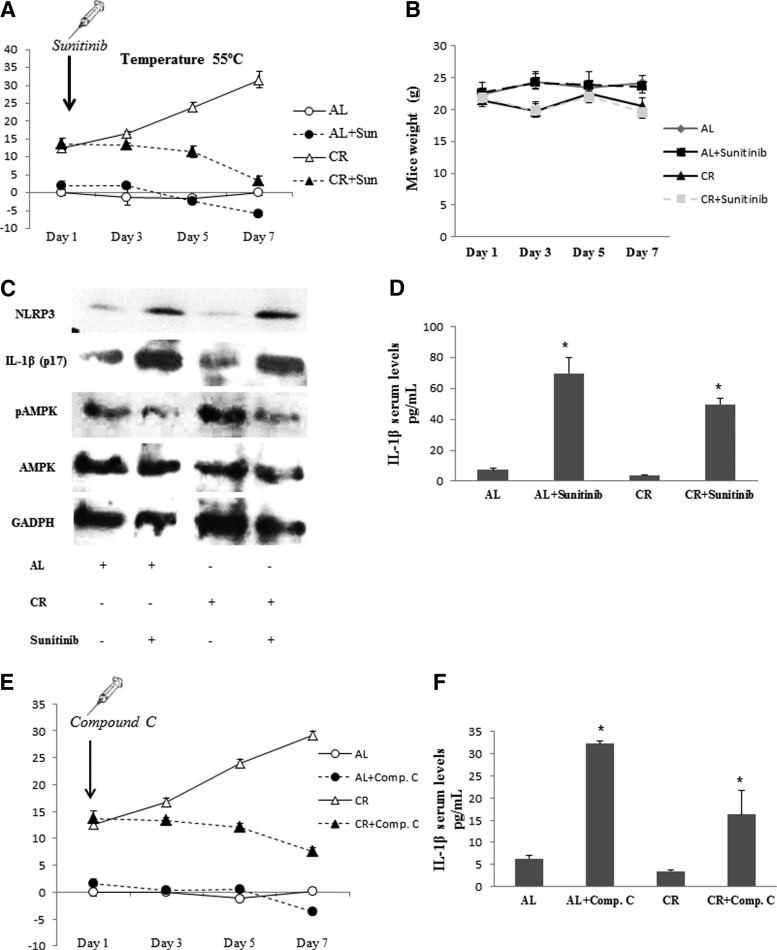
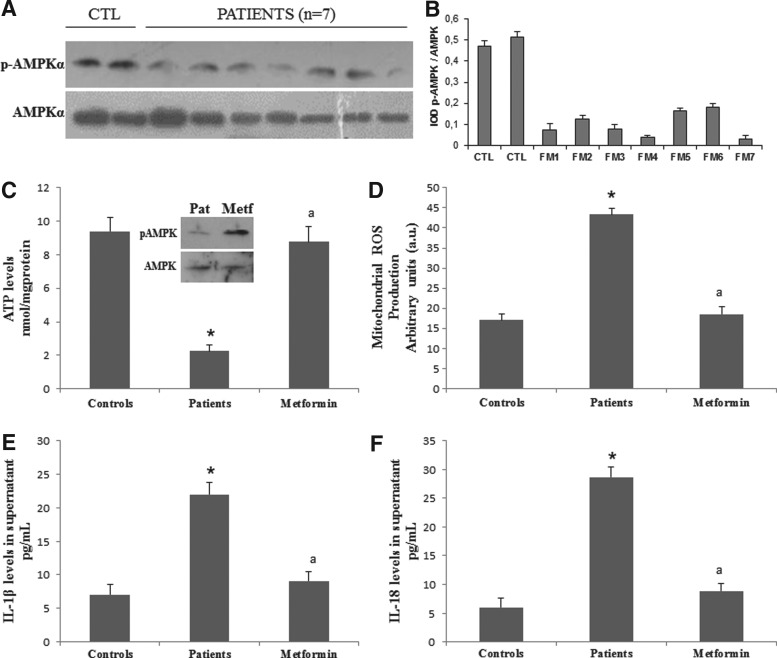
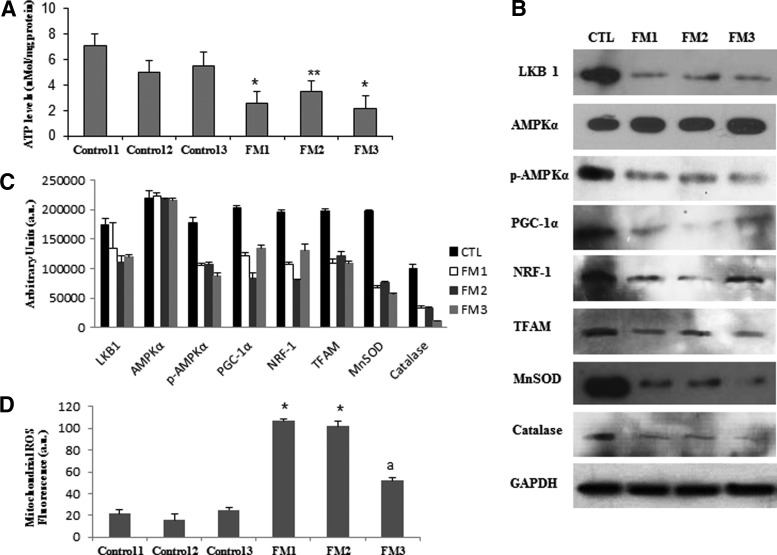
Aims: Impairment in adenosine monophosphate-activated protein kinase (AMPK) activity and NOD-like receptor family, pyrin domain containing 3 (NLRP3) inflammasome activation are associated with several metabolic and inflammatory diseases. In this study, we investigated the role of AMPK/NLRP3 inflammasome axis in the molecular mechanism underlying pain perception.

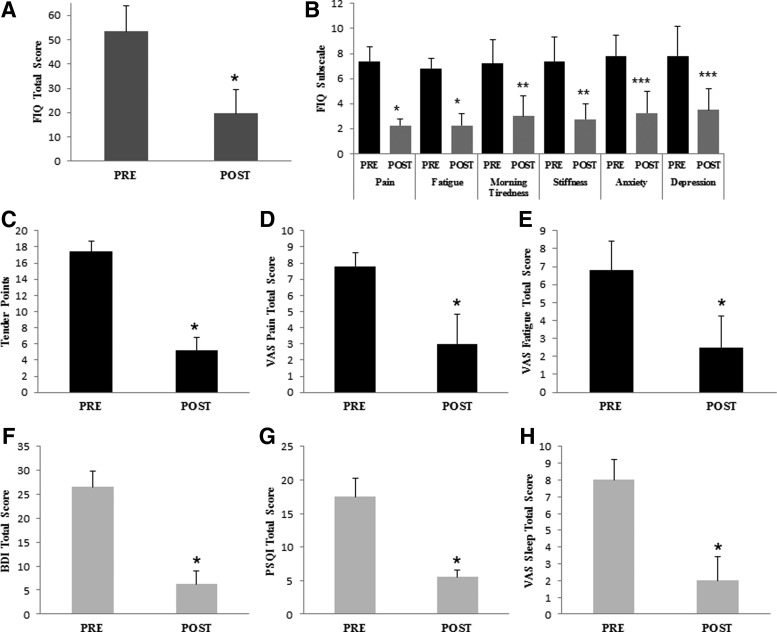
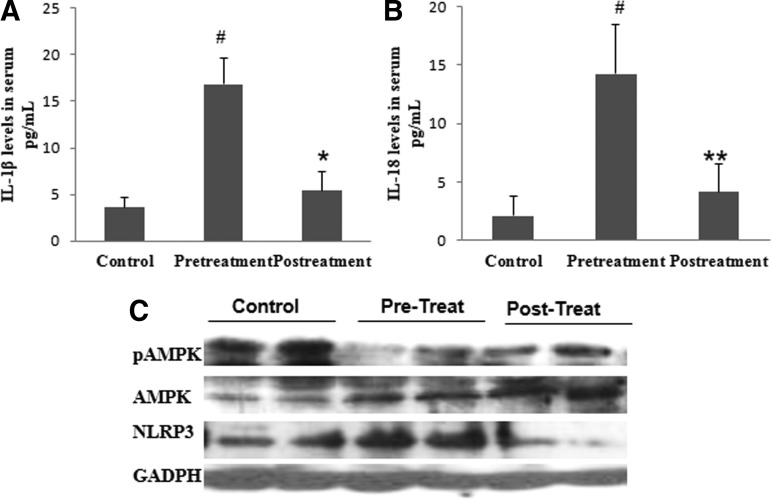
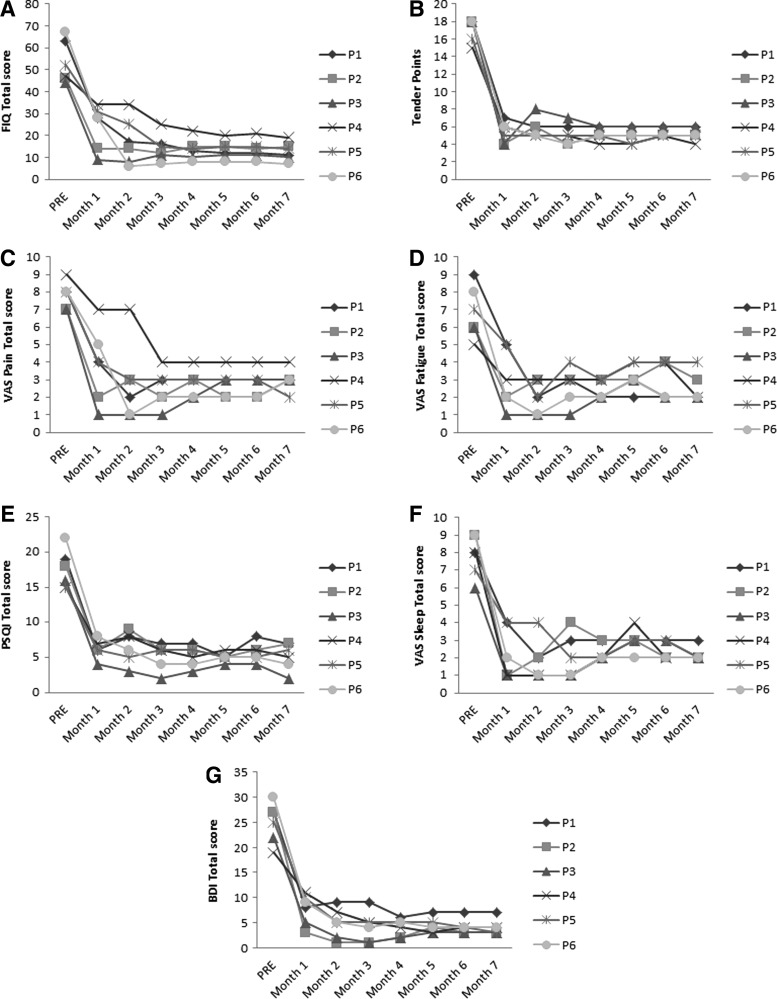
Results: Impairment in AMPK activation induced by compound C or sunitinib, two AMPK inhibitors, provoked hyperalgesia in mice (p<0.001) associated with marked NLRP3 inflammasome protein activation and increased serum levels of interleukin-1β (IL-1β) (24.56±0.82 pg/ml) and IL-18 (23.83±1.882 pg/ml) compared with vehicle groups (IL-1β: 8.15±0.44; IL-18: 4.92±0.4). This effect was rescued by increasing AMPK phosphorylation via metformin treatment (p<0.001), caloric restriction diet (p<0.001), or NLRP3 inflammasome genetic inactivation using NLRP3 knockout (nlrp3(-/-)) mice (p<0.001). Deficient AMPK activation and overactivation of NLRP3 inflammasome axis were also observed in blood cells from patients with fibromyalgia (FM), a prevalent human chronic pain disease. In addition, metformin treatment (200 mg/daily), which increased AMPK activation, restored all biochemical alterations examined by us in blood cells and significantly improved clinical symptoms, such as, pain, fatigue, depression, disturbed sleep, and tender points, in patients with FM.

Innovation and conclusions: These data suggest that AMPK/NLRP3 inflammasome axis participates in chronic pain and that NLRP3 inflammasome inhibition by AMPK modulation may be a novel therapeutic target to fight against chronic pain and inflammatory diseases as FM.


Figures

<b>FIG. 1.</b>
FIG. 1.
Inflammasome activation induced by AMPK inhibition in mice and effect of metformin treatment. N=10 per group. (A) Protein levels of phosphorylated and nonphosphorylated AMPK (anti-AMPK and anti-pAMPK; Cell Signaling) and NLRP3 (anti-NLRP3; Adipogen) from vehicle- and compound C-treated mice compared with GADPH protein in BMCs. *p<0.001, **p<0.05 between vehicle and compound C-treated mice; ap<0.001 and aap<0.001 between compound C-treated mice and metformin. (B, C) IL-1β and IL-18 in serum levels from mice treated with the vehicle or compound C and the reduction after metformin treatment. *p<0.001 between vehicle and compound C-treated mice; ap<0.001 between compound C-treated mice and metformin. (D) Pain sensitivity in vehicle- and compound C-treated mice was evaluated in the hot plate test at 50–52.5 and 55°C±0.5°C. *p<0.05. (E, F) Evolution of pain sensitivity in vehicle- and compound C-treated mice treated with metformin evaluated in the hot plate test at 50°C and 55°C. Data are shown as change of withdrawal latency with respect to the control group. Negative and positive values represent hyperalgesia and analgesia, respectively.*p<0.001 between vehicle and compound C-treated wild-type mice. AMPK, adenosine monophosphate-activated protein kinase; BMCs, blood mononuclear cells; IL-1β, interleukin-1β; NLRP3: NOD-like receptor family, pyrin domain containing 3. To see this illustration in color, the reader is referred to the web version of this article at www.liebertpub.com/ars
<b>FIG. 2.</b>
FIG. 2.
pAMPK phosphorylation levels, ATP, mitochondrial mass (citrate synthase), and lipid peroxidation in BMCs from mice treated with vehicle or compound C for 10 days (n=8 per group). (A) pAMPK phosphorylation levels, (B) ATP, (C) mitochondrial mass (citrate synthase), and (D) lipid peroxidation in BMCs from mice treated with vehicle or compound C for 10 days (n58 per group). All parameters were restored after metformin treatment. Data represent the mean±SD of three separate experiments. *p<0.001; **p<0.01 between control and compound C; ap<0.001 between compound C and metformin. ATP, adenosine triphosphate.
<b>FIG. 3.</b>
FIG. 3.
AMPK inhibition in NLRP3 inflammasome-depleted mice. N=10 per group. (A) Protein levels of phosphorylated AMPK in BMCs from vehicle- and compound C-treated wt and Nlrp3(−/−) mice. ap<0.001 between wt and Nlrp3(−/−) mice.*p<0.001 between vehicle and compound C-treated wild-type mice. Western blot image was quantified using ImageJ software (http://rsb.info.nih.gov/ij/download.html). (B, C) Depletion of NLRP3 in mice induced reduced levels of pain in Nlrp3(−/−) mice compared with wild-type mice after compound C treatment. ***p<0.001 between control and control treated with compound C in the hot plate test at 50°C and 52°C, respectively. (D) Pharmacological inhibition of NLRP3 by 166673-34-0 in mice induced reduced levels of pain after compound C-treated mice compared with saline and compound C. Data are shown as change of withdrawal latency with respect to the control group. Negative and positive values represent hyperalgesia and analgesia, respectively. (E) IL-1β in serum levels from wild-type and Nlrp3(−/−) mice treated with the vehicle or compound C. *p<0.001 between vehicle and compound C-treated wild-type mice. #p<0.001 between Nlrp3(−/−) mice and wild-type mice.
<b>FIG. 4.</b>
FIG. 4.
AMPK and NLRP3 inflammasome modulation by CR. N=10 per group. (A) Evolution of pain sensitivity in AL and CR mice treated with sunitinib evaluated in the hot plate test at 55°C. Sunitinib treatment started after 1 month of AL and CR. Data are shown as change of withdrawal latency with respect to the control group. Negative and positive values represent hyperalgesia and analgesia, respectively. (B) Evolution of weight in AL and CR mice treated with sunitinib. (C) Protein levels of phosphorylated AMPK, NLRP3, and matured IL-1β (p17) from sunitinib-treated mice after 15 days of treatment. (D) IL-1β in serum levels from mice treated with sunitinib after 15 days of treatment in AL or CR conditions. *p<0.001 between vehicle and sunitinib-treated mice. (E) Evolution of pain sensitivity in AL and CR mice treated with compound C evaluated in the hot plate test at 55°C. (F) IL-1β in serum levels from mice treated with compound C after 15 days of treatment in AL or CR conditions. *p<0.001 between vehicle and compound C-treated mice. AL, ad libitum; CR, caloric restriction.
<b>FIG. 5.</b>
FIG. 5.
Mitochondrial bioenergetic inflammasome and AMPK activation pathway in BMCs from patients with FM and the effect of metformin. (A) Protein expression levels of phosphorylated AMPK determined in control and FM BMCs from seven patients. (B) Protein levels were determined by densitometric analysis (IOD, integrated optical density) of three different Western blots and normalized to total AMPK signal, using BMCs from patients with FM, compared with a pool of five healthy age- and sex-matched control subjects. (C) ATP levels in control and FM BMCs with metformin. (D) Effect of metformin in mitochondrial ROS production analyzed in BMCs from control and patients with FM. (E, F) IL-1β and IL-18 levels in the culture media of BMCs from FM patients incubated with metformin for 24 h and analyzed by ELISA. Data represent the mean±SD of three separate experiments. *p<0.001 between control and FM patients cells. ap<0.001 between patients with FM cells with and without metformin. FM, fibromyalgia; ROS, reactive oxygen species.
<b>FIG. 6.</b>
FIG. 6.
Mitochondrial bioenergetic and AMPK activation pathway in fibroblasts from patients with FM. (A) ATP levels in control and FM fibroblasts. Data represent the mean±SD of three separate experiments. *p<0.001; **p<0.01 between control and patients with FM. (B) Protein expression levels of antioxidants (MnSOD and catalase), mitochondrial biogenesis, and phosphorylated and nonphosphorylated AMPK determined in control and FM fibroblast cultures. (C) Protein levels were determined by densitometric analysis (IOD, integrated optical density) of three different Western blots and normalized to GADPH signal, using fibroblasts from patients with FM, compared with healthy age- and sex-matched control subjects. (D) Mitochondrial ROS production was analyzed in fibroblasts from control and three patients with FM by flow cytometry as described in the Materials and Methods section. Data represent the mean±SD of three separate experiments.*p<0.001, ap<0.01 between control and patients with FM.
<b>FIG. 7.</b>
FIG. 7.
Metformin improves clinical symptoms in patients with FM after 1 month of treatment. n=6 patients were treated with metformin. Clinical response of the patients after treatment by FIQ total score punctuation (A), several subitems from the FIQ as pain, fatigue, morning tiredness, stiffness, and depression (B), tender points (C), VAS about pain (D), fatigue (E), BDI (F), PSQI (G), and VAS sleep quality (H). Data represent the mean±SD.*p<0.001 between before and after metformin treatment in patients with FM. **p<0.01 between before and after metformin treatment in patients with FM. ***p<0.05 between before and after metformin treatment in patients with FM. BDI, Beck Depression Inventory; FIQ, Fibromyalgia Impact Questionnaire; PSQI, Pittsburgh Sleep Quality Index; VAS, visual analogue scale.
<b>FIG. 8.</b>
FIG. 8.
Biochemical improvement in FM patients after 1 month of treatment with metformin. (A, B) IL-1β and IL-18 levels in serum from patients after metformin treatment. (C) Protein expression levels of pAMPK and NLRP3 in BMCs from patients after oral treatment. Data represent the mean±SD. #p<0.001 between control and before metformin treatment in patients with FM. *p<0.001 between before and after metformin treatment in patients with FM.
<b>FIG. 9.</b>
FIG. 9.
Metformin long-term treatment after 7 months. (A) FIQ total score punctuation, (B) tender points, (C) VAS about pain, (D) fatigue, (E) PSQI, (F) VAS sleep quality, (G) BDI.

References

    1. Bagis S, Tamer L, Sahin G, et al. . Free radicals and antioxidants in primary fibromyalgia: an oxidative stress disorder? Rheumatol Int 25: 188–190, 2005 - PubMed
    1. Baroja-Mazo A, Martín-Sánchez F, Gomez AI, Martínez CM, Amores-Iniesta J, Compan V, Barberà-Cremades M, Yagüe J, Ruiz-Ortiz E, Antón J, Buján S, Couillin I, Brough D, Arostegui JI, and Pelegrín P. The NLRP3 inflammasome is released as a particulate danger signal that amplifies the inflammatory response. Nat Immunol 15: 738–748, 2014 - PubMed
    1. Bazzichi L, Giannaccini G, Betti L, Fabbrini L, Schmid L, Palego L, Giacomelli C, Rossi A, Giusti L, De Feo F, Giuliano T, Mascia G, Bombardieri S, and Lucacchini A. ATP, calcium and magnesium levels in platelets of patients with primary fibromyalgia. Clin Biochem 41: 1084–1090, 2008 - PubMed
    1. Colombo SL. and Moncada S. AMPKalpha1 regulates the antioxidant status of vascular endothelial cells. Biochem J 421: 163–169, 2009 - PubMed
    1. Cordero MD, Alcocer-Gómez E, Culic O, Carrión AM, de Miguel M, Díaz-Parrado E, Pérez-Villegas EM, Bullón P, Battino M, and Sánchez-Alcazar JA. NLRP3 inflammasome is activated in fibromyalgia: the effect of coenzyme Q10. Antioxid Redox Signal 20: 1169–1180, 2014 - PMC - PubMed

Publication types

MeSH terms