Review
. 2015 Jul 1:17:e13.
doi: 10.1017/erm.2015.11.

Detection of skewed X-chromosome inactivation in Fragile X syndrome and X chromosome aneuploidy using quantitative melt analysis

Affiliations
Review

Detection of skewed X-chromosome inactivation in Fragile X syndrome and X chromosome aneuploidy using quantitative melt analysis

David E Godler et al. Expert Rev Mol Med. .

Abstract

Methylation of the fragile X mental retardation 1 (FMR1) exon 1/intron 1 boundary positioned fragile X related epigenetic element 2 (FREE2), reveals skewed X-chromosome inactivation (XCI) in fragile X syndrome full mutation (FM: CGG > 200) females. XCI skewing has been also linked to abnormal X-linked gene expression with the broader clinical impact for sex chromosome aneuploidies (SCAs). In this study, 10 FREE2 CpG sites were targeted using methylation specific quantitative melt analysis (MS-QMA), including 3 sites that could not be analysed with previously used EpiTYPER system. The method was applied for detection of skewed XCI in FM females and in different types of SCA. We tested venous blood and saliva DNA collected from 107 controls (CGG < 40), and 148 FM and 90 SCA individuals. MS-QMA identified: (i) most SCAs if combined with a Y chromosome test; (ii) locus-specific XCI skewing towards the hypomethylated state in FM females; and (iii) skewed XCI towards the hypermethylated state in SCA with 3 or more X chromosomes, and in 5% of the 47,XXY individuals. MS-QMA output also showed significant correlation with the EpiTYPER reference method in FM males and females (P < 0.0001) and SCAs (P < 0.05). In conclusion, we demonstrate use of MS-QMA to quantify skewed XCI in two applications with diagnostic utility.


Figures
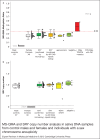
Figure 1.
Figure 1.
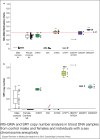
MS-QMA and SRY copy number analysis in saliva DNA samples from control males and females and individuals with a sex chromosome aneuploidy. There were 13 46,XY control males (<40 CGGs); 27 46,XX control females (<40 CGGs); 36 47,XXY Klinefelter syndrome males (confirmed by microarray analysis); 12 47,XXY treated as Klinefelter syndrome males (confirmed by androgen receptor methylation analysis and androgen receptor CAG repeat length heterozygocity; no karyotype available); 5 mosaics for 46,XY/47,XXY (confirmed by microarray analysis); and 4 46,XX males with an SRY translocation (confirmed by microarray analysis), 2 PM/FM size mosaic males, 1 FM male (a) The MR values were determined using MS-QMA; (b) The SRY/β-globin copy number ratios were determined using real-time PCR relative standard curve method. Note: the red broken line represents the maximum value of the female control group; the black broken line represents the optimal threshold value for detection of presence of one or more copies of Y chromosome. FM, full mutation; MR, methylation ratio; MS-QMA, methylation specific quantitative melt analysis; PCR, polymerase chain reaction; PM/FM, permutation/full mutation; SRY, sex determining region Y.
Figure 2.
Figure 2.
MS-QMA and SRY copy number analysis in blood DNA samples from control males and females and individuals with a sex chromosome aneuploidy. There were 19 46,XY control males (<40 CGGs); 48 46,XX control females (<40 CGGs); 4 47,XXY Klinefelter syndrome males; 10 45,X Turners syndrome females; 8 47,XXX females; 4 47,XYY males; 1 48,XXYY/47,XXY mosaic male; 2 48,XXXY males; and 4 49,XXXXY males. All were confirmed by microarray analysis. (a) The MR values determined using MS-QMA; (b) The SRY / β-globin copy number ratios determined using real-time PCR relative standard curve method. Note: the red broken line represent the maximum value of the female control group; the black broken line is the threshold value that optimally separates samples with one or more copies of the Y chromosome. Red arrow highlights a 45,X sample with SRY/β-globin ratio above the positive threshold of 0.1. Because the Y chromosome was not detected using microarray analysis in this sample and SRY FISH could not be performed because of blood sample unavailability, this result may be either a false positive or a true positive where real-time PCR may be a more sensitive approach for detection of low level mosaicism. For comparisons with 46,XY controls ### P < 0.001 for SRY cioy munber and 46,XX controls *** P < 0.001 for MS-QMA MR, nonparametric Mann–Whitney test for median was used. FISH, fluorescence in situ hybridisation; MR, methylation ratio; MS-QMA, methylation specific quantitative melt analysis; PCR, polymerase chain reaction; SRY, sex determining region Y.
Figure 3.
Figure 3.
FREE2 methylation comparisons between 50 FM males and 95 FM females assessed with MS-QMA and MALDI-TOF MS MS-QMA targets seven CpG sites within FMR1 intron 1 including CpG10-12 and three sites within exon 1; whereas MALDI-TOFMS CpG10-12 MOR is specific only for methylation of CpG10-12. Note: all comparisons between FM males and FM females showed P < 0.001; ∗∗∗ comparisons for MS-QMA mean values, with two-sample t-test used as the data were normally distributed; ### comparison for MALDI-TOF MS between median values of the FM groups, with nonparametric Mann–Whitney test used because of the data not being normally distributed. The bell shaped curve represents the expected normal distribution for the FM females methylation values if the X-inactivation at the locus were random, with mean methylation ratio of 0.75, the higher tail of distribution at 1 and the lower tail of distribution at 0.5. FM, full mutation; FMR1, Fragile X mental retardation 1; FREE2, fragile X related epigenetic element 2; MALDI-TOF MS, Matrix-assisted laser desorption/ionisation time of flight mass spectrometry; MS-QMA, methylation specific quantitative melt analysis; MOR, methylation output ratio.

References

    1. Tost J, Gut I.G. (2012) DNA methylation analysis by MALDI mass spectrometry In Meyers: Encyclopedia of Molecular Cell Biology and Molecular Medicine: Epigenetic Regulation and Epigenomics (2nd edn) (Meyers R.A. ed.), pp. 1-40, Wiley-VCH Verlag GmbH & Co. KGaA.
    1. Coolen M.W. et al. (2007) Genomic profiling of CpG methylation and allelic specificity using quantitative high-throughput mass spectrometry: critical evaluation and improvements. Nucleic Acids Research 35, e13 - PMC - PubMed
    1. Godler D.E. et al. (2010) Methylation of novel markers of fragile X alleles is inversely correlated with FMRP expression and FMR1 activation ratio. Human Molecular Genetics 19, 1618-1632 - PMC - PubMed
    1. Godler D.E. et al. (2012) Fragile X mental retardation 1 (FMR1) intron 1 methylation in blood predicts verbal cognitive impairment in female carriers of expanded FMR1 alleles: evidence from a pilot study. Clinical Chemistry 58, 590-598 - PubMed
    1. Godler D.E. et al. (2011) FMR1 intron 1 methylation predicts FMRP expression in blood of female carriers of expanded FMR1 alleles. Journal of Molecular Diagnostics: JMD 13, 528-536 - PMC - PubMed

Publication types

MeSH terms